HK inno.N Q2 Results: Why K-CAB Prescriptions and Sales Diverge
Two numbers came out of the same quarter, for the same drug, at the same company. One is 61.5 billion won. The other is 49.3 billion won. The first grew 15.4 percent from a year earlier. The second grew 0.3 percent. When I look at HK inno.N stock, only the second one is the number I would ever own, and most of the reason I am only watching this company sits in the space between those two lines.
The company is HK inno.N (KOSDAQ: 195940), a Korean pharmaceutical maker best known for K-CAB, the first potassium-competitive acid blocker developed in Korea for acid reflux. KOSDAQ is the smaller of Korea’s two main boards, the venture and mid-cap listing venue that sits alongside the larger KOSPI, and it carries a different investor mix and a thinner foreign presence than the main board. HK inno.N was CJ Healthcare until Kolmar Korea bought it in 2018 and renamed it in 2020, as Korean press reported at the time.
Contents
What HK inno.N stock actually printed in the second quarter
The company reported on July 29, 2026 (Wed). On a consolidated basis, second quarter revenue was 267.2 billion won, up 1.6 percent from a year earlier. Operating profit was 30.0 billion won, up 53.6 percent. Net profit was 13.7 billion won, up 13.6 percent. The year-ago quarter carried 263.1 billion won of revenue and 19.5 billion won of operating profit. Operating margin therefore moved from 7.41 percent to 11.23 percent, both my calculations. In dollars at the August 7, 2026 (Fri) exchange rate, quarterly revenue was roughly 189 million and operating profit roughly 21 million.
First half revenue was 525.9 billion won, up 3.0 percent, with operating profit of 63.2 billion won, up 40.8 percent. Subtract the second quarter and the first quarter comes back as 258.7 billion won of revenue and 33.2 billion won of operating profit, my calculation, which puts the first quarter operating margin at 12.83 percent. That is above the second quarter, which is worth holding in mind before anyone calls this an accelerating story.
Inside the same release sit the K-CAB figures. Domestic outpatient prescriptions in the second quarter came to 61.5 billion won against 53.3 billion won a year earlier, up 15.4 percent. K-CAB product revenue was 49.3 billion won, up 0.3 percent. Finished-product exports inside that line were 4.5 billion won, up 337.3 percent. First half cumulative prescriptions reached 120.0 billion won, which is 55.07 percent of the 217.9 billion won the drug did across all of 2025, my calculation. Those figures are carried in Korean trade press coverage of the quarter and in a separate Korean report on the same release.
Q2 2025 90.29%
Full year 2025 83.98%
Q2 2026 72.85%
All three are my calculations. Domestic revenue is total K-CAB revenue less the export line, on the same basis the company used when it disclosed 2025 K-CAB revenue of 195.7 billion won “including 12.7 billion won of exports.”
Strip the export line out of both quarters and the domestic number moves the other way. Second quarter 2026 domestic K-CAB revenue comes to 44.8 billion won. Reversing the year-ago quarter the same way, using the two disclosed growth rates, gives 49.15 billion won of total K-CAB revenue and about 1.03 billion won of exports, so 48.12 billion won domestic. That is a decline of 6.9 percent, all my calculation. Domestic prescriptions grew 15.4 percent in the same three months.
I want to be direct about what this rests on. The company disclosed 2025 K-CAB revenue as 195.7 billion won including 12.7 billion won of exports, so I assumed the quarterly 49.3 billion won is compiled the same way and subtracted the 4.5 billion won export figure. If the quarterly disclosure uses a different basis, the arithmetic above does not hold. I could not settle that from anything short of the half-year regulatory filing, and I am not going to pretend otherwise.
Why the two figures were never going to match
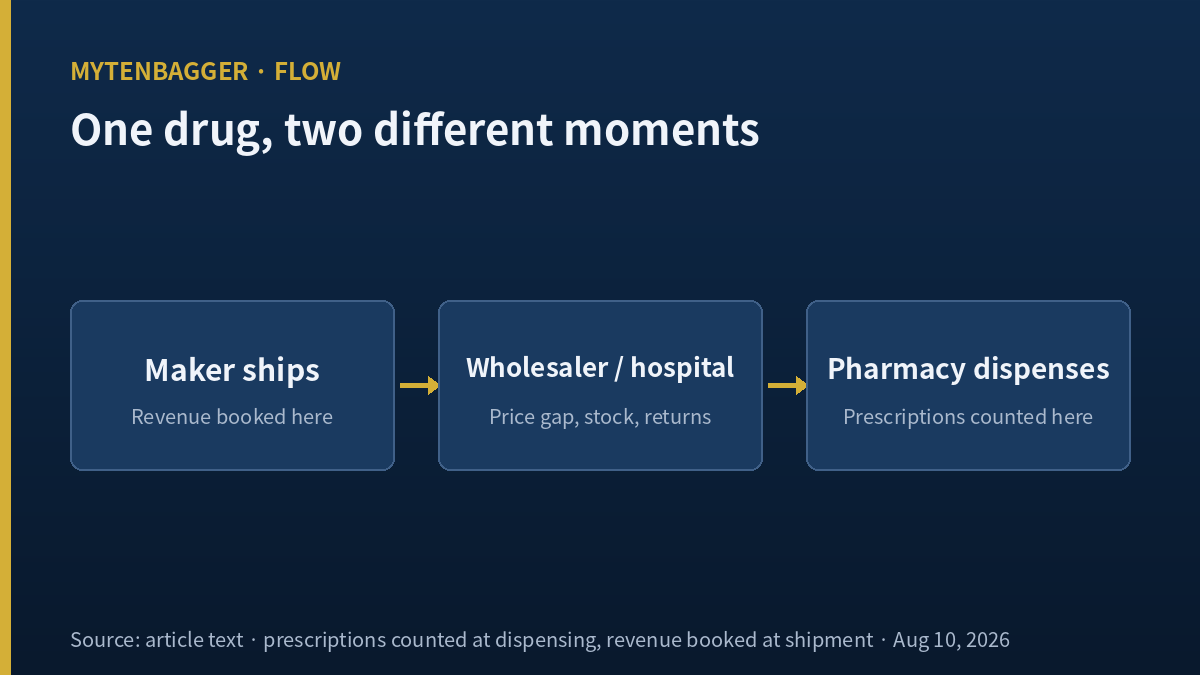
An outpatient prescription figure is what an external tracker counts when a pharmacy dispenses a drug. Company revenue is what the manufacturer books when it sells to a wholesaler or a hospital. The two were never the same number. There is a markup taken at the distribution step, there is inventory sitting between the wholesale sale and the moment a pharmacy hands the box over, and there are returns and discount terms bolted on. So the gap itself is not the finding. The size of the gap, and how far it moves quarter to quarter, is the finding.
Across the three periods in the box above the ratio swings through more than seventeen percentage points. A ratio that moves that much cannot be called a trend on one quarter of evidence. At the same time, a ratio that moves that much also cannot be read straight across, which is what happens every time a prescription growth rate gets quoted as if it were a company growth rate. Both of those statements are true at once, and holding both is the whole reason I am writing this down instead of acting on it.
The 53.6 percent jump in operating profit did not come from that domestic line. Intravenous solutions revenue rose 13.7 percent to 38.5 billion won. K-CAB exports more than quadrupled. Royalty income from China and elsewhere, by the company’s own account, started coming through in volume. Revenue up 1.6 percent with operating profit up 53.6 percent tells me the composition of the earnings changed. Partner-funded income moves the revenue line hardest at a company that has little else on it: LigaChem Biosciences booked an 83% sales drop in the same quarter when the milestone payments did not land. This quarter was not paid for by selling more units. It was paid for by mixing in items with a different cost structure, and mix is a less durable thing to own than volume.
What multiple HK inno.N stock is currently carrying
The August 7, 2026 (Fri) close was 41,600 won, about 29.4 dollars. Multiply by 28,329,327 shares outstanding and market capitalization comes to 1.1785 trillion won, roughly 832 million dollars, which matches the displayed market cap to the won. The screen carries a trailing price-to-earnings ratio of 15.57, price-to-book of 0.89, and price-to-sales of 1.11.
Because the vendor derives its earnings per share from price divided by the ratio, I checked the reference period a different way. Dividing 2025 net profit of 75.7 billion won by the share count gives 2,672.1 won, against the displayed precise figure of 2,671.8 won, a difference of 0.01 percent. So the 15.57 multiple is looking at the 2025 fiscal year. It is not looking at the improvement in the first half of 2026, which is exactly the kind of period mismatch I walked into once before in the piece where the multiple moved the wrong way.
| Item | Value | Basis |
|---|---|---|
| Close | 41,600 won / $29.4 | August 7, 2026 (Fri) |
| Market capitalization | 1.1785tn won / $832m | close × 28,329,327 shares |
| P/E, P/B, P/S | 15.57 / 0.89 / 1.11 | vendor trailing, FY2025 |
| FY2025 revenue / op profit / net | 1,063.1 / 110.9 / 75.7bn won | consolidated, Korean press |
| Return on equity / operating margin | 5.9% / 10.43% | FY2025 |
| Q2 2026 operating margin | 11.23% | 30.0 ÷ 267.2, my calculation |
| Debt to equity (Korean basis) / interest cover | 54.61% / 7.43× | FY2025 |
| Dividend per share / yield | 410 won / 0.99% | FY2025 declared, on the close |
| 250-day high / low | 58,600 / 34,800 won | intraday basis |
| Position versus high | 70.99% (−29.01%) | 41,600 ÷ 58,600, my calculation |
| Foreign ownership | 13.72% | August 7, 2026 (Fri) |
Screen values are Kiwoom data at the August 7, 2026 close, checked at the time of writing. Dollar figures are approximate, at roughly 1,416 won per dollar on the same date, and the The financial-basis label on the screen reads standalone, but the revenue, operating profit and net profit values match the consolidated figures Korean press reported, so I treated the press consolidated numbers as the source and set the label aside. Total equity is empty on the screen, so I derived 1.3284 trillion won from book value per share of 46,890 won multiplied by the share count, which reproduces the 0.887 price-to-book. Paid-in capital of 14.5 billion won divided by the share count gives 511.8 won, which does not sit on a conventional par value, so I used no paid-in capital figure anywhere in this piece. The cash flow and depreciation fields are shown on a scale that does not reconcile with the operating profit line, so I excluded them.
Dividend arithmetic closes three ways. 410 won on a 41,600 won close is 0.986 percent, against the displayed 0.99 percent yield. 410 won multiplied by the share count gives 11.62 billion won, which against 75.7 billion won of net profit is a 15.34 percent payout, against the displayed 15.3 percent. Yield multiplied by the price-to-earnings ratio gives 15.35, the same place. Three routes agreeing means I can use these dividend figures without further checking. A 0.99 percent yield is still not a reason for me to own anything. The declared dividend has risen from 320 won in 2022 to 350 won in 2023 and 2024 and 410 won for 2025.
K-CAB is 18.4% of revenue and 100% of the story
Here is the figure that stopped me. K-CAB revenue of 49.3 billion won against second quarter consolidated revenue of 267.2 billion won is 18.45 percent, my calculation. For the 2025 fiscal year, 195.7 billion won against 1,063.1 billion won is 18.41 percent, also mine. The two periods sit on top of each other. So this is a company where under a fifth of revenue is the drug, and yet almost everything written about it, including the first half of this piece, is about the drug.
Where is the rest. On 2025 figures the company disclosed intravenous solutions at 33.5 billion won, oncology products including a bevacizumab biosimilar at 30.0 billion won, and the Condition hangover-relief drink at 14.5 billion won, with the remainder inside an undivided prescription-drug block, per Korean coverage of the full-year result. In the second quarter of 2026 the intravenous line grew 13.7 percent to 38.5 billion won, and the health and beauty segment posted 20.6 billion won of revenue with a 1.5 billion won operating loss, narrower than the 1.7 billion won loss a year earlier but still a loss. Condition revenue was 14.2 billion won, up 7.9 percent.
Reading that composition honestly shrinks my own thesis. A 6.9 percent decline in domestic K-CAB revenue happened inside roughly seventeen percent of consolidated revenue. That is not a sentence about the whole company. I still lead with it because the valuation narrative around this name rests on one product, and it is the weight in the story, not the weight in the revenue mix, that decides what a buyer is paying for. That distinction is the same one I had to make in the piece where a quarter of the profit was not mine to buy, though the structure there was several businesses inside one listing, and here the affiliate is separately listed, so the shapes are not the same.
The company selling the same drug class in America is still losing money
The next chapter for this company is the United States, so I put up the one company that is already selling a drug in the same class into that market. Phathom Pharmaceuticals (NASDAQ: PHAT) sells VOQUEZNA, a potassium-competitive acid blocker, for erosive reflux disease. It is not a competitor of HK inno.N in any market they both operate in, and no screener groups them together. It is simply the only live sample of what it costs to open the American gastrointestinal market with a drug of this class.
| Item | Phathom (PHAT) | HK inno.N |
|---|---|---|
| Market capitalization | $665.62m | $832m (derived) |
| Trailing 12-month revenue | $239.66m (+110.2%) | $751m FY2025 (derived) |
| Trailing 12-month net result | −$99.07m | +$53m FY2025 (derived) |
| Price versus 52-week high | 45.77% (−54.23%, derived) | 70.99% (−29.01%, derived) |
Phathom figures are as displayed by stockanalysis.com for the August 7, 2026 (Fri) close. The four derived ratios and the dollar conversions of the Korean figures are mine. The revenue periods are not the same: Phathom is trailing twelve months, HK inno.N is the 2025 fiscal year.
Phathom’s revenue grew 110.2 percent over twelve months to 239.66 million dollars. That is larger than the 195.7 billion won, roughly 138 million dollars, that K-CAB produced for HK inno.N across all of 2025. Over the same twelve months Phathom lost 99.07 million dollars, and the shares sit at 45.77 percent of the 52-week high. This is not a demand problem. The revenue growth rate settles the demand question. It is a cost-of-access problem, and KB Securities described the mechanism in an August 3, 2026 (Mon) note: American pharmacy benefit managers require documented failure on proton pump inhibitor therapy before covering a P-CAB, and the prior-authorization paperwork is complex and takes days to clear. That note is summarized here in Korean, and Phathom’s numbers are on its stockanalysis.com page.
Seven things working against what HK inno.N stock is priced for
Below are the materials that push against this piece. The order is the order in which I confirmed them.
- The sell-side already cut its American assumption. KB Securities kept a buy view on August 3, 2026 (Mon) and carried 70,000 won at the top of the note, down from 77,000 won, a reduction of 9.09 percent by my arithmetic. The house also lowered its American K-CAB revenue estimate from 500 million dollars to 400 million. I am quoting that as a fact reported by a Korean brokerage, and I have not adopted it as my own view.
- Patent protection got shorter. Korean trade press reported on July 14, 2026 (Tue) that the company lost a crystalline-form patent case, leaving only the substance patent expiring in 2031 where protection could have run to 2036. Industry voices quoted in the same report expect generics to take time anyway, given remaining patents and overseas regulatory steps, but five years came off the outside edge.
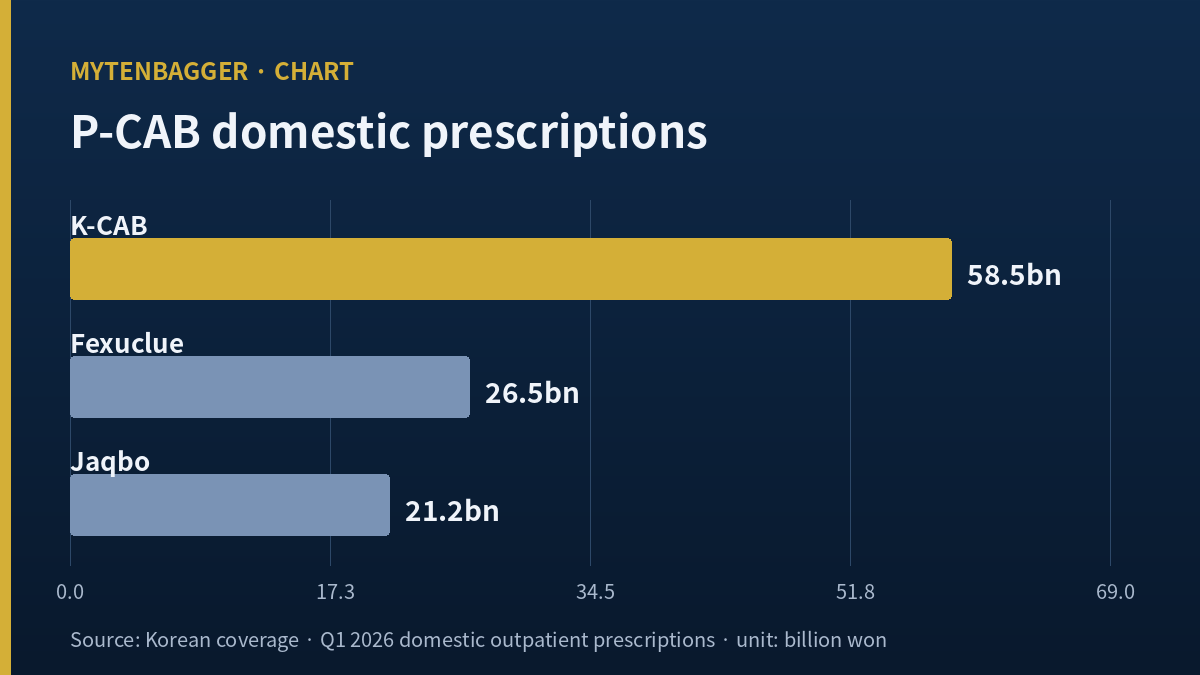
- The domestic market hardened into three players. The same report puts first quarter 2026 domestic prescriptions at 58.5 billion won for K-CAB, 26.5 billion won for Fexuclue, and 21.2 billion won for Jaqbo, with Jaqbo up 218 percent year on year and reaching second place on a monthly prescription basis in April. The 15.4 percent prescription growth I opened with happened inside that.
- My own ratio swings too hard to lean on. Domestic revenue over domestic prescriptions came to 90.29 percent, 83.98 percent and 72.85 percent across the three periods in the box above, all my calculations. A range that wide means one quarter of decline cannot be called a structural change. Wholesale inventory timing alone can move it that far. This single line sets the strength of everything else in the piece.
- A large share of the profit growth vanished below the operating line. Operating profit rose 10.5 billion won, from 19.5 to 30.0. Net profit rose 1.64 billion won, from 12.06 to 13.7, the year-ago figure derived from the disclosed growth rate. So 8.86 billion won went somewhere between those two lines. Whether that is non-operating items or tax is not separable from what has been published, so I have not assigned a cause.
- Health and beauty keeps losing money. Second quarter revenue of 20.6 billion won against a 1.5 billion won operating loss. Small enough not to move the consolidated result, but I have not yet seen a quarter where this segment turned positive.
- This last one is a gap in my work, not a mark against the company. I could not confirm the American partnership terms, the royalty rate and milestone structure, from primary documents. Those terms decide how much of any American revenue reaches this company’s income statement. I could write around that gap, and I have chosen instead to put no estimate of American royalty size anywhere in this piece.
Of those seven, items one through three and five and six are judgments about the company. The other two are a different species. Item four says my calculation may not be sturdy, and item seven says I could not finish the research. What keeps me out of the shares is that pair, not the five. That is a statement about the state of my own information, and blurring it would turn an observation log into a bear case, which is not what this is.
The numbers printed above HK inno.N stock, and the one I do not print
Coverage is alive. KB Securities on August 3, 2026 (Mon), Korea Investment & Securities on April 10, 2026 (Fri), and Daol Investment & Securities on April 29, 2026 (Wed) all carry 70,000 won at the top of their notes. I read the summary text of the first and confirmed only the note titles and that figure for the other two. All three sit 68.3 percent above the August 7, 2026 (Fri) close of 41,600 won, my calculation. I quote them as published facts by named Korean houses. I do not adopt them, and I print no number of my own above this company.
Meanwhile the forward earnings-per-share field, the forward multiple field and the peer multiple field on my screen are all empty, with more than three houses publishing. I have now met the same situation three pieces running, so I have stopped reading an empty field as an absence of coverage. One large Korean financial portal displays a 2,421 won forward earnings estimate and a 65,778 won average, with no reference year and no compilation date shown, so that pair went into none of the arithmetic here.
Share count, checked before anything was divided by it
Every multiple in this piece rests on the share count, so I checked it separately. I found no bonus issue, stock split, rights offering, treasury share cancellation or capital reduction in the first half of 2026 or the two quarters before it, and the vendor’s split-detection flag is off. Market capitalization computed from 28,329,327 shares matches the displayed figure to the won, which confirms the count is current. The three published valuations all sit on the same count, so none of them needs adjusting.
What would change my mind on HK inno.N stock
Two conditions would change my read. First, domestic K-CAB revenue catching back up to domestic prescription growth in the third or fourth quarter of 2026. If the ratio returns to the eighties, then 72.85 percent was inventory timing and my reading was wrong. Second, American revenue starting to appear in the income statement with the recognition terms disclosed. Phathom shows that in America, revenue arriving and profit arriving are separate events, and I am not buying a US revenue forecast while the contract terms sit outside what I can read.
What would retire this observation. If domestic prescriptions keep compounding at double digits while the domestic revenue ratio stays in the seventies for two consecutive quarters, then this is not an inventory question, it is a change in distribution terms, and the piece needs rewriting on those grounds. If instead the ratio clears 85 percent in a single quarter, I mistook quarterly noise for an argument and this piece is finished. Both tests need exactly two figures, and the company publishes both of them together every quarter.
the piece where what I was paying for had a printed end date
What I stopped saying
What changed this quarter is smaller and more useful. I have stopped calling this a K-CAB company. It is a company where K-CAB is 18.4 percent of revenue and effectively all of the narrative, and those are two different sentences that I had been running together. Whenever I next see a prescription figure quoted in a headline about this name, I will go find the booked revenue figure and write the two down side by side, because only the pair of them shows what a shareholder is actually buying. That habit, not a conclusion, is what this quarter gave me.
Sources consulted:
Korean report on the Q2 2026 result, July 31, 2026 ·
Korean trade press on the Q2 2026 result, July 29, 2026 ·
Korean coverage of FY2025 results, February 11, 2026 ·
Korean report on P-CAB competition and the patent ruling, July 14, 2026 ·
Korean outlook piece on the three-way P-CAB market ·
KB Securities note summary, August 3, 2026 ·
Korea Investment & Securities note briefing, April 10, 2026 ·
Daol Investment & Securities note briefing, April 29, 2026 ·
Phathom Pharmaceuticals data ·
Korean report on the August 7, 2026 won close