Lotte Tour Development Stock Holds Three Years of Its Revenue
The company behind this ticker owns one building on Jeju Island, and that building is 72.06 percent of everything on its balance sheet. I went into Lotte Tour Development stock expecting to write about a casino recovery, because that is what the operating numbers look like. I came out of it having ranked eight companies by a ratio nobody quotes in a headline.
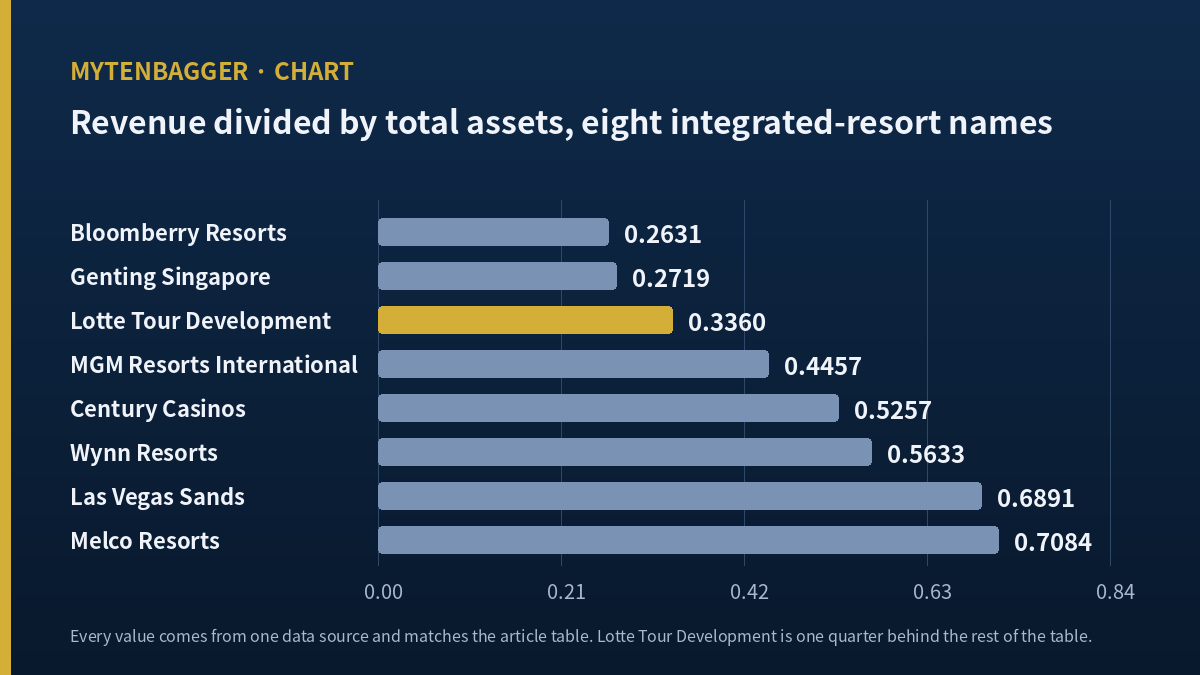
The ratio is total assets divided by revenue. For this company it is 2.98. For the median of the seven global operators I put next to it, it is 1.90. That gap is the piece.
| What I measured | This company | Peer median (7) | As of |
|---|---|---|---|
| Revenue divided by total assets | 0.3360 | 0.5257 | Jun 30, 2026 |
| Years of revenue held in assets | 2.98 | 1.90 | derived |
| Rank among the eight, lowest first | 3rd | n/a | n/a |
Contents
What Lotte Tour Development Stock Is A Claim On
One address, 72.06 percent of the balance sheet
Korean broadcaster FETV reported in July that the Jeju Dream Tower complex is pledged as collateral against the company’s borrowings, and it put land at 635.3 billion won and buildings at 937.2 billion won, for property, plant and equipment of 1,572.5 billion won (FETV, July 2, 2026). Consolidated total assets at June 30, 2026 were 2,182.1 billion won, from the half-year report filed with Korea’s electronic disclosure system on August 13, 2026 (receipt 20260813001149). Dividing one into the other gives 72.06 percent, by my calculation.
The same article puts long-term borrowings at 950.0 billion won, split into a 800.0 billion won senior tranche at 6 percent and a 150.0 billion won junior tranche at 9 percent. So the asset that dominates the balance sheet is also the security for most of the debt. Roughly 1.15 billion US dollars of property stands behind roughly 694 million dollars of long-term debt, using the exchange rate footnoted at the end.
A KOSPI listing, and a company name that misleads
The ticker is 032350 on the KOSPI, the senior board of the Korea Exchange and the market most foreign index products route through when they buy Korea. The name translates as Lotte Tour Development and the company began life as a travel agency. It does not run on that business now. In the second quarter of 2026 the Jeju property produced 192.6 billion won of revenue against consolidated revenue of 203.27 billion for the same quarter, which is 94.75 percent, by my calculation. The two figures come from different disclosures, a quarterly operating release and the half-year report, so treat the percentage as indicative. Anyone screening Korean names by industry label will file this under travel and open the wrong balance sheet.
One more thing about the name. I would not read the word Lotte here as membership of the Lotte Group conglomerate that runs the department stores and the confectionery business. Korean coverage of this company’s ownership discusses a founder family shareholding; a group parent is a different claim and I did not verify the corporate relationship directly in either direction. A US reader pricing in group credit support on the strength of the name should check that first.
Revenue of 733.3 billion won in the twelve months to June
The financial screen I use carries revenue of 653.4 billion won for this company, and that figure is the audited 2025 full year, unchanged since March. To get a trailing twelve months that lines up with the June 30 balance sheet, I summed the four discrete quarters from Q3 2025 through Q2 2026: 186.67, 187.15, 156.18 and 203.27 billion won, which comes to 733.27 billion won, by my calculation. That is 12.22 percent above the number on the screen, and every ratio below uses the summed figure.
In dollars, using the rate in the footnote, revenue is roughly 536 million and total assets roughly 1,594 million. I am giving both in won first because won is what this company reports in, and the dollar figures exist only so a US reader can size the business against something familiar.
Why I Ranked Lotte Tour Development Stock By Asset Turnover
The question I had was about construction cost, so multiples were the wrong tool
My usual peer table sorts by forward earnings multiples. I built one here and threw it away. Three of the seven comparison names carry negative shareholders’ equity, which makes return on equity meaningless for them, and two show no forward multiple at all at my data source. More to the point, a multiple answers what the market charges for a company today. My question was different. This business put up one very large building with borrowed money, and I wanted to know how much revenue that quantity of assets produces compared with operators who did the same thing elsewhere.
So I ranked by revenue divided by total assets. It is a crude figure and I will list its faults in a moment. What it does have is a single meaning: how many times a year the asset base turns into sales.
How I picked the seven names
I took operators whose principal business is running integrated resorts with gaming floors, across four listing venues, and I pulled every value from one source so the arithmetic stays comparable. Revenue is trailing twelve months, total assets are the most recent balance sheet date. I made no currency conversions inside the ratio, because both figures in each row share a currency.
Six of the seven align on June 30, 2026 for both figures. Bloomberry Resorts is one quarter behind, at March 31, 2026. I left it in and I am telling you it is stale, because dropping a company for a stale date would mean I am choosing which companies get to set the center of the table.
The table, sorted low to high
| Company | Listing | Revenue (TTM) | Total assets | Rev / assets |
|---|---|---|---|---|
| Bloomberry Resorts | PSE: BLOOM | PHP 51,057m | PHP 194,032m | 0.2631 |
| Genting Singapore | SGX: G13 | SGD 2,442m | SGD 8,981m | 0.2719 |
| Lotte Tour Development | KOSPI: 032350 | KRW 733,272m | KRW 2,182,105m | 0.3360 |
| MGM Resorts International | NYSE: MGM | USD 17,761m | USD 39,848m | 0.4457 |
| Century Casinos | NASDAQ: CNTY | USD 580.95m | USD 1,105m | 0.5257 |
| Wynn Resorts | NASDAQ: WYNN | USD 7,413m | USD 13,159m | 0.5633 |
| Las Vegas Sands | NYSE: LVS | USD 13,719m | USD 19,909m | 0.6891 |
| Melco Resorts | NASDAQ: MLCO | USD 5,222m | USD 7,372m | 0.7084 |
Peer figures are from stockanalysis.com, one source for all seven, revenue trailing twelve months and total assets at the latest balance sheet date. Bloomberry is at March 31, 2026; the other six are at June 30, 2026. The Genting Singapore revenue figure is a sum of two half-year columns, since the company reports semiannually. Korean figures are from the half-year report filed August 13, 2026.
Where the company lands, and three reasons the ranking is soft
Lotte Tour Development stock sits third from the bottom of eight, at 0.3360 against a peer median of 0.5257. That is 36.08 percent below the median, by my calculation. Inverted, the company holds 2.98 years of its own revenue in assets while the median peer holds 1.90 years.
Three reasons to hold that loosely. First, MGM sold and leased back a large share of its real estate, and the operating lease assets that came back onto its balance sheet push its ratio down for a reason that has nothing to do with how hard the property works. Third, three of these companies operate multiple properties in multiple jurisdictions, so their asset base is diversified in a way this one is not. The two names below the Korean company, Bloomberry and Genting Singapore, are the two that most resemble it in that last respect: a small number of flagship properties in one licensing regime. I do not think that grouping is a coincidence, and I also cannot prove it is not.
The Cash That Left On August 31 And The Dilution That Left With It
A Saturday redemption date and a Monday payment
On August 3, 2026 the regional outlet Jnuri reported that the company would redeem 35.0 billion won of its 8-1 series convertible bond early, that the payment including accrued yield came to 43.5365 billion won, and that because the stated redemption date of August 29 fell on a non-business day the money would actually move on August 31 instead (Jnuri, August 3, 2026). August 29, 2026 was a Saturday and August 31 was a Monday, so the shift holds up.
The background is in Financial News from the day before. The bondholder, Dominus Investment, exercised its put; the conversion price was 12,762 won and the shares were trading near 11,000 won, so converting made no sense (Financial News, August 2, 2026). The bond was issued November 29, 2021 at a zero percent coupon with a 4.5 percent yield to maturity, total issue 70.0 billion won. Subtracting principal from the payment leaves 8.5365 billion won of accrued yield, by my calculation, which is 24.39 percent of principal over four years and nine months. I have not seen the indenture, so I am not reverse engineering the compounding.
What the market value on my screen does not include
The August 31, 2026 close was 13,280 won on 79,728,916 shares outstanding, which multiplies to 1,058,800,004,480 won, or 1,058.8 billion. That matches the market value my screen carries to the last digit. It is a price multiplied by a share count and nothing else.
Two things happened to this company on that same day and neither is in that figure. Cash of 43.5365 billion won left, which is 4.11 percent of market value. And 2,742,516 shares of potential conversion stopped being potential, since the company said it plans to cancel the repurchased bonds; that count is 35.0 billion divided by the 12,762 won conversion price, and it equals 3.44 percent of shares outstanding. Both percentages are mine, computed on the same market value. They are close in size and opposite in direction, and I want to be careful here: they do not net against each other, because one reduces the assets supporting each share and the other reduces the number of shares that could exist. I put them side by side because they happened on one day, and because my screen shows neither.
What I Could Not Verify About Lotte Tour Development Stock
Where 385.25 billion won of equity came from
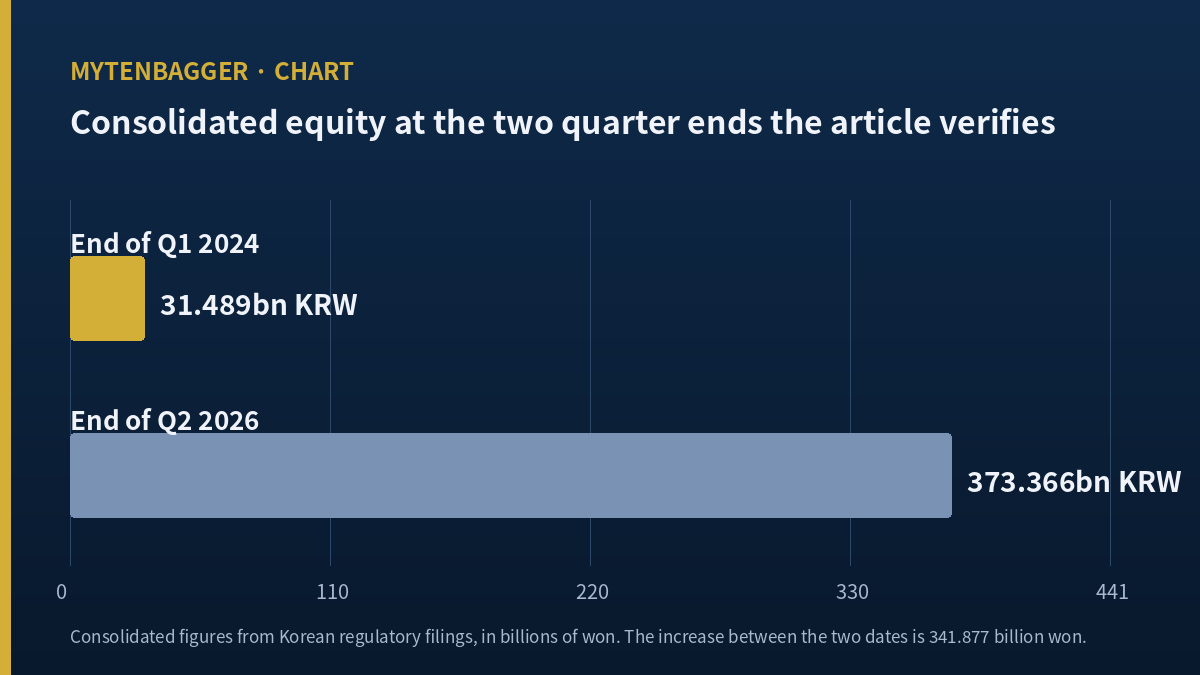
Consolidated equity at the end of Q1 2024 was 31.489 billion won against liabilities of 1,714.3 billion, a debt to equity ratio of 5,444 percent. At the end of Q2 2026 equity was 373.366 billion. The increase is 341.877 billion won.
Over the same window the income statement produced a loss. The 2024 full year net loss was 116.573 billion and the Q1 2024 portion of it was 38.432 billion, so the remaining three quarters lost 78.141 billion; 2025 earned 27.596 billion; the first half of 2026 earned 7.169 billion. The sum is negative 43.376 billion won. Which means 385.253 billion won of equity arrived from somewhere other than earnings, by my calculation.
I could not establish what that somewhere was. There is a clue in the quarterly balance sheet: total assets jumped 440.094 billion won between Q1 and Q2 of 2024 while liabilities rose only 77.114 billion. An asset increase that large with almost no matching liability is consistent with either a large equity issue or a revaluation of the property, and the face of the statements does not distinguish them. The notes would, and Korea’s disclosure portals were unreachable from this session. Separately, Bloter reported in February that accumulated losses on this balance sheet exceed 1,100 billion won (Bloter, February 13, 2026), which means paid-in and other equity accounts must exceed 1,400 billion. Whatever this company’s equity is, it is not retained profit.
The screen’s 250-day high and low are described as close-based and are not
My data screen reports a 250-day high of 27,700 won and a low of 10,150, with a source field that says the values come from adjusted closing prices. I pulled the 250 sessions myself. The highest close in that window is 26,550 won on February 9, 2026 and the lowest is 10,990 on July 20, 2026. The screen’s 27,700 matches the intraday high of February 6, 2026 and its 10,150 matches the intraday low of July 21. The field description and the arithmetic disagree.
So the position figures in this piece are recomputed on closing prices. Against the closing high, the August 31 price sits at 50.02 percent, a drawdown of 49.98 percent. Against the closing low it is 20.84 percent higher. The screen’s own figure for that last one is 30.8 percent, a gap of 9.96 percentage points. Moving averages on the same series did reconcile to the won. One field is wrong here; the feed is fine.
Numbers I checked and left out
IBK Securities analyst Kim Yu-hyuk carries 2026 estimates of 742.1 billion won of revenue and 186.7 billion of operating profit, but the secondary article I read did not date the report, so those figures are not in my table below. The three-year revenue growth rate of 52.66 percent starts from 2022, which was this company’s worst revenue year, and moving the start date by one year changes it beyond recognition. Dividend fields on my screen are all empty with a reason code of undisclosed, while a raw payout figure of 57.4 sits there unreconciled to anything. And one check that did close: paid-in capital of 39.9 billion won divided by 79,728,916 shares gives 500.45 won, which matches a 500 won par value, and 500 multiplied back gives 39.864 billion. The share count is internally consistent.
Where I Stand And What Would End The Wait
Broker dates, with July 15 dropped into the sequence
Coverage here is deep, and I am deliberately leaving every valuation figure out of this piece. Quoting them invites an average, and I could not obtain an aggregated Korean consensus, so any average I produced would be one I invented. What I will show is when each house did its work, with one event placed in the same sequence.
| Date | Who | What they put on the page |
|---|---|---|
| March 12, 2026 (Thu) | KB Securities, Choi Yong-hyun | 2026 operating profit of 222.0 billion won, 27.1 percent margin |
| May 15, 2026 (Fri) | Hana Securities, Lee Ki-hoon | 2026 revenue of 747.9 billion won and operating profit of 192.6 billion, on rolling competitiveness and second-half refinancing |
| May 28, 2026 (Thu) | Daol Investment, Kim Hye-young | Membership growth feeding table volume; no figures in the secondary article |
| July 14, 2026 (Tue) | NH Investment | A note ahead of peak season; no figures in the secondary article |
| July 15, 2026 (Wed) | Ministry of Culture, Sports and Tourism | Plan surfaces to lift the tourism fund levy cap on foreigner-only casinos from 10 to 15 percent of revenue |
Insight Korea reported that the shares fell from 14,010 won to 10,930 on the day that plan became public and stayed near 11,000 afterward (Insight Korea, August 3, 2026). My own closing series puts the 250-session low of 10,990 won on July 20, five sessions later, so the timing lines up. Every broker figure above predates the event. That is why I will not average them.
The operating record behind Lotte Tour Development stock has kept improving through all of it. The company reported second-quarter Dream Tower revenue of 192.6 billion won, a quarterly record, with casino net revenue of 147.088 billion, up 33.7 percent year over year, and hotel revenue of 45.478 billion, up 10.7 percent (Newspim, July 1, 2026). Those two segment figures add to 192.566 billion, which closes on the 192.6 billion headline. July casino revenue was 51.594 billion won, up 18.8 percent (Edaily, August 5, 2026).
Four arguments against this piece
- Asset turnover punishes a company for owning its property. An operator that sold its real estate and leases it back can show a better figure while running the same floor. That is a real weakness of the measure and it applies directly to MGM in my table.
- Low turnover is what a newly built asset looks like before it is fully utilized. The Jeju property opened recently by the standards of this industry, and revenue has grown every year since 2022. A ratio computed today may be measuring immaturity and calling it inefficiency.
- The levy proposal that dominates sentiment here is not settled. Twelve Korean tourism bodies are pushing for withdrawal, according to Insight Korea. A ratio-based case ignores the fact that the largest single variable for this business right now is a policy question, and I have written about how a Korean gaming levy can dominate a company’s reported numbers before.
- Table drop for July fell 9.9 percent year over year to 216.763 billion won even as casino revenue rose 18.8 percent (Edaily, August 5, 2026). The volume of money customers put at risk went down. My piece does not build on that fact, and someone arguing the bear case would start there.
What would end the wait, and how I would learn of it
I am watching Lotte Tour Development stock and not buying it. The market value of 1,058.8 billion won puts this outside the top hundred Korean listings, which is where my default is observation anyway, but there is a specific reason this time. The three numbers I would decide on carry three different dates. The income figures on my screen are the 2025 full year. The broker work predates July 15. The market value predates August 31. Each is correct on its own date, and stacked together they describe no particular moment.
Here is what would move me. If the third-quarter report shows consolidated equity rising again by more than the nine-month cumulative profit, then this company is still filling its equity from outside the income statement, and I will not treat the current profitability as evidence that the balance sheet has healed. If instead nine-month profit accounts for the whole equity increase, the premise of this piece expires on that filing.
And a note on how I would find out, because that matters as much as the test. I do not follow this company daily. The equity question is only answerable from the quarterly filing, so I cannot know before November 15, 2026, and by then the price will likely have absorbed the answer. The fast disclosure this company does provide is a monthly casino revenue figure, which tells me nothing about equity. I have chosen a question that the slow window answers and the fast window does not, and I am waiting on purpose, with that cost understood. If you want a company where the fast window and the slow window ask the same thing, an airline whose order book dwarfs its market value is a cleaner example of the problem.
Prices and ratios reflect the August 31, 2026 close of 13,280 won as checked at the time of writing; this piece may be read later, so live quotes will differ. Korean won is the reference currency here, and dollar figures are approximate conversions at about 1,369 won per dollar on that same date. Financial figures come from Korean regulatory filings, with receipt numbers given where used; peer figures come from a single external data source cited under the table. Ratios and percentages are my own arithmetic unless a source is named alongside them.