Samwha Capacitor Earnings: Three Steady Years, Then a Weaker Half
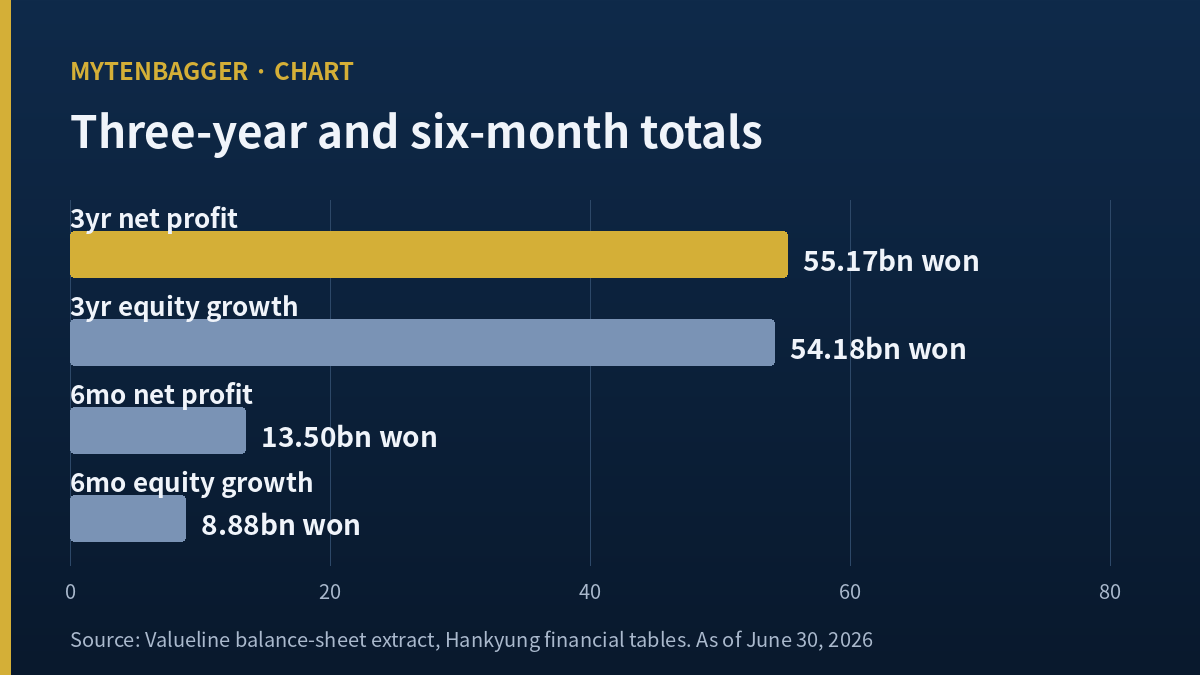
- The three annual statements add 55.17 billion won of net profit for 2023, 2024 and 2025.
- The equity line across those same statements adds 54.18 billion won of growth, from 225.43 billion to 279.61 billion.
- The difference is 987 million won, which is 1.79 percent of the profit. Three years of earnings went into the book and almost nothing came back out of it.
987 million won. That is the whole of what I could not match at this company across three full financial years, and it is about 0.73 million dollars at the September 22, 2026 close. I went looking for a bigger number and did not find one.
Samwha Capacitor stock belongs to a Korean maker of capacitors listed on the KOSPI, Korea’s main exchange, which plays the role at home that the broad US index plays there. The company has been making these parts since the 1950s. These parts sit in almost every circuit that exists, which means the company’s fortunes move with whatever is being built that year and not with any one customer.
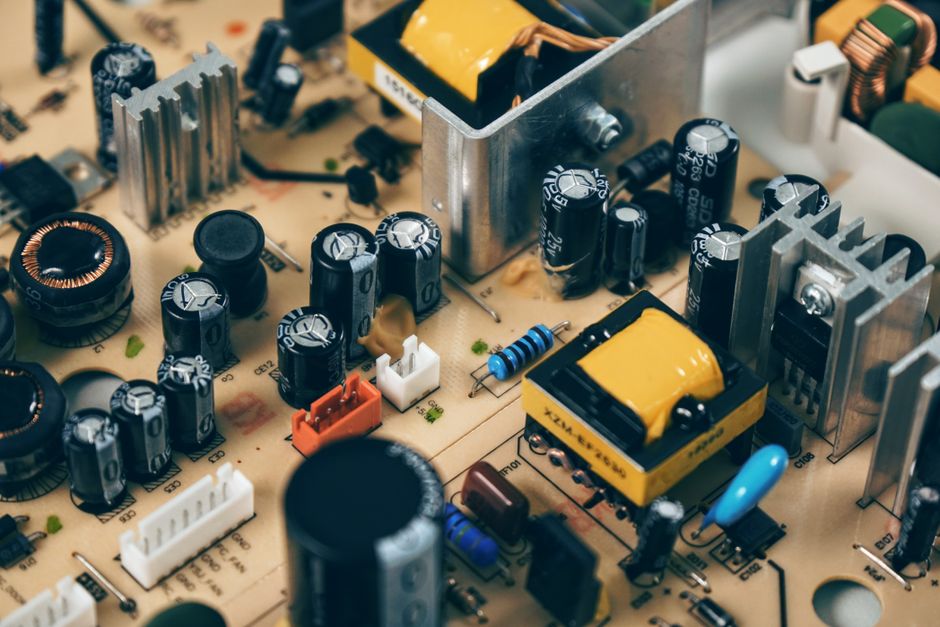
What the company actually makes is worth a paragraph, because it decides how to read everything above. Capacitors are passive parts, meaning they do not amplify or switch anything; they store a small charge and give it back when the circuit asks. The version this company sells most of is built by stacking thin ceramic layers, and it goes into vehicles, into industrial power equipment and into household appliances in roughly that order of size. No single customer decides the year. What decides the year is how much of each of those three things the world happens to be building, which is why the income statement here swings while the balance sheet does not.
Contents
Three years that stayed inside Samwha Capacitor stock
I do this addition on most companies I look at, and it usually fails. Equity moves for reasons that have nothing to do with the income statement: currency translation on overseas units, revaluation of financial assets, minority interests changing hands, dividends going out. Three years of those effects normally leave a gap of five or ten percent between profit earned and equity gained.
The three yearly numbers, added
Net profit came to 20.81 billion won in 2023, 21.82 billion in 2024 and 12.53 billion in 2025. That is 55.17 billion won together once the unrounded source figures are added, or about 40.62 million dollars. Equity over the same stretch went from 225.43 billion won at the end of 2022 to 279.61 billion at the end of 2025. That is 54.18 billion won of growth, about 39.89 million dollars.
The two totals sit 987 million won apart. Put as a percentage, the equity line absorbed 98.21 percent of what the income statement produced over those three years. I have seen companies where this works out by coincidence, and I have seen companies where it works out because the payout is small and the other movements are smaller still. I could not tell which of the two this was, and that is the honest state of it.
A test passing is not the same as a test being informative, and I want to be careful about which one happened. All the addition tells me is that over those three years the sum of everything that moves equity other than profit came to less than two percent of profit. It does not tell me those movements were individually small. Two large items of opposite sign would produce the same total. What makes me lean toward small, and away from two large items canceling, is that the liabilities line barely moved across the same stretch, and companies with big translation or revaluation swings usually show some of that turbulence on the funding side too. That is an inference and not a finding, and I am marking it as such so that a later reader of my own notes does not mistake it for something I opened a document to confirm.
Six months that did not
Then I extended the same addition by one period and it broke.
The company earned 5.20 billion won of net profit in the first three months of 2026 and 8.30 billion in the three months after that, so 13.50 billion won for the first six months, about 9.94 million dollars. Equity over the same six months went from 279.61 billion won to 288.49 billion. That is 8.88 billion won of growth, about 6.54 million dollars.
The gap this time is 4.62 billion won, about 3.40 million dollars. The book kept 65.78 percent of what was earned and 34.22 percent of it went somewhere I cannot see from the two statements alone.
The timing is the part that makes a payout plausible without proving it. Korean companies with December year-ends typically fix the entitlement at the close of the year and settle the cash in the following spring, which places the outflow squarely inside a January-to-June window and nowhere near a January-to-December one. That is exactly why the three-year test could pass while the six-month test failed: across full financial years the payout and the profit it came out of land in the same window and partially cancel each other in the equity line, whereas a six-month slice catches the outflow without the matching full-year earnings behind it. So the break I found may be an artifact of where I cut the period, and I would rather say that plainly than let the 34.22 percent stand as though it were a conclusion about the business.
What 4.62 billion won could be
So I sized the candidate. The smaller of the two per-share dividend figures I can find, applied across the shares outstanding, works out to roughly 5.2 billion won by my own calculation. That is larger than the gap and not smaller, which would mean something else added about 0.58 billion won back in the same six months.
Other comprehensive income is the usual place for that kind of addition. So is a change in the portion of equity that belongs to outside holders of subsidiaries. I could open neither. The notes to the half-year statements were not available to me through any route I tried, and I am not going to name a cause I did not read. What I will say is narrower and I can stand behind it: for three years this company kept essentially everything it earned, and in the most recent six months it kept about two thirds.
Doing my own addition is what I fall back on whenever the published figures around a company will not agree with each other, which is the state of things here. I took the same route with a chip equipment maker whose two published forecasts for a single year sat more than twice apart, and the routine has earned its keep: an addition I performed myself is the only figure in a piece like this whose provenance I never have to wonder about.
It is worth saying what I deliberately left alone here. The same six months contain two three-month periods that moved in opposite directions against their year-ago comparisons, and the temptation to make that the story was strong. I used exactly that structure on the company I wrote up immediately before this one. The material was sitting right there and I left it where it was. Reusing a construction two pieces running is how a body of work starts to read as machine-made, so those two periods enter here only as the inputs to one addition.
A balance sheet that barely moves behind Samwha Capacitor stock
The reason the addition is even readable at this company is that almost nothing else on its balance sheet does anything dramatic.
| Line (billion won) | Dec 2022 | Dec 2024 | Dec 2025 | Jun 2026 |
|---|---|---|---|---|
| Total assets | 287.45 | 328.11 | 340.25 | 354.91 |
| Current assets | 162.15 | 206.06 | 214.31 | 232.11 |
| Cash and equivalents | 57.27 | 31.50 | 42.19 | 43.70 |
| Total liabilities | 62.02 | 60.83 | 60.64 | 66.42 |
| Total equity | 225.43 | 267.28 | 279.61 | 288.49 |
Source: Valueline balance-sheet extract, figures as of each date shown. Won amounts are the source values rounded to two decimals; dollar equivalents elsewhere in this piece are approximate.
Total liabilities were 62.02 billion won at the end of 2022 and 66.42 billion won three and a half years later, which is about 48.90 million dollars. Over the same stretch total assets rose 67.46 billion won, or 23.47 percent, and equity rose 63.06 billion won, or 27.97 percent. Equity grew faster than the assets it sits under, which is what happens when a company funds itself out of what it earns and borrows almost nothing new.
Inside current assets at June 2026 the three lines I can name are cash at 43.70 billion won, inventory at 44.64 billion and trade receivables at 80.14 billion. Together they make up 168.48 billion of the 232.11 billion total, which is 72.59 percent. The remaining 63.63 billion won, about 46.85 million dollars, sits in lines the extract I used does not break out, and short-term financial instruments are the usual home for that kind of balance at a company with no funding pressure. I did not confirm it, so it stays as a hole in my own picture and not as a claim. A hole I can point to is worth more to me later than a guess I cannot take back.
The return figures deserve one more sentence than I gave them, because the fall is partly forced by the same thing that makes this company readable. When a business retains nearly everything it earns, the equity it is judged against grows every single year whether or not earnings do. Profit here fell from 21.82 billion won in 2024 to 12.53 billion in 2025 while the book it sits on kept climbing, so the ratio had to fall faster than the profit did. That is not a criticism of the company. It is a warning about the metric: at a firm that pays out little, a falling return on equity tells you less than it looks like it does, and you have to go back to the earnings themselves to learn anything.
The two ratios I did check
Liabilities against equity at June 2026 give 23.02 percent. Current assets against current liabilities give 402.69 percent. Both are calculated by me from the table above and never lifted from a screen, and both are the kind of number that makes a company boring in the useful sense. There is no refinancing question here and no covenant question here, which is precisely why the equity movement is legible at all.
The one thing that is not boring is what this book earns. Return on equity ran 15.15 percent in 2021, then 13.70, then 8.89, then 8.60, and 4.61 percent in 2025. The figure it gets divided by kept compounding and the figure on top did not. I have written about a Korean chip designer whose largest revenue line was the one its own peers were walking away from, and the outline of the problem there was similar in one respect: a business can keep its balance sheet in perfect order while the thing the balance sheet is supposed to earn on quietly gets smaller.
What I will not take from the screens
Three figures were available to me that I could have used and did not. They come out for the same reason in each case: two or more providers show different values for the same field on the same day, and I found nothing that settles which one is right.
Two dividend figures, five times apart
Two data providers show per-share dividends for this company that differ by more than a factor of five. I am not going to print either one as fact. What I did instead was run the equity movement described above and treat the smaller of the two as a hypothesis, which is the only reason I can say the six-month gap is roughly the size of a payout at all.
No capital stock, no par value, a fourth time
For the fourth session running I could not obtain a capital-stock figure or a par value for the company I was writing about, from any route available to me. That check normally lets me confirm the share figure independently. Without it, the share figure rests on a single provider, and every per-share number in this piece inherits that weakness. I am recording it here so that it is visible when I come back to this file.
There is a chain here worth naming, because it runs through everything above. The share figure comes from one provider. The per-share dividend I used as a hypothesis is applied across that share figure. The size of the gap I am trying to explain is then compared against the result. If the share figure is wrong, the hypothesis moves with it and the comparison stops meaning anything. Most of the time an independent check on capital stock breaks that chain in one step, and this week it was not there to break it. Everything downstream of it in this piece should be read at that strength and no higher.
Earnings multiples are in the same state. Three providers show three different ones for the same day, and the widest pair sits more than three times apart. None of them enters my read. On the sell-side, two named houses published estimates for this year, only one of them published anything for next year, and the only per-share valuation anybody has put on paper is seven months old. The thickness of the outside view changes depending on which year you ask about, which is a different thing from having no outside view at all. When the outside numbers pull apart by more than the thing they are estimating, they stop being an input.
The company I set beside Samwha Capacitor stock, and the numbers I did not put beside it
For a peer I went with Vishay Intertechnology, Inc. (NYSE: VSH). The reason is not product rank and not size. It is that Vishay makes the same category of passive components and files in the United States, so an English-language reader can open its statements in the same accounting language they already read. That is the whole of my reason.
I have put no figures beside it. The two companies report under different accounting standards, and putting their lines in one table would create a comparison that neither set of statements supports. I would rather name the peer and leave the table unbuilt than publish two columns that quietly mean different things. An empty space I chose is easier to carry into the next filing than a comparison I cannot defend a quarter later.
Twelve ways Samwha Capacitor stock could prove me wrong
- The 987 million won match over three years may be coincidence. Three data points are not a pattern.
- Equity figures come from one provider’s extract; the filings themselves I could not open.
- The 4.62 billion won gap in the first six months is a net figure. Several movements of different signs could sit inside it.
- I treated a payout as the likely cause without reading a single note that says so.
- The per-share dividend figure I used as a hypothesis is the smaller of two that differ by more than five times.
- Net profit for the two recent three-month periods comes from press reports of the company’s results; I did not read it in the statements.
- Revenue for the second of those periods is reported as two slightly different figures in two outlets published a day apart.
- I could not obtain capital stock or par value, so the share figure is unconfirmed.
- Equity here is the total figure. I did not separate the portion that belongs to outside holders of subsidiaries, and that portion changing would move my whole calculation.
- Return on equity fell for four straight years, which cuts against any reading of this balance sheet as a compounding machine.
- Only one house has published a forward estimate for next year, and the single per-share valuation on record predates the last four months of trading entirely.
- This company’s product mix spans automotive, industrial and consumer end markets, and I have not verified how the recent movement splits across the three.
Four conditions that end my read of Samwha Capacitor stock
- If the third-quarter statements show equity below 288.49 billion won while the company reports a profit for those three months, then money is leaving faster than I assumed and the six-month gap was not a one-time settlement.
- If total liabilities pass 80 billion won, the funding story changes from self-funded to something else, and the equity addition I built this piece on stops being the interesting question.
- If return on equity for the full year lands below 4.61 percent, then four straight years of decline becomes five, and the book is compounding against a business that is shrinking underneath it.
- If the notes to any subsequent filing show that the six-month gap was not a payout at all, my one hypothesis in this piece is wrong and I go back to the beginning of it.
Where I am on Samwha Capacitor stock, and the five values that would move me
A dividend line on a screen is where this one started going wrong for me, and I want to record that plainly. For years I have taken those fields as statements about a company, the way I take a revenue figure as a statement about a company. This week two providers showed me figures five times apart for the same company in the same session, and neither of them carried an estimate label. The only thing that let me choose between them was the movement in the equity line, which is a completely different part of the filing and was never meant to answer that question.
So the correction I am writing down for myself is this: work the payout out of the change in equity first, then look at the dividend field, and treat the field as confirmation or as a warning, never as the starting point.
I own none of this and I have no order in. What keeps me out is not a judgment about price. It is that the single most interesting number I found here is a gap I cannot break into its parts, and I do not take positions on the strength of a figure whose composition I have not seen.
I will close on something other than a stance. Here are the five values this piece never used: the capital stock, the par value, the per-share dividend, the earnings multiple, and the one per-share valuation on record. If the first three resolve into single figures I move this from watching to tracking. If the last two resolve and point the same way, I will need a stance where a note now sits. If none of them resolve by the time the next set of statements lands, the file stays exactly where it is.
And the one thing I am actually waiting for is not a price and not an estimate. It is a percentage: how much of the next reported profit stays in the equity line. Ninety-eight percent, and the three-year pattern holds and the six months were a settlement. Sixty-five percent again, and something structural is leaving this company every period and I have been reading the wrong part of the filing all along.
Balance-sheet figures are as of the dates shown in the table. Any price-linked figure uses the September 22, 2026 close. Won-to-dollar equivalents apply about 1,358.2 won to the dollar on that same close and are rounded; percentages are rounded to two decimals.
Sources consulted: Valueline balance-sheet extract, Hankyung financial tables, Jobpost, September 21, 2026, Supple on the Meritz Securities note, August 21, 2026, StockAnalysis company profile.
Related reading
- Korea’s DI Corporation Valuation Against Its Book Value
- Hyundai Elevator Dividend After a 20-Year Shareholder Dispute