Sungkwang Bend Capex Near Zero as Its Order Backlog Grew 33%
Contents
Where Sungkwang Bend Stock’s Capital Spending Went
I follow Sungkwang Bend stock the way I follow most small Korean industrials, which is to say I check the filings twice a year and otherwise leave it alone. This company (KOSDAQ: 014620) makes butt-weld pipe fittings, the elbows and tees that join pipe runs inside refineries, petrochemical complexes and liquefied natural gas terminals. On August 21, 2026 it closed at KRW 22,950, giving it a market value of about KRW 609.5bn, or roughly USD 440m.
When the half-year filing landed I went looking for the usual things and then stopped at a line I normally skip. Purchases of property, plant and equipment for the six months to June 30, 2026 came to KRW 70m. Seventy million won. Total assets at that date were KRW 600,254m, so the half-year outlay came to about one ten-thousandth of the asset base. That is what this note is about.
| Capex, FY2025 | Capex, first half 2026 | Ratio |
|---|---|---|
| KRW 4,471m | KRW 70m | 1.57% |
Source: the company’s regulatory filings in Korea (annual report filing number 20260708000008, half-year report 20260814002129). The ratio is my own division. All won figures here are as filed.
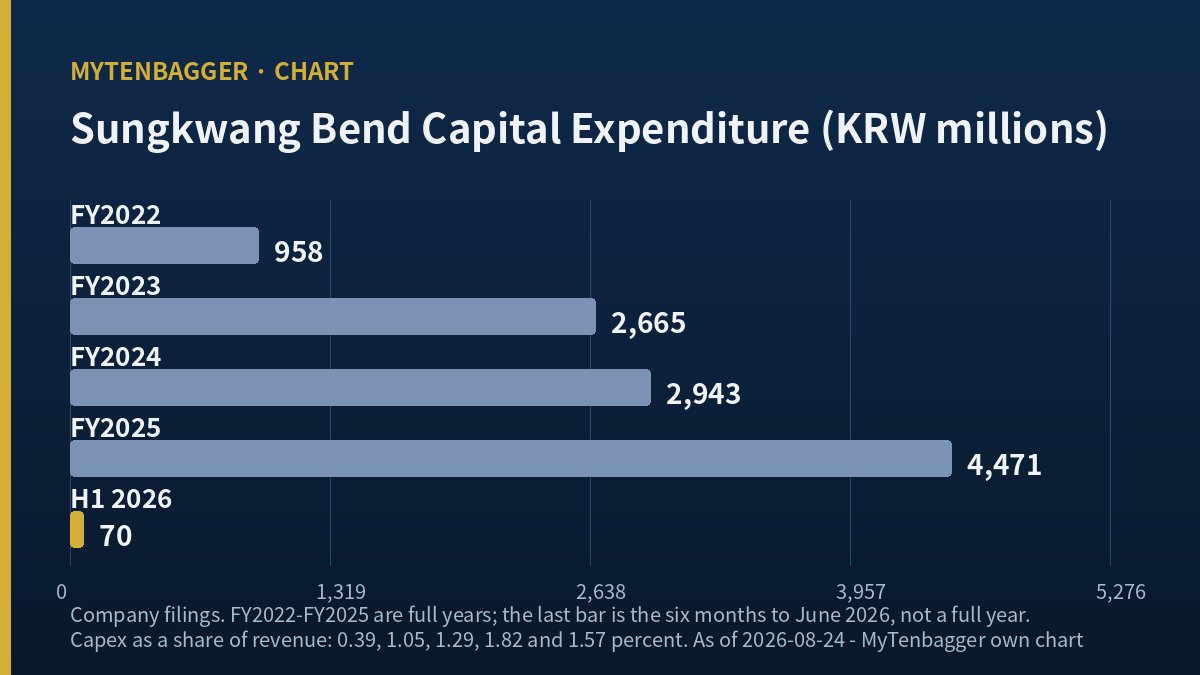
Four Years of Capital Spending in One Column
One half-year number proves nothing on its own, so I pulled the same line back four years. Every figure below comes from the audited Korean filings, consolidated basis, in millions of won.
| Period | Capex | Operating cash flow | Free cash flow | Capex as % of revenue |
|---|---|---|---|---|
| FY2022 | 958 | 21,424 | 20,466 | 0.39% |
| FY2023 | 2,665 | 35,546 | 32,881 | 1.05% |
| FY2024 | 2,943 | 28,505 | 25,562 | 1.29% |
| FY2025 | 4,471 | 37,880 | 33,409 | 1.82% |
| 1H 2026 | 70 | 7,489 | 7,419 | 0.06% |
All figures in KRW millions, consolidated, from the company’s Korean regulatory filings. The percentage column is my own calculation against each period’s revenue. The first quarter of 2026 shows capex of zero, so the entire KRW 70m fell in the June quarter.
What four years of this line say
Capital spending was climbing. It went from KRW 958m in 2022 to KRW 4,471m in 2025, and as a share of revenue from 0.39% to 1.82%. That is a company gradually putting money back into its plant. Then in the first six months of 2026 it went to almost nothing. The comparable half of 2025 was KRW 762m, so the year-on-year fall is 90.81% by my calculation.
Operating cash flow tells me this was a choice and no shortage of money. The company generated KRW 7,489m of operating cash in the half and kept KRW 7,419m of it as free cash flow. It carries almost no debt: liabilities were 6.80% of equity at June 30, 2026, and the interest expense for the entire half was KRW 21m. Nobody was stopping this company from buying equipment.
All of the 2025 spending fell inside one quarter
Breaking the annual figure into quarters changed how I read it. Of the KRW 4,471m spent during 2025, KRW 3,639m landed in the September quarter alone. That is 81.39% of the year in three months, by my own division.
| Quarter | 1Q25 | 2Q25 | 3Q25 | 4Q25 | 1Q26 | 2Q26 |
|---|---|---|---|---|---|---|
| Capex, KRW m | 449 | 313 | 3,639 | 70 | 0 | 70 |
Derived by me from the cumulative capex disclosed in each Korean quarterly and half-year filing, subtracting the prior cumulative figure. The fourth-quarter 2025 value is the annual total less the nine-month cumulative.
So this is not a company that spent steadily and then stopped. It is a company that made one purchase in the third quarter of 2025 and has spent almost nothing in the four quarters since. A single lumpy block behaves exactly the way plant equipment behaves, and that pushes me toward the first of the two interpretations above before I have even heard from management.
Sungkwang Bend Stock Has an Order Book That Grew 33%
Here is why the empty capex line caught me. The same six months produced the best order intake this company has had in two years. From the management presentation issued on August 19, 2026 (parent-company basis, in KRW 100m units): new orders of 1,298 against 977 in the first half of 2025, and a closing backlog of 1,155 against 855 at the end of 2025. That is intake up 32.86% and backlog up 35.09%, both by my own division.
So the picture is a company taking in a third more work while putting a fiftieth as much money into the plant that has to do the work. Those two facts can sit together comfortably or uncomfortably, and which one it is decides quite a lot.
Two Ways to Take a Capex Line at Zero
Reading one: the capacity is already there
Fittings plants are lumpy. You buy forming presses and heat-treatment furnaces in blocks, and once installed they sit for years. If the KRW 4,471m spent during 2025 completed a block, then 2026 is the digestion year and an empty line is exactly what a finished project looks like. Under this reading the backlog converts into revenue on existing equipment and the operating leverage is very good, because the fixed cost was paid last year.
Reading two: management is not convinced
The opposite reading is that people who see the order pipeline every day declined to commit capital against it. Order intake at this company has swung hard before: KRW 2,192 hundred million in 2024 fell to KRW 1,849 hundred million in 2025, a drop of 15.65%. A backlog that recovers for two quarters is not the same thing as a cycle, and a management team that lived through 2025 would know that better than I do.
I cannot separate these two with the disclosure I have. The filings give the cash outflow but no breakdown of what the 2025 spending bought, and the company does not publish a capacity utilization figure. This is the single largest hole in this note and I would rather name it than paper over it.
Where the inventory sits in this
There is a third thing on the balance sheet worth putting beside the capex line. Inventory stood at KRW 148,532m at June 30, 2026, which is 210.8 days of sales on the June quarter’s revenue. A fittings maker holding seven months of stock has, in effect, already pre-built a chunk of its backlog. That would support reading one: the company may be filling orders out of material it bought earlier and not out of machines it has yet to buy.
Sungkwang Bend Stock Against Seven Global Peers
The comparison I wanted was capital intensity, and I could not build it. Very few of these companies disclose capex in a form I could line up against a Korean half-year filing without guessing, so I did the next best thing and sorted the table by something that has to come first anyway: the date each company closes its books. Comparing a Korean six-month figure with annuals that end on three different dates is the whole difficulty here, so the fiscal-year column leads.
| Company | Fiscal year end | FY2025 revenue | Operating margin |
|---|---|---|---|
| Core & Main (NYSE: CNM) | February 1, 2026 | USD 7,647m | 9.4% |
| Mueller Industries (NYSE: MLI) | December 27, 2025 | USD 4,178m | 22.9% |
| Tenaris (NYSE: TS) | December 31, 2025 | USD 11,981m | 19.1% |
| Aalberts (Euronext: AALB) | December 31, 2025 | EUR 3,091m | 13.2% (EBITA) |
| Flowserve (NYSE: FLS) | December 31, 2025 | USD 4,729m | 8.5% (GAAP) |
| Georg Fischer (SIX: GF) | December 31, 2025 | CHF 4,110m | 7.9% |
| KITZ (TSE: 6498) | December 31, 2025 | JPY 176,682m | 8.75% |
Sources: Mueller’s fiscal 2025 release, Tenaris annual results, Flowserve full-year results, Core & Main fiscal 2025 results, Georg Fischer annual results and Aalberts full-year results; KITZ from its published financial statements. Four cautions I want on the record. Core & Main closes in February, so its “FY2025” runs into calendar 2026. Mueller uses a 52-week year ending December 27, so it is close to a calendar year without being one. Aalberts reports EBITA before exceptional items, which is a wider figure than the operating profit of the others. Flowserve’s adjusted operating margin is 14.8% against the 8.5% GAAP figure shown, and I chose the GAAP one. I did not convert any of these into won.
What the sorting does is make the problem visible. Six of the seven close in December and one closes in February, and none of them is reporting a six-month Korean fiscal period. Every operating margin in that column is an average of four quarters, and it hides whatever amplitude sits underneath. I know the amplitude for the Korean company because I have its quarterly filings, and I do not know it for any of these seven. That asymmetry is worth remembering before anyone draws a conclusion from where the Korean name would sit in that column.
What the Korean Market Charges for This Machinery Sector
Over the 244 trading sessions from August 21, 2025 to August 21, 2026, the shares fell 22.34%. The KOSDAQ index rose 3.18%. The Korean machinery sector, measured equally weighted across 96 constituents with this company excluded, rose 22.25%. The shortfall is 25.51 percentage points against the index and 44.59 percentage points against the sector.
Splitting that: the sector contributed positively at 19.08 percentage points, and the stock-specific piece took away 44.59 points. The identity closes, since 19.08 minus 44.59 gives the 25.51 shortfall, and I checked it myself. Within the sector this name ranks 70th of 96, against a median return of minus 4.47%. Its sensitivity to the index measures 0.677 and its correlation 0.472, which is a low reading for a cyclical industrial.
A sector that rose 22% while one of its members fell 22% is telling me the cause is inside this company, and the first half of 2026 supplies two candidates: an operating profit that fell 22.96% year on year and a capital spending line that emptied out.
Numbers I Left Out of This Sungkwang Bend Stock Note
Three sell-side valuations
| House | Note dated | Valuation (KRW) |
|---|---|---|
| iM Securities | April 6, 2026 | none given |
| Korea Investment & Securities | May 12, 2026 | 54,000 |
| IBK Securities | May 21, 2026 | 49,000 |
These are Korean-language notes. I read the IBK and iM documents in full and have the Korea Investment figure only through a Korean report-summary wire, so its analyst name and forecasts are unverified. All three predate the June-quarter results. I am quoting them as market facts and I am not adopting any of them as my own view.
Buybacks that already happened
This company retired 671,453 shares in November 2024 and a further 1,371,183 shares in May 2025, canceling 2,042,636 shares in total. Adding those back to the current 26,557,734 shares outstanding gives 28,600,370 before the buyback, so 7.14% of the register was canceled by my calculation. The dividend yield of 0.87% therefore understates what shareholders received. None of this bears on the capex question, so it stays here.
Vendor fields I could not pin down
The market-data screen I use carries two payout-ratio values for this company, 15.7 and 64.8, and I could not establish which definition each uses, so I used neither. The same screen reports a seven-year dividend growth streak while the filed dividend history runs 100, 100, 100, 100, 150, 200 and 200 won, meaning the last two years are flat. A disclosure of a supply contract was filed on August 21, 2026 with the counterparty and value not available to me, and a corporate value-up plan was announced in January 2026 whose text I have not seen.
My Position on Sungkwang Bend Stock and What Would End It
At about KRW 609.5bn of market value this sits well outside the top hundred Korean listings, which puts it in my watch bucket by default. What I have written down for myself is narrower than a view on the shares: a manufacturer that takes in a third more work while spending a fiftieth as much on its plant is telling me something about the durability of that work, and I want the third quarter before I decide what.
My honest expectation, and I will say it plainly, is that reading one is closer to right. A company with 210.8 days of inventory, no debt worth naming and a completed spending block does not need to buy machines to fill a KRW 1,155 hundred million backlog. If that is what is happening, the operating leverage on the way back up is better than the current margin suggests. I am not acting on that expectation yet, and the reason is in the next paragraph.
The condition that ends this note
The first quarter of 2026 was weak for reasons the sell-side put down to three things at once: delayed revenue recognition, the timing of US tariff costs, and an inventory valuation provision. If two of those three were one-off, then the underlying margin is higher than what I can see, and a normalized number would change how I read the whole capex decision. I have not managed to separate the three, because the company does not publish the amounts. Should the third-quarter notes break them out and show that the operating weakness was mostly provisions, my framing of a management team hesitating over capital collapses. It would then be a company with ordinary accounting noise and a finished capex cycle, and I would have spent this note on the wrong line.
Fourteen things that argue against me
- The one that costs me most: I have the cash outflow and not the asset detail. A KRW 70m half could mean a project finished, a project deferred, or simply that the invoices land in the second half. Three explanations, one number, and the filings do not choose between them.
- Capex at this company was never large. Even the 2025 peak was 1.82% of revenue, so the fall is from a low base and the absolute swing is under KRW 5bn.
- Maintenance spending can be expensed as it is incurred and never reach this line, in which case the plant is still being looked after and the line I am staring at is an accounting boundary.
- The June quarter did improve. Revenue of KRW 64,132m was up 10.37% year on year.
- Net profit for the half rose 15.14% year on year even as operating profit fell, helped by non-operating items that a debt-free balance sheet generates.
- The backlog recovery is real and it comes from the company’s own disclosure without a broker in between.
- IBK Securities wrote that more than 60% of first-quarter intake was for US liquefied natural gas terminals and that volumes from projects sanctioned in 2025 should convert from the third quarter of 2026.
- Inventory days improved to 210.8 from 243.8 a year earlier, which is working capital moving the right way.
- Operating cash flow of KRW 7,489m in the half was positive against negative KRW 1,165m in the comparable half of 2025.
- The balance sheet is close to unlevered, so nothing forces a decision on management’s timetable.
- My sector benchmark is a synthetic equal-weighted index built by the tool I use, and the 96-constituent classification is that tool’s, not an exchange’s.
- Korean shipbuilding, one of this company’s end markets, took 7.97m CGT of orders in the first half of 2026, up 60% year on year on Clarksons data cited in the Korean trade press.
- The company said in a Korean interview that its fittings are going into liquid cooling loops for artificial-intelligence data centers, an end market that did not exist in its historical mix.
- A single half-year is a short window for a capital-spending argument, and I am building a thesis on two quarterly filings.
For comparable setups elsewhere in Korean heavy industry I have written up a yard with a full order book and no distribution, a materials supplier carrying inventory its licensor never touches, and a shipbuilder through a 32% drawdown. The through-line in all three is the gap between what a backlog promises and what the accounts actually show, which is the same gap I am looking at here from the asset side.
Prices and multiples reflect the August 21, 2026 (Fri) close as I checked them on August 24, 2026 (Mon), so live quotes can differ. Financial figures come from the company’s Korean regulatory filings and its own investor materials. Korean won is the reference currency here. The two USD figures quoted use roughly KRW 1,386.5 per dollar on the same date, which is an approximate rate, and the peer figures are left in the currency each company reports.