Korea’s UNID: Plant Assets Up 42.7% While Sales Slipped
UNID Company Ltd. ended 2025 with less revenue than it had in 2022, and in the fourteen quarters between those two closes it added 42.6905 percent to its property, plant and equipment. That pair of facts is where I started with UNID stock, and it is still the only thing about this company I am sure I have read correctly. The company is a Korean maker of potassium chemicals, listed on the KOSPI, which is Korea’s senior exchange and the rough local equivalent of the NYSE main board. It spent fourteen quarters getting physically larger. The sales line has not yet caught up with the plant it now owns.
- Plant, end-2022 to mid-2026: 465.56 to 664.31 billion won
- Revenue, 2022 to 2025: 1,404.90 to 1,338.76 billion won
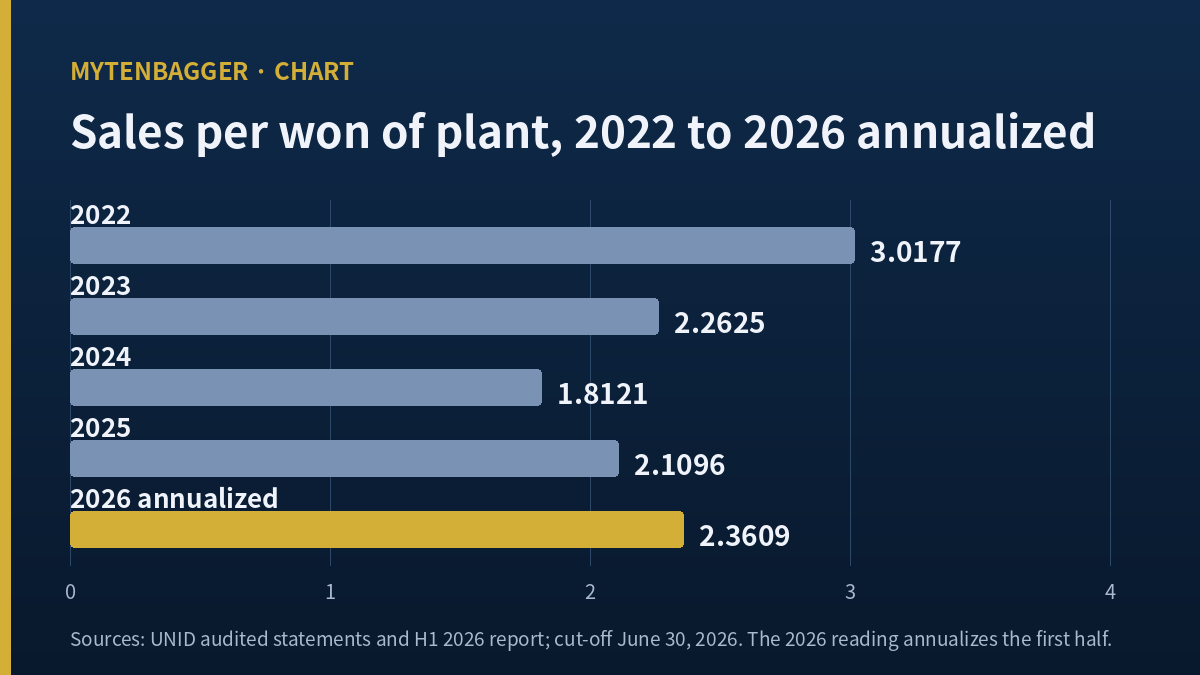
- Revenue per won of plant: 3.0177 to 2.1096 (second figure divided by the first)
I do not own the shares and I have no order working. What follows is the note I keep for myself about what would have to be true before I did.
Contents
What fourteen quarters of building did to the UNID stock asset side
The plant line moves in one direction across every close I can open. In billions of won it reads 465.56 at end-2022, 501.10 at end-2023, 613.45 at end-2024, 634.60 at end-2025, and 664.31 at the June 2026 close. The whole increase is 198.75 billion won, which is 42.6905 percent on the 2022 figure. At the September 22, 2026 exchange rate of 1,358.2 won to the dollar, the plant went from roughly 342.8 million dollars to roughly 489.1 million dollars.
The plant in tons, which is where the UNID stock story actually starts
Won figures alone would leave me guessing at what was built. KED Global reported in September 2023 that the company had lifted its Ulsan potassium hydroxide capacity from 380,000 tons to 400,000 tons with an 11 billion won outlay, and that the Ulsan site together with the Chinese operation’s 320,000 tons gave a combined 720,000 tons. The same piece put the company first in the world in potassium hydroxide by installed capacity, at around 34 percent.
Two things in that report matter for the asset line I am tracking. The first is that the Ulsan step, worth twenty thousand tons of capacity, cost 11 billion won, which is small against a plant line that grew by 198.75 billion won over the full span. Most of the increase therefore did not happen in Ulsan. The second is the sentence about Hubei: a new potassium hydroxide plant in that province with completion targeted for 2027. If that project is inside the June 2026 asset figure as construction in progress, then part of the 664.31 billion won I am dividing revenue by has never produced a ton of anything, and my ratio is punishing the company for a plant that is not finished.
I could not establish from any statement I opened how much construction in progress sits inside the plant line. That single unknown is the largest soft spot in this piece, and I would rather name it here than bury it below.
Against 720,000 tons of nameplate capacity, my annualized 2026 revenue of 1,568.40 billion won works out to about 2.18 million won of revenue per ton of capacity, or roughly 1,600 US dollars. That figure is only a rough gauge: the company sells potassium carbonate and other products as well, and capacity has moved since the 2023 report.
Nothing about that sequence is odd for a chemical company. Electrolysis capacity is lumpy and it is built years before it is needed. What I wanted to know was simpler: has the extra plant turned into extra sales yet.
The one UNID stock number I keep returning to
I divided each year’s revenue by the plant carried at that year’s close. The result is how many won of sales each won of plant delivered that year, and I did that calculation myself for all five years.
| Year | Revenue (bn won) | Plant at close (bn won) | Sales per won of plant |
|---|---|---|---|
| 2022 | 1,404.90 | 465.56 | 3.0177 |
| 2023 | 1,133.72 | 501.10 | 2.2625 |
| 2024 | 1,111.63 | 613.45 | 1.8121 |
| 2025 | 1,338.76 | 634.60 | 2.1096 |
| 2026 annualized from H1 | 1,568.40 | 664.31 | 2.3609 |
Sources: Hankyung Markets annual financials, Valueline balance sheet as of the June 2026 close. Final column is my own calculation. The 2026 revenue line doubles the first half; it is my estimate and no part of it comes from the company.
The trough was 2024, and it was deep
From 3.0177 to 1.8121 is a fall of 39.9510 percent in two years. Half of that came from the plant getting bigger and half from revenue falling, which is the least comfortable combination a capital-spending program can produce. Revenue in 2024 was 20.8 percent below 2022 while plant was 31.8 percent above it.
The rebound is real and it is partial
By 2025 the reading was back to 2.1096, which is 30.0913 percent below the 2022 figure. Doubling the first half of 2026 lifts it to 2.3609, or 21.7624 percent below 2022. So the direction has turned. The level has not returned. Four years after the spending began, each won of plant still carries about a fifth less revenue than the plant this company owned before it started.
The profit line moved further than the sales line did
Revenue is the gentler of the two series. Operating profit over the same five years, in billions of won, went 148.86, 147.87, 32.07, 95.44 and 87.91, and I checked each margin against the published percentage myself: 16.9711, 10.5253, 2.8287, 8.5860 and 6.5664 percent. The 2023 collapse is the one to sit with. Revenue that year fell 19.3 percent from 2022 while operating profit fell 78.3 percent, which is what operating leverage does to a business with a large fixed asset base and a price-taking product.
The 2021 figures are the ones that unsettle my whole approach. That year produced the smallest revenue of the five, 877.11 billion won, and the largest operating profit, 148.86 billion won, on a margin of 16.9711 percent. A company that earned its best profit on its thinnest revenue is telling me that price, and not volume, set the outcome. My sales-per-won-of-plant ratio has nothing to say about price. I keep it because it answers a different question, which is whether the asset is being used, and I flag here that it cannot answer the question 2021 raises.
Net profit followed its own path again: 182.55, 124.27, 16.26, 76.23 and 65.26 billion won. In 2021 net profit exceeded operating profit by 33.69 billion won, which means something below the operating line contributed close to a fifth of the year’s result. I did not open the statements far enough to name it, so it stays out of my argument.
The five-year picture in dollars, at the September 22, 2026 rate: 2022 revenue was about 1,034.4 million and 2025 revenue about 985.7 million. A US reader looking at those two figures alone would see a company that has gone nowhere in three years. The plant line says it has gone somewhere, just not yet into the sales line.
Utilization is the missing half of the UNID stock case
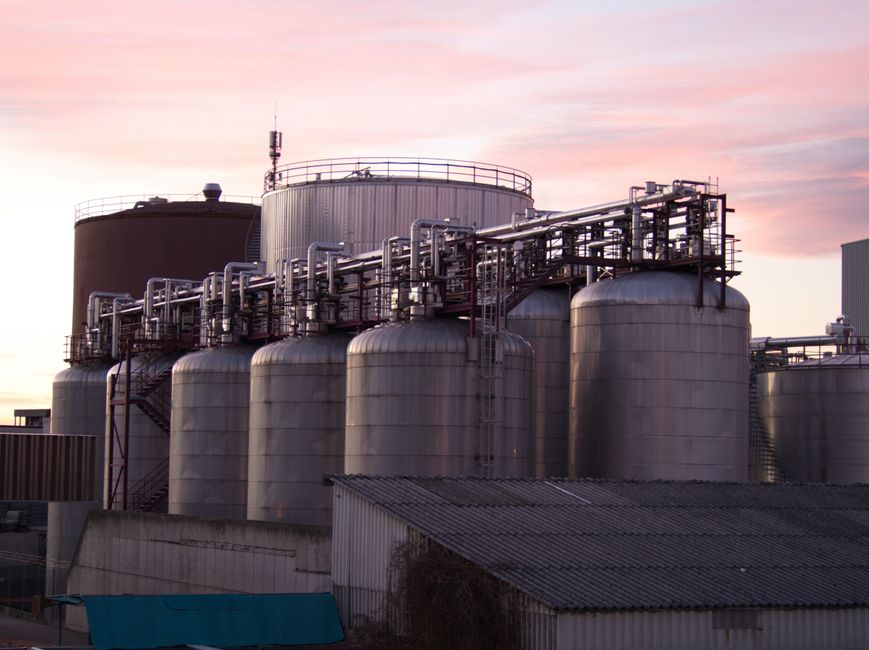
A ratio like that one tells me the plant is under-loaded. It does not tell me by how much, and for most Korean mid-caps that second question has no public answer. This one does. In an August 31, 2026 piece, Newswhoplus put the company’s operating rate for the April to June quarter at 68 percent, against a company target of 90 to 95 percent for the second half of the year.
Sixty-eight is the number that makes the table above legible. The plant exists, it is on the asset side at 664.31 billion won, and roughly a third of it is idle. If the second-half target lands anywhere near 90, the sales-per-won reading moves without a single additional won of spending. If it does not land, then the 2.3609 I calculated for 2026 is close to what this asset produces at a normal load, and the whole fourteen-quarter program has bought a lower return on a bigger base.
I have seen the other side of this before. A company I looked at earlier this year had raised only part of what its own spending consumed, and the question there was funding, while the question here is loading. Here the funding looks settled. The loading does not.
What the other asset lines did over the same fourteen quarters
Plant is not the only line that moved. Over the same five closes, in billions of won, cash went 135.44, 146.03, 71.14, 68.93, 77.33. Inventory went 293.79, 137.42, 138.42, 172.18, 172.55. Trade receivables went 322.98, 251.47, 257.88, 323.10, 402.32.
Two things there are worth saying out loud. Cash at the June 2026 close is 42.9047 percent below the end-2022 figure, and receivables are 24.5156 percent above the end-2025 figure after six months. Inventory, by contrast, barely moved through the first half of 2026: 172.18 to 172.55, an increase of 0.2149 percent.
I am not going to rest a working-capital argument on those three lines, because I cannot see how they split between the Korean operation and the Chinese one, and this company’s two halves do not behave alike. What I take from them is narrower: the asset side got heavier in more than one place, and the heaviest single line is still the plant at 664.31 billion won.
Where UNID stock sits against the assets it owns
At the September 22, 2026 close the equity was worth roughly 299 million US dollars. Total assets at the June 2026 close were 1,731.40 billion won, or about 1,274.8 million dollars, which makes the asset pile 4.257 times the market value of the equity. The plant alone, at 664.31 billion won, is 1.633 times that market value.
Liabilities are 517.45 billion won against equity held by the parent’s owners of 1,213.95 billion won, a ratio of 42.63 percent. Current assets of 858.65 billion won sit against current liabilities of 364.69 billion won, which is 235.45 percent. Neither of those looks like a company under financing pressure.
I am deliberately leaving out every valuation multiple. Four separate services published four different price-to-earnings figures and four different price-to-book figures for this company on the same day, and I could not establish which of them used which earnings window. A multiple I cannot trace back to its inputs is not evidence. I did the same thing with a Korean building-materials name whose revenue mix turned out to sit mostly in one segment, where the headline classification hid what the company actually sells.
There is a piece of Korean market context a US reader needs before the asset figures mean anything. Korean industrials routinely trade below the accounting value of what they own, to a degree that has its own name in the local press and its own policy programs aimed at closing it. So an asset pile worth 4.257 times the equity’s market value is not, by itself, an anomaly here. It is close to ordinary. What makes this particular gap worth my time is that the asset pile grew by an amount I can see, for a purpose the company put in writing, and the purpose has a testable date attached to it.
The loading figure and the stock levels also fit together in a way I did not expect. At a 68 percent operating rate, I would have guessed at finished goods piling up. They did not: the stock line moved from 172.18 to 172.55 billion won across the first half of 2026, an increase of 0.2149 percent, which is flat in any practical sense. Trade receivables, meanwhile, rose 79.22 billion won over the same six months. Read together, those two suggest the company is selling what it makes and waiting longer to be paid for it, which is a different problem from making things nobody wants. It is also a problem that shows up on the asset side and stays out of the profit statement, which is exactly where I have been looking.
The last thing I want on the record is what the word consolidated is doing in every figure above. This company runs a Korean operation and a Chinese one, and by revenue the overseas side is now the larger of the two. Every asset figure I have used merges them. If the Chinese assets are newer, they carry less accumulated depreciation and sit at a higher net value for the same physical plant, which would push my ratio down without any operating meaning at all. I have no way to separate the two from what I opened, and a reader should discount my ratio by however much that possibility is worth to them.
A US peer I named and chose not to open
The obvious overseas comparison is Olin Corporation (NYSE: OLN), a US chemicals company whose chlor alkali segment puts into its own business name the very product this company carries as a by-product of making potassium hydroxide. That is why I picked it, and that is the whole of why I picked it.
I have not opened Olin’s financial statements for this piece. That was a decision and not an oversight: a peer table built in the last hour of a session is the kind of thing I end up defending later, and the one comparison I would want here, sales against installed plant, needs both companies’ fixed-asset policies read side by side before it means anything. So the peer appears here as a name and a reason, with no figures attached.
Three ways UNID stock runs from here
Everything above turns on one question, which is whether the idle third of the plant gets loaded. Here is how I weight the three answers, with the weights written down so they can be checked later.
The load arrives (I put this at about 45 percent of the weight)
Operating rates move toward the 90 to 95 percent the company is aiming at, the 2026 annualized figure of 2.3609 keeps climbing through 2027, and the sales-per-won reading closes most of the remaining 21.7624 percent gap to 2022. In that world the fourteen-quarter program was early and correct, and the asset pile at 4.257 times market value starts to look like an argument.
The load half arrives (about 30 percent)
Rates settle somewhere in the seventies or low eighties. Revenue grows, the reading improves a little, and the company ends up with a permanently lower return on a permanently larger base. This is the outcome I consider most likely to be mistaken for the first one, because both produce rising revenue.
The load does not arrive (about 25 percent)
Sixty-eight turns out to be near the practical ceiling for this configuration of plant and end-market. The 2024 reading of 1.8121 then stops looking like a trough and starts looking like what a bad cycle does to an over-built asset.
Those percentages are my own weighting and nothing more. I put them in writing so that a later version of me can see how badly I called it.
Fourteen things that argue against the way I read this
- Sales per won of plant is a crude gauge. It ignores capacity that is leased, tolled or held through affiliates, none of which I could see from a consolidated statement.
- Property, plant and equipment is a net figure after depreciation. Some of the 42.6905 percent increase may be slower depreciation and no new steel in the ground at all.
- I do not know what share of the plant sits in China and what share sits in Korea, and the two operations are on different demand curves.
- Assets under construction, if any, are inside the plant line but produce no revenue at all. That alone could explain part of the decline in the ratio.
- The 2026 revenue figure of 1,568.40 billion won is my own doubling of the first half. Chemical years are rarely symmetrical.
- Revenue in 2021 was 877.11 billion won against operating profit of 148.86 billion. A company that earned its best operating profit on its smallest revenue does not obey a simple volume story, and my ratio assumes volume matters most.
- The 68 percent operating rate comes from a single press article. I did not open a filing that carries it.
- The 90 to 95 percent second-half target is a company aim. Aims are not results.
- Hankyung’s annual table shows zeroes in the 2025 per-share lines, which tells me that service’s latest year is incomplete. I used only the revenue, profit and margin lines from it.
- Valueline’s asset figures are given to one decimal place in hundreds of millions of won, so every difference I took inherits that rounding.
- I could not obtain paid-in capital or par value from any source, so I never checked the shares outstanding against a second calculation.
- Two named Korean brokerages published per-share valuations for this company in January and April 2026. Both sit above the current price. I have adopted neither, and neither is in this piece as a number.
- Operating profit in 2025 was 87.91 billion won against 147.87 billion in 2022. A plant that is 42.6905 percent larger is producing 40.5 percent less operating profit than the smaller plant did, and my ratio says nothing about why.
- Everything above is consolidated. If the Korean and Chinese halves have different asset intensities, the single ratio I built is an average of two things that do not average well.
The three conditions that break my UNID stock reading
- If the Q3 2026 report shows operating rates still near 68 percent after a second-half target of 90 to 95, then the target was not a forecast and I should treat the 2024 trough as the working case.
- If the same report separates property, plant and equipment between Korea and China and the split is heavily weighted to plant that is already fully loaded, my whole under-loading argument dissolves and the low ratio has a different cause.
- If 2026 full-year revenue lands materially below my annualized 1,568.40 billion won, then the 2.3609 reading was too generous and the rebound in the table is smaller than it appears.
All three are answered by one document, and its statutory deadline is November 16, 2026. That is eight weeks out, which is short enough that buying ahead of it buys very little extra time and long enough that a great deal can move in the potassium market before it lands. I have chosen to treat the deadline as the decision date and not as a formality, because every one of the three conditions above turns on a figure that only appears in a statutory filing.
What I am doing with UNID stock, and the figure I used to skip
I am watching and I have not bought. The asset pile is large against the market value of the equity, the financing looks calm, and the direction of the ratio I care about has turned. None of that is a reason to act while I still cannot say whether the plant is early or over-built.
A utilization percentage is the kind of figure I used to read past. It sits in a trade article, it has no decimal places, and it never appears in the statements I usually open. For years I treated an increase in plant as an increase in capability, which is a substitution I made without noticing I was making it. Sixty-eight taught me the difference: the capability is on the asset side, and whether it is being used is somewhere else entirely. From here on, when a company’s plant grows faster than its sales, I look for the loading figure before I decide what the growth in assets means.
That is the correction, and it is about my procedure and not about this company. The company has done nothing wrong that I can see. It built, and the market it built for has not yet turned up in the volume the plant was sized for. Whether that is patience or a misjudgment is the thing the next report settles, and I would rather wait eight weeks than guess.
Prices and conversions reflect the September 22, 2026 close. USD figures are approximate, at roughly 1,358.2 won per dollar on the same date.