Hy-Lok Margins: The Net Margin Misses in Four of Five Years
- Operating profit divided by revenue matches the stated operating margin in all five years.
- Net profit divided by revenue misses the stated net margin in four of those same five years.
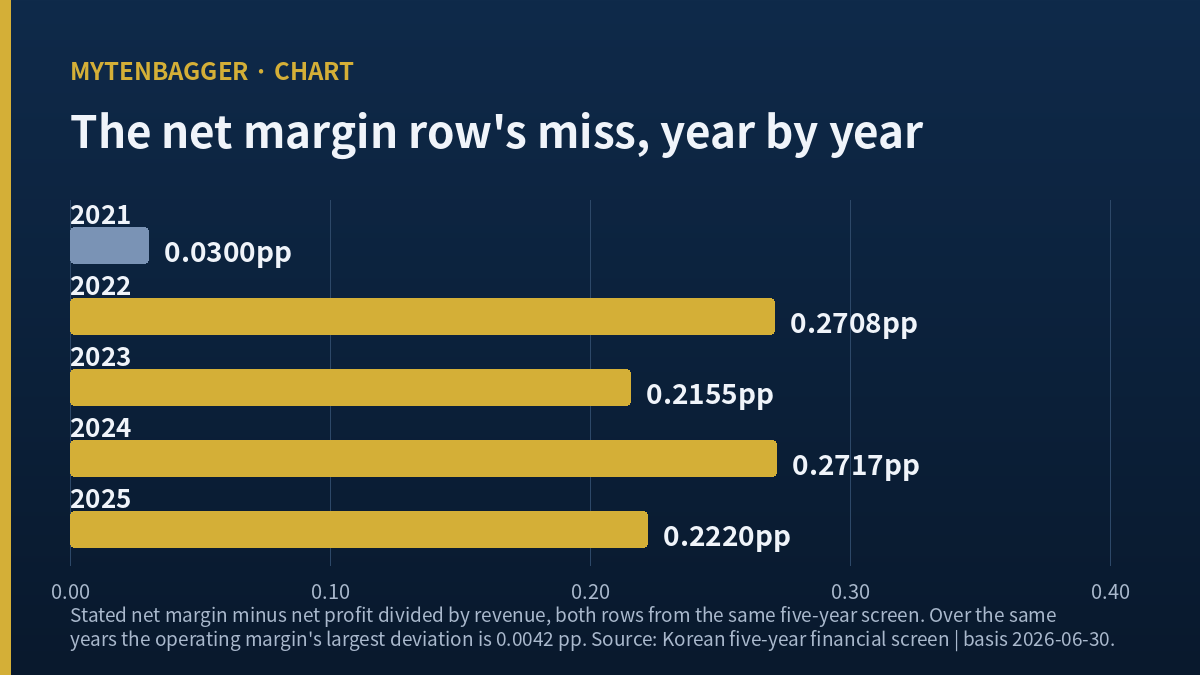
- The miss runs 0.2155 to 0.2717 points, always in one direction, and rounding cannot produce it.
I opened a five-year overview table for Hy-Lok stock expecting to spend ten minutes on it. Three columns sat side by side: revenue, net profit, and net margin. I divided the second by the first to see whether the third came back, and it did not. Then I did the same thing one row higher, with operating profit, and that one came back to the fourth decimal.
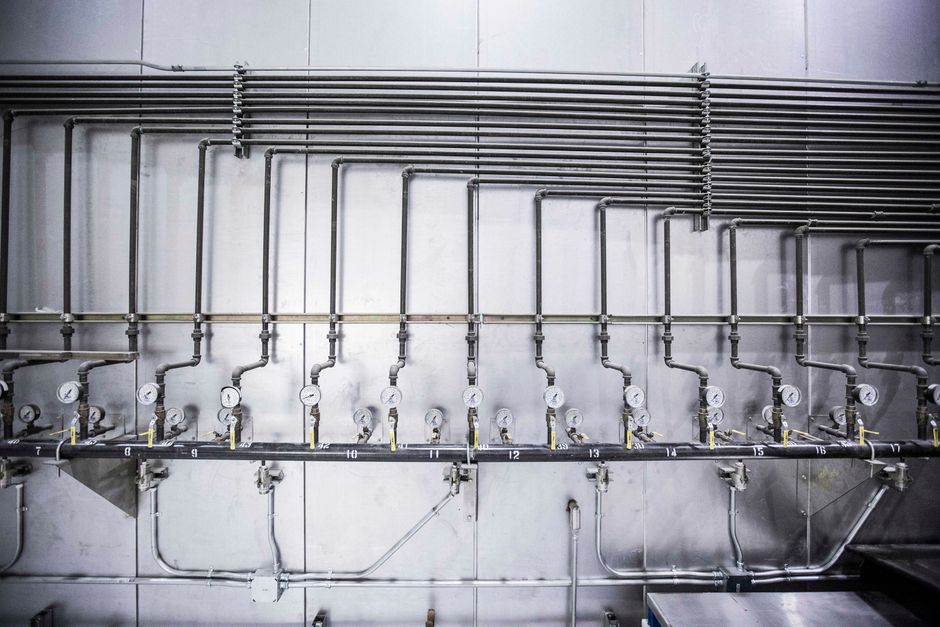
Hy-Lok Corporation is a KOSDAQ-listed maker of tube fittings and valves. The fittings join and redirect the lines that carry fluid; the valves open and close that flow. The company’s main products are the small-bore parts that sit between an instrument and a pipe. The large-bore parts that go onto heavy piping are somebody else’s business. That distinction matters later.
A word on where this trades and in what. KOSDAQ is Korea’s secondary exchange, the venue for mid-size and smaller listings, and it sits alongside the main KOSPI board the way the Nasdaq once sat alongside the NYSE in profile. Reporting is in won, and won is the governing unit for everything in this piece. I give dollar equivalents in a few places only, at one rate on one date, and I keep the won figure as the one that governs.
Contents
Five Years Behind Hy-Lok Stock, and One Line That Will Not Divide
Here are the three income-statement lines as that overview table gives them, in billions of won. Revenue: 146.74, 182.85, 188.84, 190.51, 214.57. Operating profit: 18.92, 40.70, 51.89, 50.13, 58.91. Net profit: 19.47, 33.86, 47.33, 47.51, 50.29. The table also gives an operating margin and a net margin for each year, and those two percentage lines are what I set out to check.
The exercise is not clever. It is the first thing I do with any vendor screen, because a percentage sitting beside two numbers is the cheapest thing on the page to verify. Most of the time it verifies and I move on without writing anything down. This time half of it did not.
What I Did, in One Sentence
I divided operating profit by revenue for each of the five years, compared each result with the operating margin the table states, then repeated the whole thing with net profit and the stated net margin. That is the entire method. Both percentage lines sit in the same table, one directly under the other, sourced from the same two numerator rows and the same single revenue row.
The Operating Margin Reproduces on All Five Years
| Year | Stated OPM | My own math | Stated NPM | My own math | NPM miss (pp) |
|---|---|---|---|---|---|
| 2021 | 12.89 | 12.8905 | 13.30 | 13.2700 | 0.0300 |
| 2022 | 22.26 | 22.2565 | 18.79 | 18.5192 | 0.2708 |
| 2023 | 27.48 | 27.4792 | 25.28 | 25.0645 | 0.2155 |
| 2024 | 26.31 | 26.3136 | 25.21 | 24.9383 | 0.2717 |
| 2025 | 27.46 | 27.4558 | 23.66 | 23.4380 | 0.2220 |
Sources: Korean five-year financial screen. The columns headed “My own math” are exactly that, worked from the revenue and profit rows of the same table. Figures reflect the September 22, 2026 close; USD conversions below are approximate, at roughly 1,358.2 won per dollar on the same date.
Look at the operating margin first. The largest deviation across the five years is 0.0042 points, at 2025. Every other year lands inside four thousandths. That is exactly what rounding to two decimals should produce, and it tells me the operating margin line is built from the revenue row and the operating profit row of this same table.
The Net Margin Misses on Four of Five
Now the row underneath. In 2021 my own figure lands 0.0300 points below the stated figure, which is inside the tolerance I would expect. Then 2022 misses by 0.2708, 2023 by 0.2155, 2024 by 0.2717, and 2025 by 0.2220. Four consecutive years, all in the same direction: the stated net margin is always larger than the net profit row divided by the revenue row.
Two percentage lines, one above the other, from what looks like the same three rows. One reproduces and one does not. Whatever the second line is made of, it is not entirely made of what sits above it.
What I Got Wrong About That Row
The row itself is where I slipped. I read the net margin as a result of the two numbers beside it, the way I read the operating margin, and for four of five years it is not that. I had been treating the whole percentage block as output worked out from the rows above it, when part of it is independent input. Correction I am keeping: a percentage sitting next to two numbers is not necessarily those two numbers divided, and the way to find out is to try it on every row before trusting the first one that works.
Rounding Does Not Explain the Gap in Hy-Lok Stock’s Table
This is the part I checked hardest, because the boring explanation would have ended the piece. Take 2025. The stated net margin is 23.66 percent, so the true value lies somewhere between 23.655 and 23.665 percent. Multiply both ends by the revenue row of 214.57 billion won and the numerator has to fall between 50.7556 and 50.7770 billion won. The net profit row says 50.2900 billion won. The shortfall is between 0.4656 and 0.4870 billion won, and it is outside the window rounding can open.
Running the same reconstruction on the other years gives shortfalls of 0.4952, 0.4070 and 0.5176 billion won for 2022 through 2024, against 0.0441 billion won for 2021. So the four missing years cluster between roughly 0.41 and 0.52 billion won, which is about USD 0.30 to 0.38 million at the rate in the footnote above. The 2021 shortfall is an order of magnitude smaller.
A residual that consistent is a definition. It is not a typo. The most likely reading is that the stated margin uses total consolidated profit while the profit row shows only the portion owned by the parent, with the difference belonging to minority holders. That would also explain why 2021 behaves differently. I cannot confirm any of it from this screen, and I did not open the audited statements to find out. So it stays a reading.
Leaving a reading as a reading is something I learned to do late. In a piece comparing a Korean industrial’s stock levels against its overseas industry, the comparison held only because both sides published on the same basis. When that condition fails, the honest move is to say what the number could mean and stop there.
Three Reasons I Am Watching Hy-Lok Stock and Not Buying It
First, I do not know whose profit I am looking at
Every multiple I might want to use here has net profit in it. If the profit row and the margin row are using different definitions of that word, then any per-share figure I build sits on a choice I have not made consciously. I would rather hold off than pick one by accident.
Second, the profitability step that matters happened four years ago
The operating margin went from 12.89 percent to 22.26 percent between 2021 and 2022, which is a move of 9.37 points in one year. Everything after that sits inside a narrow range: 27.48, then 26.31, then 27.46. Whatever changed the economics of this business changed it once, and I was not watching at the time. Buying now means paying for a step I did not see happen and cannot re-examine from an overview screen.
The year-on-year figures show the same thing from a second angle. Revenue grew 24.6101 percent in 2022, 3.2748 percent in 2023, 0.8860 percent in 2024 and 12.6257 percent in 2025. Operating profit over the same four steps grew 115.1493 percent, then 27.5096 percent, then fell 3.3933 percent, then grew 17.5145 percent. Over the full stretch revenue rose 46.2232 percent while operating profit rose 211.4451 percent, and more than half of that profit gain sits in the first step alone. Only 2024 has the two moving in opposite directions, and it is also the year with the smallest revenue change of the four.
That distribution is why I keep coming back to the step and not the level. A company whose six months once matched a full prior year taught me to check where a move landed before reading the level it produced. Here the move landed in 2022 and the level has been quiet ever since.
Third, the one dated forecast I trust most declined to put a number on it
More on that below. The short version is that the most recent named document about this company gave a full demand thesis and then wrote N.R where the valuation goes.
What the Company Sold, by Industry and by Product
Two different splits of the same revenue are publicly visible, and they have opposite defects. The industry split for 2025 runs petrochemicals 41.6 percent, shipbuilding 13.4 percent, offshore 11.6 percent and semiconductors 10.0 percent. Those four add to 76.6 percent. The remaining 23.4 percent carries no label at all.
The product split closes to a hundred: Hy-Lok fittings 39 percent, Hy-Lok valves 36 percent, other products and merchandise 16 percent, bite-type fittings 7 percent, pipe fittings 2 percent. That one adds up, but the screen carrying it puts no period label on the split, so I cannot tell which year or half it describes.
The smallest named industry line is also the one the company says is growing. Korean press reports the semiconductor share moving into the mid-teens this year. I have no way to say what that growth displaced, because the unlabeled 23.4 percent could absorb the entire move without any of the four named lines changing.
Where Hy-Lok Stock’s Forecasts Come From
Three documents, three different forms. A Daishin Securities note dated May 26, 2026, by analyst Park Jang-wook, models 236.2 billion won of revenue and 66.7 billion won of operating profit for 2026, then 248.3 and 74.5 for 2027. It quotes the shares at 7.9 times earnings and 3.4 times EV to EBITDA on those 2026 numbers, notes the company has historically traded nearer ten times earnings, and marks both its rating and its valuation N.R.
An unsigned note dated April 10, 2026 models 236.0 and 61.0 for 2026, then 267.0 and 73.0 for 2027. Its revenue view for 2026 is within 0.2 billion won of Daishin’s; its operating profit view is 5.7 billion won lower. So the two documents agree almost exactly on what this company will sell next year and differ by 9.34 percent on what fraction of it will be profit. I am not building anything on top of that, because the second document has no author on it.
The gap has a form worth naming. On 2026 the two notes sit 0.0847 percent apart on revenue and 9.3443 percent apart on operating profit. On 2027 that reverses: 7.0037 percent apart on revenue and 2.0548 percent apart on operating profit. Behind it are two different margin assumptions, 28.2388 against 25.8475 percent for 2026 and 30.0040 against 27.3408 percent for 2027, with both documents expecting the margin to rise between the two years and by a similar amount. The half year already filed came in at 28.8360 percent, above one assumption and below the other. I am recording that without resolving it, because one of the two documents has no name on it.
The Daishin thesis, for what it is worth, runs through liquefied natural gas. Damage to two mega-train facilities in Qatar took an estimated 2.5 to 3 percent of global LNG supply offline, with repair work described as a two to three year job, and the note argues that buyers will pull forward mid-size modular projects with shorter lead times. The same note lists its own risks: supply disruption persists even if shipping lanes reopen, replacement projects may slip where the thesis expects them to accelerate, and a global slowdown would hit offshore and shipbuilding demand directly.
The Half Year Already on the Board
Two quarters, and a margin that slipped slightly
First quarter revenue came in at 54.1 billion won with 15.7 billion won of operating profit, reported on May 20, 2026 as a 10.4 percent revenue gain and a 23.5 percent profit gain. Second quarter revenue was 59.3 billion won with 17.0 billion won of operating profit and 14.8 billion won of net profit, per the preliminary earnings filing of August 10, 2026.
Dividing gives 29.0203 percent for the first quarter and 28.6678 percent for the second, so the margin slipped 0.3525 points even though revenue rose. Across the half, 113.4 billion won of revenue produced 32.7 billion won of operating profit, a margin of 28.8360 percent. That half year is 48.01 percent of Daishin’s full-year revenue model and 49.03 percent of its operating profit model. It is 53.61 percent of the unsigned note’s profit model.
The quarterly net figures show the same asymmetry I found in the annual table, and this time from filed numbers where the annual table came off a vendor screen. First-quarter net profit of 15.3 billion won against 54.1 billion won of revenue is 28.2810 percent. Second-quarter net profit of 14.8 billion won against 59.3 billion won is 24.9578 percent. That is a swing of 3.3232 points between two consecutive quarters, while the operating margin over the same two quarters moved only 0.3525 points. The net line is roughly nine and a half times as volatile as the operating line across that single step. Whatever sits between operating profit and net profit at this company is doing more work than the size of the two margins would suggest.
Scale helps here. At roughly 1,358.2 won to the dollar, 2025 revenue of 214.57 billion won is about USD 158.0 million and operating profit of 58.91 billion won is about USD 43.4 million. The half year on the board is about USD 83.5 million of revenue. This is a small company by any US frame, which is part of why the definitional question above is not academic: on a base that size, a few hundred million won of unexplained profit moves a per-share figure visibly.
I am reading the half as roughly on track against the named forecast and ahead of the unsigned one. I am not annualizing it. That is a reflex I gave up some time ago.
The filing record over the last sixty days is thin and, for my purposes, clean. There are three items: the preliminary earnings disclosure behind the second-quarter figures above, and two abbreviated large-holding reports filed a week apart in August. None of the three touches shares outstanding, so the per-share math I would eventually want to do is not sitting on a pending dilution event. That is one fewer thing to hold open while I wait on the definitional question.
One more piece of context for the half year. The operating margin averaged 25.8763 percent across 2022 through 2025. The first half of 2026 came in at 28.8360 percent, which is 2.9597 points above that four-year average and above every individual year in it. If the margin question I am chasing were only about the net line, this would read as an unambiguously good half. It still might be. I just cannot price it until I know which profit the percentage rows are describing.
The company paid 1,350 won per share for 2025, which a screen puts at a 30.7 percent payout and a yield near 3.58 percent at the current price. The payout figure does not reconcile cleanly against the net profit row either, which is consistent with the same definitional split I described above.
One Peer I Put Beside Hy-Lok Stock and Left Empty
Parker Hannifin. I chose it for one reason: the thing this company does with all of itself, that company does as one line of a much wider catalogue, and instrumentation fittings and valves are a named part of that catalogue.
I am carrying no numbers over from it. The reason is specific, and I will give it. Parker does not break out an instrumentation fittings line in a form that lines up with what this Korean company reports as its whole business, so any revenue or margin I lifted would be answering a different question from the one I am asking. Naming the peer is the useful part; placing it in a table would not be. There is a second reason I am comfortable leaving the cell empty: the Korean company’s own two revenue splits do not agree on what a segment is, one closing to a hundred without a period label and the other carrying a period but leaving almost a quarter of revenue unnamed. A peer table built on top of that would be borrowing precision from a source that does not have it. The last time I set a Korean industrial against an overseas comparison, the two sides had a common basis available, and that is exactly what is missing here.
Thirteen Ways I Could Be Wrong About Hy-Lok Stock
- I ran this on one vendor screen. Another data provider may print a net margin that reproduces perfectly, which would make the whole finding a property of one vendor.
- My minority-interest reading is a guess. I did not open the audited statements to test it.
- The revenue row itself could differ between the two percentage lines, in which case the numerator is fine and I blamed the wrong side.
- I treated the 2021 deviation of 0.0300 points as noise. It may be the same effect at a smaller scale, which would change how I describe the pattern.
- Reconstructed shortfalls are built from two-decimal percentages, so each carries a range where I have written a single figure.
- I converted those shortfalls to dollars at one rate on one date, which flatters the precision of a range.
- The 2022 margin step could be a mix effect that reverses and no structural change at all.
- The industry split I used is labeled 2025 by one source and I did not verify it against a filing.
- The product split has no period label, and I inferred nothing from it beyond that it closes to a hundred.
- The unsigned forecast may be perfectly good work. I excluded it for its missing byline; its content is another matter.
- I read the Daishin note through a hosted copy and never through the issuer’s own distribution.
- First quarter operating profit appears as 12.7 billion won inside that note and as 15.7 billion won in Korean press and the filing screen. I went with the latter pair and did not resolve the conflict.
- Half-year percentages against a full-year model assume an even split that this business may not have.
What Would Break My Reading of Hy-Lok Stock
- If the Q3 report shows consolidated and parent-only profit lines whose difference matches the 0.41 to 0.52 billion won residual, my reading is confirmed and I stop treating the margin row as unexplained.
- If that difference is far larger or far smaller than the residual, the explanation is something else and I go back to the statements from the beginning.
- If third-quarter operating margin comes in below 26 percent, the post-2022 plateau stops being a plateau and the second of my three reasons for staying out changes form.
All three answer on the same document. The statutory deadline for it is November 16, 2026.
Where I Stand on Hy-Lok Stock Today
No position, no order placed, watching. The reason is not the price and not the demand thesis, both of which look reasonable to me. The reason is that I cannot say with confidence whose profit the second percentage line is describing, and every valuation question I would want to ask about this company runs through that line.
Two branches sit in front of this. In the first, the residual turns out to be minority interest, the margin row is simply a different definition of the same business, and the thing I should be watching next is whether the post-2022 margin plateau holds through a weaker order cycle. In the second, the residual is something else, and then the profit history I have been reading for five years is not the profit history of the entity whose shares are quoted. The first branch leaves my reading of the business intact and only changes what I watch. The second one sends me back to the statements before I form any view at all.
What I want to say plainly is that the company did nothing wrong here. The statements almost certainly answer this in a footnote. What failed was my own procedure: I verified one row, found it clean, and assumed the row under it came from the same place. Five minutes of the same work on the second row would have caught it, and from now on I do both rows before I trust either.
Next thing I look at is the parent-versus-consolidated split in the third quarter report. I will write again then.
Related reading