Nexen Tire Earnings: Why Net Profit Swings More Than Operations
Contents
Nexen Tire Stock and the Lines Underneath It
Between operating profit and net profit an income statement carries four or five more lines: finance income, finance costs, other non-operating gains and losses, and tax. At Nexen Tire stock those lines move by more, quarter to quarter, than the operating profit sitting above them. That is the whole reason I am writing this, and it is why I will quote the company’s price-to-earnings ratio exactly once and then set it down.
The number is 4.48 times. On the Korea Exchange main board, where the KOSPI index tracks roughly 800 listed companies and where a mid-cap tire maker of this size is a small constituent, that is a low figure by almost any comparison. I still decided I could not use it, and I decided that after walking down nine consecutive quarters of this company’s income statement.
I am watching Nexen Tire (Korea Exchange: 002350). What follows is how I got there.
Q1 2026, walked down one step at a time. Each step is labeled by where the figure came from.
Step 1 [disclosed] Operating profit: KRW 54.21 billion (about $38.3 million).
Step 2 [disclosed] Interest expense: KRW 39.28 billion (about $27.7 million).
Step 3 [derived] What remains after Step 2: KRW 14.93 billion (about $10.5 million).
Step 4 [disclosed] Net profit actually reported: KRW 61.99 billion (about $43.8 million).
Step 5 [derived] The gap Steps 3 and 4 leave open: at least KRW 47.06 billion (about $33.2 million) had to arrive from non-operating items other than interest, even assuming zero tax. That minimum equals 86.82 percent of Step 1. I have not confirmed what it was.
Where Nexen Tire Stock Closed, and What KOSPI Is
Every price-derived figure in this piece uses one close: KRW 6,490 on Wednesday, August 12, 2026. I am writing in the early hours of Thursday, August 13, 2026, so that is the prior session’s close. Korean won is the reference currency throughout; dollar figures are conversions for readers who think in dollars.
For anyone unfamiliar with the market: KOSPI is the senior board of the Korea Exchange in Seoul, closer in standing to the New York Stock Exchange than to a growth venue. Its junior sibling, KOSDAQ, hosts smaller and earlier-stage names. This company sits on KOSPI, inside an auto-parts sector that the exchange data I use counts at 147 listed constituents.
| Item | Value | Basis and source |
|---|---|---|
| Close | KRW 6,490 ($4.58) | August 12, 2026 (Wed), Kiwoom Securities data |
| Market capitalization | KRW 633.9 billion ($447.8 million) | 6,490 x 97,673,344 shares = KRW 633,900,002,560, by my calculation |
| P/E and P/B | 4.48x and 0.33x | Kiwoom trailing, vendor primary |
| Net asset value per share | KRW 19,707 ($13.92) | Kiwoom, refreshed August 10, 2026 (Mon) |
| Return on equity | 7.7 percent | Kiwoom; DART filing for FY2025 shows 7.36 percent |
| 250-day intraday high and low | KRW 10,110 and KRW 5,620 | Kiwoom; the close sits at 64.19 percent of the high, or 35.81 percent below it, by my calculation |
| Closing-basis peak and trough | KRW 9,730 (Feb 10, 2026, Tue) and KRW 6,100 (Aug 3, 2026, Mon) | 33.30 percent below peak, 6.39 percent above trough, recomputed at KRW 6,490 |
| Trailing returns | 1M −7.29% · 3M −5.81% · 6M −19.28% · 12M +7.27% | Kiwoom daily series through August 12, 2026 (Wed) |
| Dividend per share | KRW 200 ($0.14) for FY2025 | DART; a 3.08 percent yield at KRW 6,490, by my calculation |
| Foreign ownership | 11.18 percent | Kiwoom |
Prices and multiples reflect the August 12, 2026 (Wed) close as I checked them while writing. Dollar conversions are approximate, at roughly KRW 1,415.7 per dollar on that same date, the Seoul market close.
One Quarter Where Two Numbers Do Not Connect
Q1 2026, in full
The consolidated first quarter, as filed with DART, Korea’s electronic disclosure system: revenue KRW 838.27 billion, operating profit KRW 54.21 billion, net profit KRW 61.99 billion. Interest expense in the same quarter was KRW 39.28 billion.
Subtract the interest from the operating profit and KRW 14.93 billion is left. The company reported net profit of KRW 61.99 billion. Set corporate tax to zero, which is an extreme assumption in the company’s favor, and something outside both operations and interest still has to supply KRW 47.06 billion ($33.2 million) to join those two figures. If tax was actually paid, the required amount grows. So KRW 47.06 billion is a floor, and that floor is 86.82 percent of the quarter’s operating profit.
The tire business earned KRW 54.21 billion that quarter. Something with no direct connection to selling tires contributed at least KRW 47.06 billion on top. I could not establish from the quarterly filing what it was. Currency translation is my guess, and a guess does not belong beside a figure, so I am recording it as unconfirmed.
Nine quarters, side by side
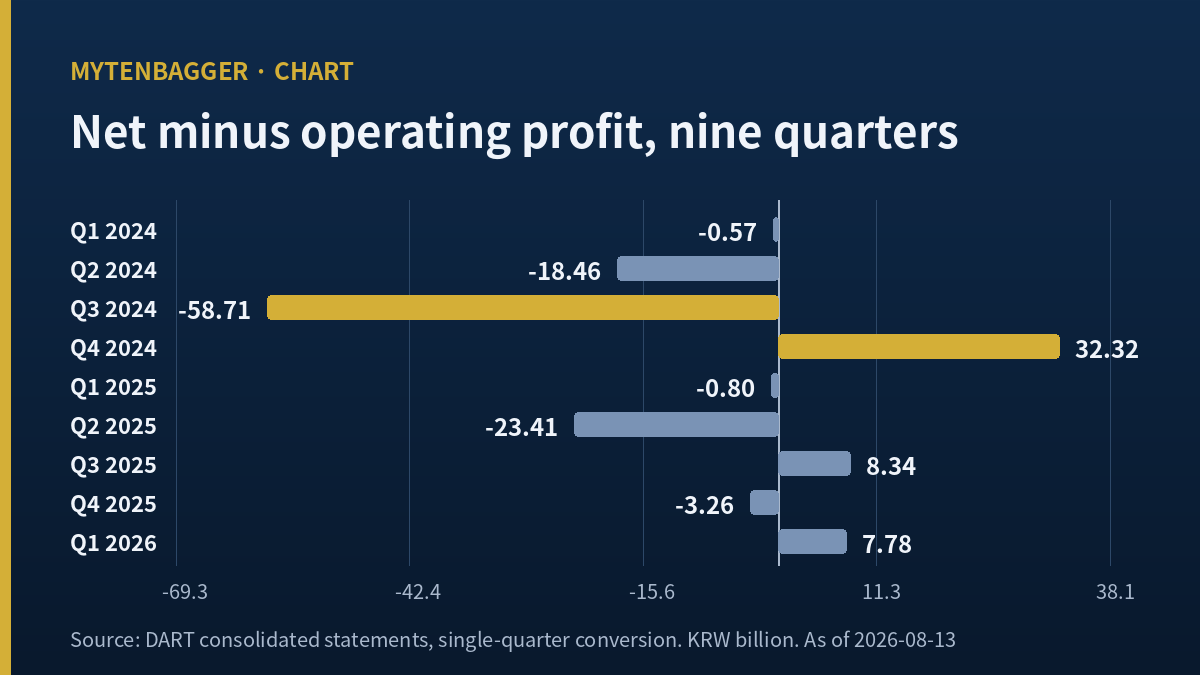
A single quarter can be an anomaly, so I laid out nine. Single-quarter values below are cumulative DART filings minus the prior cumulative filing; fourth quarters are the annual figure minus the nine-month cumulative.
| Quarter | Revenue (KRW bn) | Operating profit | Net profit | Net minus operating |
|---|---|---|---|---|
| Q1 2024 | 678.08 | 41.55 | 40.98 | −0.57 |
| Q2 2024 | 763.75 | 62.86 | 44.41 | −18.46 |
| Q3 2024 | 708.51 | 52.26 | −6.45 | −58.71 |
| Q4 2024 | 697.58 | 15.46 | 47.78 | +32.32 |
| Q1 2025 | 771.19 | 40.72 | 39.92 | −0.80 |
| Q2 2025 | 804.67 | 42.63 | 19.22 | −23.41 |
| Q3 2025 | 780.70 | 46.49 | 54.83 | +8.34 |
| Q4 2025 | 833.06 | 40.46 | 37.21 | −3.26 |
| Q1 2026 | 838.27 | 54.21 | 61.99 | +7.78 |
Source: DART consolidated statements. Single-quarter conversion is mine. Two internal checks held: the four 2025 quarters sum to KRW 170.30 billion of operating profit, matching the annual filing to the won, and the 2024 quarters sum to KRW 172.14 billion once the unrounded figures are used, likewise.
Read the far-right column on its own. Across those nine quarters the distance between net profit and operating profit averages KRW 17.07 billion in absolute terms ($12.1 million), while operating profit itself averages KRW 44.07 billion. The swing beneath the operating line runs at 38.74 percent of the operating line, by my calculation.
The two bolded rows are the sharpest version of it. Q3 2024 produced operating profit of KRW 52.26 billion and a net loss of KRW 6.45 billion, meaning KRW 58.71 billion ($41.5 million) drained away below. The very next quarter, Q4 2024, produced the year’s smallest operating profit at KRW 15.46 billion and the year’s largest net profit at KRW 47.78 billion. Measured at the operating line, Q3 was 3.38 times the size of Q4. Measured at the bottom, the ranking reverses completely, a swing of KRW 54.23 billion ($38.3 million).
Those quarters are consecutive. The tire business did not invert itself in six months. What sits underneath the tire business took a great deal out once and put a great deal back the next time, and I found no basis for calling either outcome the company’s own performance.
Nexen Tire Stock at 4.48 Times What
Which brings the argument back to the opening figure. What produced 4.48?
The Kiwoom data set carries earnings per share of KRW 1,448.66, and its own provenance field reads computed_price_div_per, which means the figure was recovered by dividing the price by the multiple. That is circular, so I reversed it myself. KRW 1,448.66 across 97,673,344 shares implies net profit of KRW 141.50 billion, which is KRW 9.68 billion (6.41 percent) below the KRW 151.17 billion consolidated net profit for FY2025. Controlling-interest profit would explain the difference; I could not confirm that it does.
The conclusion survives whichever figure I substitute. Using consolidated FY2025 net profit of KRW 151.17 billion ($106.8 million), earnings per share works out to KRW 1,547.74 and the multiple to 4.19. Using the trailing four quarters through Q1 2026, KRW 173.25 billion, earnings per share is KRW 1,773.75 and the multiple falls to 3.66. All three are cheap on their face.
Cheapness is not what I am stuck on. All three of those profit figures contain the KRW 47.06 billion item I walked down a moment ago. Money the business made and money the lines beneath it made are added together, divided across the share count, and divided again into the price to produce 4.48. I cannot separate the operating portion from the rest inside that sum, and without separating them I cannot say what the multiple is a price for.
This is a different objection from “the figure has not settled yet.” FY2025 net profit of KRW 151.17 billion is audited and final. The problem is composition. Nothing here is unsettled. It is also different from a company whose profit is split across too many business units to buy the one unit you want, which is the situation I described in an earlier piece on a Korean cosmetics manufacturer. There, everything mixed together was still business. Here, the larger part of what is mixed in is not.
The Quarter That Arrived With One Figure Missing
What the company published, and what it did not
Second-quarter results came out on Wednesday, July 29, 2026: revenue of KRW 891.3 billion ($629.6 million) and operating profit of KRW 34.3 billion ($24.2 million). Against the same quarter of 2025 that is revenue up 10.77 percent and operating profit down 19.54 percent; against the immediately preceding quarter, revenue up 6.33 percent and operating profit down 36.73 percent, by my calculation. Operating margin came in at 3.85 percent.
Net profit is absent. The company release, and the Korean press coverage I read of it, carry two lines only. What that missing line means at this particular company is exactly what the nine-quarter table establishes. Had I looked at Q3 2024’s operating profit of KRW 52.26 billion and inferred the bottom line from it, I would have been wrong by KRW 58.71 billion.
There was a genuinely strong element too. European revenue reached KRW 407.2 billion ($287.6 million), clearing KRW 400 billion in a single quarter for the first time, on original-equipment supply gains and expansion into the United Kingdom and Turkey.
Tariffs landing on two continents at once
Management gave three reasons for the profit decline: raw material inflation tied to Middle East conflict, higher ocean freight rates, and a one-time charge for the difference between the preliminary and final United States anti-dumping determinations.
That third reason sits precisely on the border my argument runs along. Kiwoom Securities analyst Shin Yun-chul put the final anti-dumping rate at 8.02 percent against a preliminary 5.57 percent, with a retroactive one-time cost of KRW 14 billion ($9.9 million). The European Union has begun applying a 24.4 percent anti-dumping duty to China-origin volumes, and a separate 15 percent United States product tariff applies on top. Whether that KRW 14 billion landed in cost of goods sold, reducing operating profit, or below the operating line as a non-operating charge, I could not establish. Management presented it as a cause of the operating decline, which points upward, but confirmation waits on the semi-annual filing.
The company has no United States plant. It manufactures in Korea (Yangsan and Changnyeong), China (Qingdao) and the Czech Republic (Zatec), and North America accounts for 23 percent of sales against Europe’s 35 percent. In that same reporting, the company said it could not reasonably estimate the effect of United States tariffs on its future financial statements. When a company declines to estimate an item, I have no way to compress that item into a single multiple.
Goodyear Prints Six Lines
To see how a different company handles the same anatomy, I opened The Goodyear Tire & Rubber Company (Nasdaq: GT). I chose it because it is already living at the far end of my own argument. Placing performance figures beside each other was never the point.
Goodyear’s second quarter, reported on Wednesday, August 5, 2026, showed net sales of $4.25 billion, down 4.8 percent, segment operating income of $36 million against $159 million a year earlier, and a net loss of $204 million. The distance between segment operating income and the net loss is $240 million, which is 6.67 times the operating income, by my calculation.
The part that matters is what comes next. Goodyear prints the intervening lines in the release itself: rationalizations of $29 million, interest expense of $105 million, other expense of $22 million, a $17 million gain on asset sales, income tax of $46 million, and $3 million of minority shareholders’ loss. Six lines. I could not close the walk from segment operating income to the net loss exactly with them; roughly $58 million remains unaccounted for, which I believe reflects corporate costs excluded from the segment measure, though the release alone did not let me confirm it. The point holds anyway. When six lines are printed, you can ask what the remainder is. When one line is printed, there is nothing to ask about.
Goodyear has no price-to-earnings ratio at all, because its earnings are negative. The market gave up measuring this company with a multiple some time ago and reads the six lines instead. That is the same work I am trying to do here. The difference at Nexen Tire is that the multiple exists and looks inexpensive, and I think that difference makes it the more dangerous of the two.
What Korean Sell-Side Says About Nexen Tire Stock
Coverage exists and it runs against me. I did not open a single original report; everything below reached me through Korean secondary reporting, and I am flagging that instead of implying I read the notes.
| House and analyst | Valuation | Estimates and reasoning |
|---|---|---|
| LS Securities, Lee Byung-keun | Assigned a KRW 9,400 ($6.64) valuation | FY2026 revenue KRW 3.44 trillion ($2.43 billion) and operating profit KRW 177.0 billion ($125.0 million); FY2027 operating profit KRW 244.0 billion ($172.4 million), up 37.9 percent. Winter-tire season in Q3, a 5 percent European price increase from June, raw material relief from Q4 |
| Kiwoom Securities, Shin Yun-chul | Cut from KRW 12,500 to KRW 10,500 ($7.42), down 16.0 percent | United States and European tariff burdens arriving together; FY2026 operating profit estimate reduced 17 percent; single-digit operating margin now seen as out of reach |
| Hyundai Motor Securities, Jang Moon-soo February 5, 2026 (Thu) |
Raised from KRW 7,500 to KRW 9,600 ($6.78) | FY2026 revenue KRW 3.3 trillion with a high single-digit operating margin; investment returns becoming visible, mix improvement and replacement-channel expansion cited as the basis for calling 2026 a recovery year |
Sources, all Korean-language secondary coverage: Etoday on LS Securities · Etoday on Kiwoom Securities · Investing.com Korea on Hyundai Motor Securities.
One arithmetic observation before moving on. The LS Securities FY2026 operating profit estimate of KRW 177.0 billion is KRW 0.02 billion away from exactly doubling the first half already on the record, KRW 88.51 billion (Q1’s 54.21 plus Q2’s 34.3), which doubles to KRW 177.02 billion by my calculation. The estimate holds if the second half simply repeats the first. That may be coincidence, and since I did not read the note I cannot say how the figure was actually built. Set beside the same note’s case for a seasonal third quarter, a price increase and falling input costs, though, it does leave me unable to say how much of that improvement the estimate already contains.
All three houses forecast operating profit only. None of the coverage I read carried a net profit estimate or any view on the non-operating lines. The forward fields in the indicator database I use, covering forward earnings per share, forward multiples and peer multiples, are all empty.
Figures I Left Out
Material I gathered and deliberately kept out of the argument, with the reason in each case.
How the debt ratio improved
The debt-to-equity ratio fell from 148.27 percent at the end of 2023 to 126.52 percent at Q1 2026, a move of 21.75 points. Total liabilities over that stretch rose from KRW 2,527.78 billion to KRW 2,714.07 billion, an increase of KRW 186.29 billion, or 7.37 percent. The improvement came from equity growing from KRW 1,704.88 billion to KRW 2,145.12 billion, up KRW 440.24 billion or 25.82 percent, all by my calculation from DART consolidated filings. Interesting, but I have written about leverage optics that diverge from leverage reality before, and it is not this article’s argument.
Four years of capital spending against four years of profit
Capital expenditure from 2022 through 2025 totals KRW 1,023.46 billion; operating profit over the same four years totals KRW 475.17 billion. Investment ran at 2.15 times cumulative operating profit. Free cash flow in Q1 2026 was still negative at KRW 6.96 billion. A cash-flow-led piece already exists in this series, so I am recording the figures without building on them.
The benchmark that changes answer depending on the weighting
Over the 244 trading days from August 11, 2025 (Mon) to August 11, 2026 (Tue), the stock returned 10.14 percent while KOSPI returned 97.88 percent, a shortfall of 87.74 points. The auto-parts sector on an equal-weighted, self-excluded basis returned 0.73 percent, making the stock 9.41 points better than its sector; switch to capitalization weighting and the sector returns 38.93 percent, putting the stock 28.80 points behind. It ranks 30th of 147 constituents, in the top 20.4 percent, against a sector median of −8.79 percent, with beta of 0.293 and correlation of 0.374. A verdict that flips with the weighting method is precisely the structure my previous piece was built on, so having the material here is not a reason to use it again one article later.
One check I ran that did not close
Paid-in capital of KRW 50.8 billion divided by 97,673,344 shares gives KRW 520.10, which is not a standard par value. At a KRW 500 par the share count implies KRW 48.84 billion, leaving KRW 1.96 billion, equivalent to 3,926,656 shares, unexplained. Preferred shares would account for it cleanly and I could not verify that they exist. No stock split or bonus issue appears in the record and the split flag in my data reads false, so nothing here disturbs the per-share arithmetic used above. I also discarded the payout-ratio field, which reports 13.8 against a raw value of 30.1, and the three-year revenue growth field.
My Position on Nexen Tire Stock
One sentence is the thing I keep returning to while writing this: the multiple is only as good as the earnings it is built on.
So here are twelve reasons the argument above may be wrong, and the twelfth is the one I take most seriously.
- All three covering houses sit above the market. LS Securities at KRW 9,400, Hyundai Motor Securities at KRW 9,600, Kiwoom Securities at KRW 10,500, against a KRW 6,490 close.
- Operating profit itself is recovering. Q1 2026’s KRW 54.21 billion is the highest in seven quarters, beaten in the table only by Q2 2024’s KRW 62.86 billion, and it is the largest first quarter shown.
- Revenue has risen four years running: KRW 2,597.42 billion, 2,701.72 billion, 2,847.93 billion, 3,189.61 billion.
- The fact that non-operating items move both ways may mean they average out. Summed across all nine quarters, cumulative net profit does not diverge dramatically from cumulative operating profit.
- Europe just cleared KRW 400 billion in a quarter for the first time, and the Czech second-phase expansion is not yet contributing a full period.
- The largest tariff item is retroactive and non-recurring. If the KRW 14 billion Kiwoom Securities identified is genuinely one-time, it is absent from Q3 onward.
- Price to book of 0.33 is low regardless of how the earnings argument resolves, against net asset value per share of KRW 19,707.
- The seven-factor screening checklist I use scores this 86, or six of seven, with only return on equity at 7.7 percent falling short.
- The dividend has increased three years running: KRW 100, 115, 130, 200. The FY2025 payout of KRW 19.54 billion is 12.92 percent of consolidated net profit, so there is room left.
- What I have been calling “outside the business” may be recurring. Equity-method income or rental income arriving every quarter would be part of this company’s earning power and should be counted as such.
- The KRW 47.06 billion is a floor I constructed. No filing discloses it. It comes from an extreme zero-tax assumption and the real composition may look quite different.
- And the heaviest one: my entire case rests on treating non-operating results as separate from the business. Currency movement and interest cost are direct consequences of this company deciding to manufacture in China and the Czech Republic while borrowing to do it. Read that way, those lines are not outside the business at all; they are how the business is built, and I have not fully answered that objection.
My position is one sentence: when a company’s earnings are made outside its business, I do not use a multiple built from those earnings, and if I cannot use the multiple then I cannot say whether the shares are cheap or expensive, which means I stay on watch.
What I will do instead is specific. The next time I open this company I am not looking at the multiple column. I am opening one page of the semi-annual filing, the detail of non-operating income and expense. Friday, August 14, 2026 is the statutory deadline for that filing. First-half net profit and the identity of the roughly KRW 47 billion that arrived in the first quarter are what I am there for. If that item recurs every period, the multiple becomes usable again. If it behaves like translation gains, price-to-earnings stays unavailable at this company for as long as that remains true.
What would break my thesis. If the semi-annual detail shows that most of the first-quarter amount is recurring, operations-linked income of the equity-method or rental variety, then my classification of it as outside the business was simply wrong. In that case I do not adjust the counter-arguments; I discard the article’s argument.
There is one word I have not used anywhere in this piece, and its absence is deliberate: cheap. At 4.48 times, or 4.19, or 3.66, it would have been the easiest word available, and I could not earn it.
a recent piece on a Korean steelmaker
Financial figures here follow DART consolidated filings (the Q1 2026 report filed May 15, 2026, and the FY2025 annual report filed March 18, 2026) together with Kiwoom Securities data; single-quarter values and ratios are my own derivations where labeled. Second-quarter 2026 figures rest on Korean press coverage of the company release and were not checked against the semi-annual filing, which had not been published. Where Korean-language reporting is the source, I have said so, and I paraphrase instead of presenting translated wording as an original quotation. Comparisons to the sector-benchmark problem I worked through in a previous article are noted where they arise.