iM Financial Group Interest Income: What Stayed With Shareholders
When I open a bank holding company, which line do I look at first? For years my answer was the one at the bottom, the profit line, and when I opened iM Financial stock I did the same thing. This time I reversed the order and started with what the company paid out.
In 2025 this company paid 2.1485 trillion won of interest, which is about USD 1.5817 billion at the September 23, 2026 rate of 1,358.4 won per dollar. In the same year the profit attributable to owners of the parent was 443.9 billion won, about USD 326.79 million. What went out was 4.8401 times what stayed. I sat with those two figures for a while before I looked at anything else.

Contents
What iM Financial stock is attached to, in the plainest terms I can manage
iM Financial Group trades on the Korea Exchange main board, the KOSPI, under the code 139130. The KOSPI is the senior of Korea’s two domestic boards; the junior one, KOSDAQ, carries smaller and earlier-stage issuers. The screening tool I use files this company under the industry string “banks,” and that string matters to me for a reason unrelated to analysis: it is how I avoid writing about two companies from the same bucket in the same week.
Until 2016 the group traded as DGB Financial Group and its main subsidiary was Daegu Bank, a regional lender in Korea’s southeast. The bank now operates as iM Bank, and three smaller units sit beside it: iM Securities, iM Capital and iM Life, a life insurer.
The September 23, 2026 close was 17,910 won, down 90 won or 0.5000 percent from the prior session’s 18,000 won. I use that date because September 24 and 25 were Korean holiday closures and September 26 is a Saturday, so the last session with real trading was the 23rd. Shares outstanding are 158,364,042. Multiply the two and you get 2,836,299,992,220 won. The tool’s market value field reads 2.8363 trillion won, so the multiplication closes.
Three years of interest behind iM Financial stock, and what stayed with the owners
Here is the raw material. From the consolidated statements filed with Korea’s Financial Supervisory Service, the interest expense line reads 2.39176 trillion won for 2023, 2.488889 trillion won for 2024 and 2.148536 trillion won for 2025. The first six months of 2026 carry 1.065079 trillion won.
Add the three full years and the total is 7.029185 trillion won. Owner profit for the same three years was 387.838 billion, 214.876 billion and 443.903 billion won, which totals 1.046617 trillion won. Divide 7,029,185 by 1,046,617 and the answer is 6.7161. Over three years this company sent out roughly six and three quarters times as much in interest as it kept for its owners.
A banker would say that is the business working as designed. Deposits are a liability and liabilities carry a price. I agree. My objection is narrower: when a line is obviously large, people stop measuring it, and then nobody knows how much it moves.
Dividing the interest by the liabilities it sits on
Interest expense grows when the balance sheet grows, so the absolute figure tells me almost nothing on its own. It has to be divided, and what belongs underneath is the thing interest is charged on, which is total liabilities.
| Period | Interest expense (million won) | Period-end total liabilities (million won) | Cost rate |
|---|---|---|---|
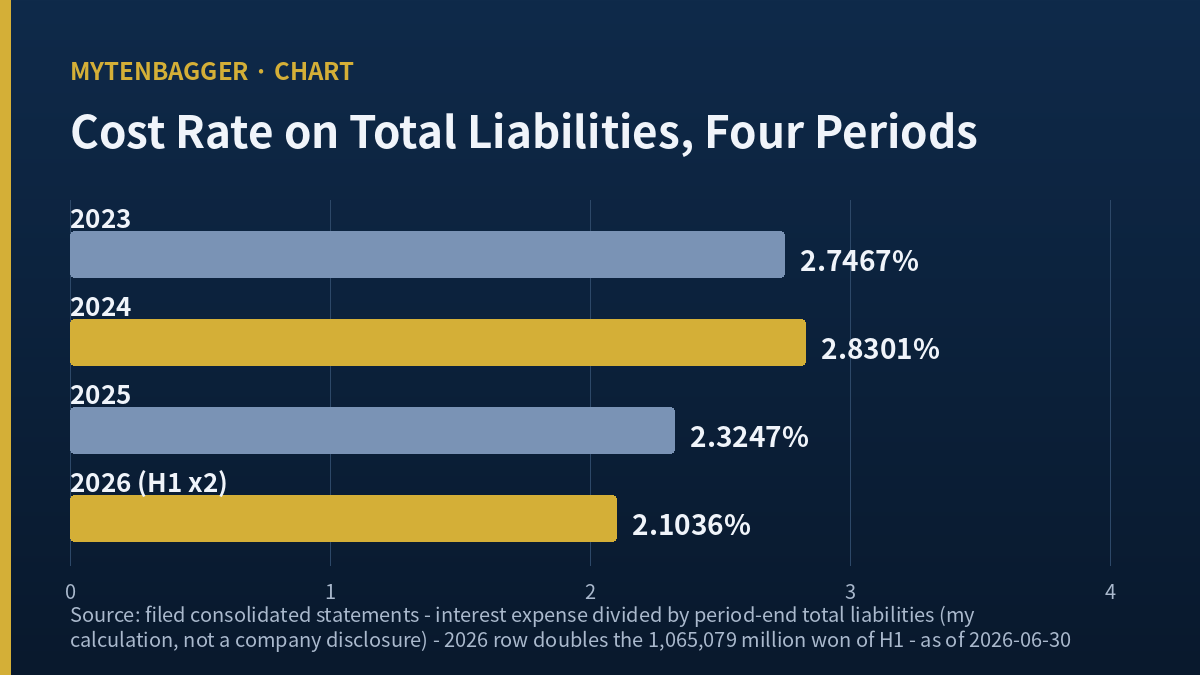
| 2023 | 2,391,760 | 87,076,229 | 2.7467% |
| 2024 | 2,488,889 | 87,942,881 | 2.8301% |
| 2025 | 2,148,536 | 92,423,945 | 2.3247% |
| First half of 2026, doubled | 2,130,158 | 101,264,355 | 2.1036% |
Interest expense and total liabilities are filed consolidated figures. The cost rate is mine, not a company disclosure. The 2026 row doubles the 1,065,079 million won reported for the first six months, which assumes the back six months look like the front six.
The four figures run 2.7467, then up to 2.8301, then down to 2.3247 and down again to 2.1036. The gap between the 2024 peak and where the company sits now is 0.726558 percentage points, which is 2.830120 less 2.103562.
Why period-end balances, and what that choice costs me
I divided by the balance standing at each period end. Korean banks report funding cost against average balances, and in a company whose liabilities grew steadily through the year, a period-end divisor produces a smaller ratio than an average-balance one. Total liabilities at June 30, 2026 were 8.840410 trillion won above the December 31, 2025 figure. So my 2.1036 percent would be somewhat higher on an average-balance basis. I know the direction and I do not know the size.
There is a second thing I left alone. The screening tool prints 8.0410 trillion won in a field labeled revenue for this company. I used it nowhere. The tool does not say what that field contains for a financial institution, and I have now seen nine issuers where the same family of fields carried a prior full-year figure while being presented as a trailing four-quarter one. An unverified figure on top of a verified interest expense would produce a ratio I could not defend.
One rate slice under iM Financial stock, multiplied by 101 trillion won
Now the part that made me write the entry. A move of 0.726558 percentage points reads as small. It is not even a full percent, and the interesting digits are past the decimal point. But total liabilities at June 30, 2026 stood at 101.264355 trillion won, about USD 74.55 billion. Small ratios meet large balances and stop being small.
Multiply 0.726558 percent by 101,264,355 million won and the product is 735,744.69 million won, or 735.7 billion won, about USD 541.63 million. Divide that by 2025 owner profit of 443,903 million won and the answer is 1.657445.
In a sentence: if the cost rate went back to where it was in 2024, the extra annual outflow on the June 30, 2026 liabilities would be 1.66 times what the owners earned in all of 2025. Read the other way, the move from 2024 to now has already spared this company more than a full year of its own profit.
When I worked through what one won of assets earns at JB Financial, the thing that held me was a figure that would not move. Here it is the opposite. A ratio that wobbles in the third decimal place, passed through a balance sheet of that size, comes out larger than the entire profit line.
This is the part that multiples on iM Financial stock do not carry. Whether a bank trades at six times earnings or eight is a conversation that starts after earnings are settled. At this company one of the inputs that settles earnings is moving in the third decimal place, and its movement is bigger than the output.
The comparison I keep reaching for is the funding arithmetic at Samsung Card, where I worked out how far a card issuer’s borrowing cost had actually moved. There my question was the size of the move. Here the move is a means to something else: what it is worth once a balance sheet multiplies it.
The line I could not open, and where another bank prints it
Then I got stuck. On iM Financial stock I have three years of interest expense and zero years of interest income. Pulling this company’s consolidated income statement through the filing database returns an empty revenue field and no separate interest income account. One line of the pair is visible to me and the other is not.
So what I can state about this company is a floor, not a value. If profit is positive and interest expense is 2.1485 trillion won, then interest income is larger than that. How much larger I do not know.
I wanted to know whether the missing line is missing in principle or missing from my route, so I opened a comparable filer. Old National Bancorp is a US regional bank holding company listed on Nasdaq. Its annual income statement prints Total Interest Income and Total Interest Expense as two separate lines. For fiscal 2025 the first reads USD 3,270 million and the second USD 1,212 million.
I am not putting the two companies side by side. Their fiscal calendars, currencies and sizes differ, and you will not find either company’s profit, multiples or market value set against the other’s anywhere in this entry. The peer is here to answer one question: does a bank of this kind publish the line I could not find? It does. My route is the problem, not the accounting.
One more thing came out of that check. Two pages on the same data provider print the same company’s fiscal 2025 net income as USD 653.12 million on one and USD 669.26 million on the other. That is why I took only the two interest lines from it. When I traced the book value gap at BNK Financial I worked the same way: a figure that does not close inside its own source does not go into the entry.

Two book values for iM Financial stock, and the buyback behind them
Before writing any multiple I hit a problem. The screening tool prints book value per share of 38,725 won, and I could not rebuild that figure from any date in the filings.
Equity attributable to owners of the parent runs 6.227011 trillion won at September 30, 2025, then 6.220133 trillion at December 31, 2025, then 6.218083 trillion at March 31, 2026, then 6.371155 trillion at June 30, 2026. Divide any of those four by 158,364,042 shares and 38,725 does not appear. The closest, the December figure, gives 39,277 won.
So I worked backwards. Dividing 6,220,133 million won by 38,725 implies 160,623,189 shares, which is 2,259,147 more than the company carried on September 23, 2026. Looking for that difference took me to the July 27, 2026 earnings coverage. In the first six months of 2026 the group spent 39.94 billion won buying 2,261,175 common shares, to be retired within one month of the trust contract closing.
Add 2,261,175 to 158,364,042 and you get 160,625,217 shares. Divide December’s owner equity by that and the result is 38,724.51 won, which rounds to 38,725. The figure I could not build now closes.
So the printed book value per share appears to be December 2025 equity over a pre-retirement share count. I will not call that the formula, because 2,259,147 and 2,261,175 differ by 2,028 shares and I did not confirm the two are the same event. What I have is a combination that closes, which is a weaker claim than a rule.
Which is why the multiples here are mine
June 30, 2026 owner equity of 6,371,155 million won over 158,364,042 shares is 40,231.07 won per share. The 17,910 won close over that is 0.4452 times book. The tool’s 0.46 is 17,910 over 38,725, or 0.4625. The two differ, and both sit below one, so the statement that the market pays less than book survives either way.
I built the earnings multiple too. Discrete owner profit for the four quarters from the third of 2025 through the second of 2026 adds to 430,229 million won, or 2,716.71 won per share, which puts the close at 6.5925 times. The tool prints 6.64. They are close, and I am using mine.
| Subsidiary, first half of 2026 | Net profit (billion won) | Share of consolidated owner profit of 295.581 billion won | Note |
|---|---|---|---|
| iM Bank | 245.7 | 83.1245% | Won lending balance passed 60 trillion won |
| iM Securities | 44.9 | 15.1904% | Separate basis |
| iM Capital | 39.5 | 13.3627% | Operating assets grew 13.9% |
| iM Life | 18.2 | 6.1573% | The only one of the four that grew |
Subsidiary figures come from Korean press coverage of the July 27, 2026 results; the share column is my division. The company published two year-on-year directions, iM Bank down 4.2 percent and iM Life up 31.9 percent, but the prior-year amounts were not in that coverage, so I could not check either one. The four add to 348.3 billion won against consolidated owner profit of 295.581 billion won, a difference of 52.719 billion won. Holding-company items and consolidation adjustments sit in between, and I did not open that breakdown.
Three brokers, and four objections with the work each would give me
I found three named Korean sell-side views. Yuanta Securities published a 26,000 won valuation on July 29. Heungkuk Securities analyst Yoo Jun-seok published 25,000 won on July 28. LS Securities analyst Jeon Bae-seung published 22,000 won on August 4. Their reasoning runs along similar lines: net interest margin improving in the back half of the year, lending mix moving toward the capital region and higher-quality credit, and shareholder returns rising. LS put the total payout ratio going from 38.8 percent last year to 43.3 percent this year, and described the shareholder return yield as 8 percent.
None of the three writes about the place where I have been working. Net interest margin is what remains after both interest lines net off; I pulled one of those lines out on its own and multiplied it by a balance. We are looking at the same company from different positions on it.
Now the other side. I have listed each objection with the work it would give me if it turns out to be right, because an objection I cannot act on is decoration.
Four objections and what each one would make me do
One. Falling interest expense means nothing if interest income falls faster. When rates come down, both lines come down, and I looked at one. If this is right, my work is to read the third-quarter filing with the company’s published net interest margin beside the interest expense line, and to discard the conversion in this entry if the two point in opposite directions.
Two. I used period-end balances and the company uses average balances. In a six-month stretch where liabilities grew 8.840410 trillion won, that difference is not cosmetic. If this is right, my work is to find the company’s own published average-balance funding cost and set it against each of my four figures. If any pair differs by more than 0.1 percentage points, the table gets rebuilt.
Three. Second-quarter profit came in under the market’s estimate. One outlet’s compiled estimate for the quarter was 155.5 billion won; actual owner profit was 141.07 billion won. Heungkuk also noted the quarter came in slightly below consensus. If profit keeps landing under estimates, then whatever is being saved on funding is leaving through some other line. My work there is to put the credit cost line next to the interest expense line and multiply it by the same balance.
Four. Capital is the binding constraint here. One report put the common equity tier one ratio at 11.99 percent in the first quarter before recovering to 12.27 percent for the first half, and tied further share retirement to that ratio and to regional economic conditions. If this is right, my work is to wait for the 30 billion won of second-half repurchases to be executed and see where the ratio lands. If it drops back under 12 percent, a shrinking share count leaves my list of reasons to watch this company.

Where I stand on iM Financial stock, and three things I check on November 16, 2026
My position on iM Financial stock is watching, with no shares held. A market value of 2.8363 trillion won, about USD 2.088 billion, sits outside the band where I take single-name positions, and I treat that band as something to observe. Nothing in this entry is a case for buying or selling.
Three markers. First, whether cumulative interest expense in the third-quarter filing exceeds 1.595245 trillion won, which is first-half expense of 1,065,079 million won plus the second quarter’s discrete 547,373 million won. A figure well above that line means the cost rate has stopped falling and the 1.66 times in this entry belongs to the past. Second, how much further total liabilities run beyond 101.264355 trillion won, because a larger balance turns the same ratio into a larger sum. Third, whether the second-half repurchase is executed and the share count drops below 158,364,042.
The statutory filing deadline is November 16, 2026. Every figure here is due for a rebuild after that date.
The thing I decided against doing
I decided against estimating this company’s interest income. The method was sitting there. At the US regional bank I opened, interest expense was 37.0642 percent of interest income; apply the same ratio here and this company’s interest income comes out near 5.7968 trillion won. That takes thirty seconds, and putting it in would have made the entry feel finished.
But it would not be this company’s figure. It is a ratio borrowed from another country, another rate regime and another asset mix, and all I verified is that one bank ran at that ratio for one year. The moment a gap is filled with something plausible, a reader loses the ability to tell what I checked from what I made. I would keep the gap before I would lose that distinction.
So interest income stays empty here. What I can say is that the empty line is larger than 2.1485 trillion won, and that the line underneath it moves in the third decimal place while carrying a full year of profit on its back. Those two sentences hold no matter which way the third-quarter figures land, which is why they are the ones I would defend.
Figures I gathered and left out
For 2024 the consolidated net profit of 201.560 billion won was smaller than the owner profit of 214.876 billion won. That is a real and unusual fact about the year, and I left it alone because several recent entries in this series have already worked that same seam. Quarterly operating cash flow flipped sign five times across ten quarters, which I also left out. The dividend is 700 won per share, a 3.9084 percent yield at the close, with a filed eight-year record running between 360 and 700 won; dividend-led entries are well covered here already. The close sits at 81.4091 percent of the 250-session high of 22,000 won and 37.2414 percent above the 250-session low of 13,050 won, and foreign ownership is 44.91 percent. None of those carried the argument, so none of them appear in it.
Sources, so the arithmetic can be redone. Financial figures come from the consolidated account query at Korea’s Financial Supervisory Service filing system, with the second quarter of 2026 as the most recent period. Price, share count and the industry string come from a Korean market data tool carrying Kiwoom data, on the September 23, 2026 close. First-half results and the buyback detail come from Money Today’s July 27 report, translated by me from the Korean. Capital ratios and the three-group comparison come from Bloter. The Heungkuk view comes from Money Today’s July 28 piece and the LS view from Asia Economy’s August 4 piece; both are Korean sell-side commentary as relayed by Korean press. The two interest lines for the US comparison come from Stock Analysis. The exchange rate of 1,358.4 won per dollar is the September 23, 2026 Seoul onshore daytime close, confirmed at Money Today, Steel and Metal News and KB Think (rate date: 2026-09-23).
Related reading