KEPCO KPS Earnings vs Cash Flow: Four Years That Rank Differently
Contents
Two Rankings of the Same Four Years of KEPCO KPS Stock
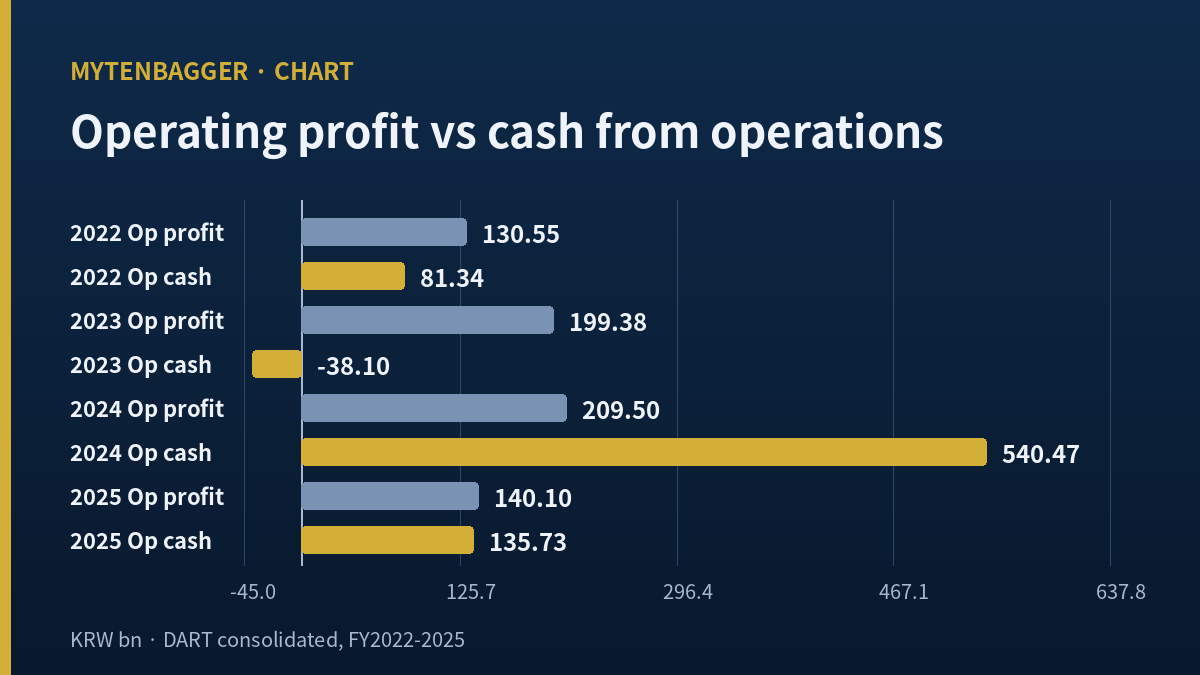
Rank the last four fiscal years of KEPCO KPS by operating profit and the order comes out 2024, 2023, 2025, 2022. Rank the identical four years by cash generated from operations and the order comes out 2024, 2025, 2022, 2023. The year that sits second on the first list sits last on the second, and on the second list it carries a minus sign.
That mismatch is what I have been sitting with. This piece is a record of how far I got measuring the distance between what this company earns and when that money shows up.
All prices reference the August 12, 2026 (Wednesday) close of ₩45,400 ($32.07). I am writing before the Seoul market opens on Thursday, so that is the most recent settled session. Financial figures come from consolidated statements filed with Korea’s DART electronic disclosure system, cross-checked against a Kiwoom Securities data screen.
Seventeen quarters, written as two strings of signs. Top row is operating profit. Bottom row is cash from operations.
+ + + + + + + + + + + + + + + + +
+ − + + + + − − + + + + + + + + −
Q1 2022 through Q1 2026, left to right. Operating profit: seventeen out of seventeen positive. Cash from operations: four negative. I want to see those two rows agree before I pay a multiple for either.
KEPCO KPS Stock Numbers Recomputed at the August 12 Close
KEPCO KPS trades on the KOSPI, the senior board of the Korea Exchange, under ticker 051600. The KOSPI is Korea’s main-board index, roughly analogous in role to the NYSE composite; the smaller-cap KOSDAQ board sits alongside it. This is a mid-cap name by Korean standards and a small-cap name by American ones.
| Item | Value | Basis |
|---|---|---|
| Close | $32.07 (₩45,400) | Aug 12, 2026 (Wed), Kiwoom daily bar |
| Market capitalization | $1.443bn (₩2.043tn) | 45,400 × 45,000,000 shares, by my calculation |
| Trailing P/E | 16.45x | 45,400 ÷ EPS ₩2,760.48, by my calculation |
| Price-to-book | 1.52x | 45,400 ÷ BPS ₩29,906, by my calculation |
| Return on equity | 9.23% | DART consolidated, FY2025 |
| Operating margin | 8.89% | DART consolidated, FY2025 |
| Debt-to-equity | 31.75% | DART consolidated, Q1 2026 |
| 250-day intraday high / low | $48.74 / $29.31 (₩69,000 / ₩41,500) | Kiwoom; now at 65.80% of the high, by my calculation |
| Drawdown on closing prices | −32.74% | From ₩67,500 on Mar 20, 2026 (Fri), by my calculation |
Why I recomputed the screen values
The Kiwoom screen showed a live price of ₩46,100. Pulling the daily bars gave ₩46,100 on Monday August 10, ₩45,700 on Tuesday August 11, and ₩45,400 on Wednesday August 12, so the vendor was anchored to Monday’s close. The market-cap field confirms it: 46,100 × 45,000,000 comes to ₩2,074,500,000,000, and the screen reads ₩2.0745tn to the won.
Every derived figure that screen publishes alongside the price is therefore anchored to Monday too, and I did not use any of them. The 65.80% and −32.74% in the table above are recomputed at Wednesday’s close. When a piece mixes a price from one day with ratios from another, none of the numbers in it can be trusted afterward.
Share count checks out as well. Paid-in capital of ₩9.0bn divided by 45,000,000 shares gives exactly ₩200.00 per share, and 200 × 45,000,000 returns ₩9.0bn. Par value ₩200, no preferred class, no rights issue, split, or buyback cancellation disclosed in the past six months. Every per-share figure here stands on one share count.
The Earnings Line Behind KEPCO KPS Stock Is Quiet
Take the profit side first. Operating profit ran ₩130.55bn ($92.2mn) in 2022, ₩199.38bn ($140.8mn) in 2023, ₩209.50bn ($148.0mn) in 2024, and ₩140.10bn ($99.0mn) in 2025. The gap between best and worst is ₩78.95bn, a ratio of 1.6047x by my calculation. Revenue over the same stretch went from ₩1,429.07bn to ₩1,576.52bn ($1.114bn).
Go down to single quarters and the picture holds. Across seventeen discrete quarters the largest operating profit was ₩74.40bn in Q2 2024 and the smallest was ₩7.80bn in Q1 2025, a band of ₩66.60bn ($47.0mn). All seventeen values fit inside it, and none of them is below zero.
What this piece is deliberately not about
There is a live story here about revenue and profit moving at different speeds. Second-quarter 2026 revenue fell 3.5% year on year while operating profit fell 33.6%. In the first quarter the same relationship ran the other way, revenue up 22.4% against operating profit up 374%. Divide one rate by the other and you get 9.60x and 16.70x, by my calculation.
I am leaving that alone. Operating leverage against revenue is a structure I have already put at the center of several recent pieces, and repeating it because the material happens to be sitting there turns the work into routine and stops it being observation. What I am measuring is the distance between profit and cash. The first pair lives entirely inside the income statement. The second pair sits on two separate financial statements, and only one of them is audited quarterly.
The Cash Line Is Not Quiet
Split the same seventeen quarters by discrete cash from operations and the top reading is ₩173.99bn ($122.9mn) in Q2 2024 against a bottom reading of −₩69.05bn (−$48.8mn) in Q4 2023. That is a band of ₩243.04bn ($171.7mn), or 3.6495x the profit band of ₩66.60bn, by my calculation.
| Fiscal year | Operating profit | Cash from operations | Cash ÷ profit (my calculation) |
|---|---|---|---|
| 2022 | $92.2mn | $57.5mn | 0.6231x |
| 2023 | $140.8mn | −$26.9mn | −0.1911x |
| 2024 | $148.0mn | $381.8mn | 2.5798x |
| 2025 | $99.0mn | $95.9mn | 0.9688x |
In 2023 the company reported close to ₩200bn of operating profit and still watched ₩38.1bn walk out the door on the operating line. The following year it earned a similar amount and took in ₩540.5bn. The distance between those two years is ₩578.57bn ($408.7mn), which is 7.3287x the full four-year spread of its operating profit, by my calculation. And in Q1 2026 it posted ₩37.02bn of operating profit alongside cash from operations of −₩9.14bn.
How this differs from the last two cash-flow pieces I wrote
I have built a thesis on the cash flow statement twice recently, and this is neither of those. In the Dongwon Industries piece the question was how much of the incoming operating cash gets consumed by capital expenditure on its way down to free cash flow. There the inflow was steady and the outflow was the problem.
The Taihan Electric Wire piece was about who funds growth, which is a financing question. This one is neither financing nor investing. Capital expenditure at KEPCO KPS ran between ₩37.9bn and ₩61.8bn across all four years, and debt-to-equity was 31.75% at the end of Q1. Nothing is wrong on the way out or on the way in from lenders. The question is only when the money the company has already earned actually arrives.
Why KEPCO KPS Stock Has One Customer Problem
A Kyobo Securities report by analyst Lee Sang-ho, dated May 15, 2026 (Friday), breaks first-quarter revenue into five segments: nuclear and pumped storage ₩149.9bn ($105.9mn), thermal ₩108.8bn ($76.9mn), overseas ₩36.0bn ($25.4mn), transmission and substation ₩27.5bn ($19.4mn), and external ₩30.2bn ($21.3mn). The five sum to ₩352.4bn, which matches the ₩352.39bn consolidated revenue on file.
Nuclear, thermal, and transmission together come to ₩286.2bn, or 81.21% of the total, by my calculation. Every won of that is ordered by Korea Hydro & Nuclear Power, by the KEPCO generation subsidiaries, or by KEPCO itself. What sits outside the group is the overseas and external lines, ₩66.2bn, 18.79%.
When four-fifths of a company’s revenue is ordered by one corporate family, the timing of that family’s payments writes this company’s cash flow statement. In the separate piece I wrote on KEPCO itself I framed the parent around two axes, tariffs and volume. Both of those also govern how much cash the parent has available to release downstream, and I did not expect to meet that consequence again on a subsidiary’s statements.
The Arithmetic the Second Quarter Left Behind
Second-quarter results landed on Tuesday, August 11, 2026: revenue ₩437.9bn ($309.3mn) and operating profit ₩43.6bn ($30.8mn), down 3.5% and 33.6% year on year. KB Securities analyst Jung Hye-jeong put the operating figure 30.1% below the ₩62.0bn consensus. Eugene Investment analyst Hwang Sung-hyun traced the miss to operating expenses rising 9% to ₩217.6bn, driven by temporary hiring and outsourcing during preventive maintenance outages where safety procedures had been tightened.
What the second half now has to deliver
Adding the reported second quarter to the filed first quarter puts first-half revenue at ₩790.29bn ($558.2mn) and first-half operating profit at ₩80.62bn ($56.9mn), both by my calculation, since the second quarter is not yet in a filed semi-annual report. Against ₩741.99bn and ₩73.42bn a year earlier, that is 6.51% and 9.81% higher. One quarter reads as a miss; six months read as growth.
The distance to the full-year estimates is where it gets interesting. KB Securities models ₩175.0bn ($123.6mn) of 2026 operating profit, Kyobo modeled ₩187.0bn in May, and Kiwoom Securities analyst Cho Jae-won has ₩180.0bn. Subtract the ₩80.62bn already banked and the second half needs to produce ₩94.38bn to ₩106.38bn, which is 1.1707x to 1.3196x the first half, by my calculation.
| Fiscal year | H1 operating profit | H2 operating profit | H2 ÷ H1 (my calculation) |
|---|---|---|---|
| 2022 | ₩51.06bn | ₩79.49bn | 1.5569x |
| 2023 | ₩103.76bn | ₩95.61bn | 0.9215x |
| 2024 | ₩126.64bn | ₩82.86bn | 0.6543x |
| 2025 | ₩73.42bn | ₩66.68bn | 0.9082x |
One year in four cleared 1.17x, and that was 2022, when the first half came in unusually low at ₩51.06bn. The consensus is asking this company to do something it has done once in four attempts, off a much higher base. I come back to that in the objections below.
What the Sell Side Did to KEPCO KPS Stock on August 11
The day after results, four houses marked their numbers down at once. Of the five below I opened one original document, the Kyobo report from May; the other four reached me through Korean press coverage and I have not read those notes directly.
| House · analyst | Date | Number on the page | Stated reasoning |
|---|---|---|---|
| KB Securities, Jung Hye-jeong | Aug 11, 2026 (Tue) | ₩66,000 ($46.62) | FY26 revenue ₩1,626bn, operating profit ₩175bn; Q3 outage completion and Saeul Unit 3 startup |
| Samsung Securities, Kim Young-ho | Aug 11, 2026 (Tue) | ₩67,800 → ₩57,000 ($40.26) | FY26 earnings estimate cut 9%; fixed-cost burden from collapsing external revenue |
| Eugene Investment, Hwang Sung-hyun | Aug 11, 2026 (Tue) | ₩55,000 ($38.85), marked down 18% | Q3 revenue ₩412bn and operating profit ₩51.6bn; normalization from Q3 |
| LS Securities, Sung Jong-hwa | Aug 11, 2026 (Tue) | Cut 10%, amount not reported | Coverage carried the percentage only |
| Kyobo Securities, Lee Sang-ho | May 15, 2026 (Fri) | ₩66,000 ($46.62), raised | Nuclear preventive-maintenance units rising from 13 in 2025 to 20 in 2026 |
Among the August 11 notes where an amount was reported, the highest and lowest are ₩66,000 and ₩55,000, a spread of 1.2000x by my calculation. Narrow. Nobody is arguing about direction. The two houses whose reasoning was carried in detail both expect normalization from the third quarter, and what came down was this year’s number while the thesis stayed where it was. The Kiwoom data screen still returns null for forward EPS, forward P/E, and peer multiple, so none of this reached me through a consensus feed.
The Global Peer I Used and the One Ratio I Took
I picked Quanta Services (NYSE: PWR) for this one, on the basis that it sells broadly the same thing into a customer base built the opposite way. One company draws four-fifths of revenue from a single corporate family; the other spreads across utilities, telecoms, and energy developers throughout North America.
Quanta’s second-quarter results, released Thursday, July 30, 2026, showed revenue of $9.556bn, operating income of $694.8mn at a 7.3% margin, and cash from operations of $1.095bn. Divide that cash figure by operating income and you get 1.5760x; on a six-month basis, $1.487bn ÷ $1.033bn gives 1.4395x, both by my calculation.
More to the point, Quanta published a range: it expects to convert $2.00bn to $2.50bn of free cash flow in 2026. KEPCO KPS publishes no annual cash guidance at all. It also has nobody to publish it to, in the sense that the timing depends on one counterparty instead of a diversified order book.
The comparison table I did not build
I did not put the two companies’ margins or multiples side by side. The scale difference is more than tenfold, the accounting frameworks differ, and a large share of Quanta’s revenue comes from new construction, with maintenance only part of the mix. What I took across was one thing only, the stability of the cash conversion ratio, and I am recording here that it was the only thing. I read the company’s press release and did not pull the 10-Q.
Fifteen Arguments Against My Own Position
- Korea Electric Power reported first-half operating profit of ₩4.9127tn on August 12, 2026. There is no evidence the paying customer is short of money right now.
- The Q1 2026 reading of −₩9.14bn may be pure seasonality. First quarters have run ₩154.6bn in 2024 and ₩14.6bn in 2025, so the reading is erratic to begin with.
- Having the parent as the customer delays collection, but it also means the orders do not go to a competitor. I am measuring only the unfavorable half of that structure.
- Q2 2026 operating margin was 9.96% by my calculation, above the 8.89% full-year 2025 figure. The word “miss” describes a gap to consensus and says nothing about the absolute level.
- Investment ratings reported in the press for three houses (KB, Eugene, and Kyobo) are all buy equivalents, and the four disclosed amounts run ₩55,000 to ₩66,000, every one above the August 12 close.
- A Czech contract for Dukovany Units 5 and 6 maintenance has been reported as likely in the second half. If the 18% outside the group grows, my premise weakens.
- A ₩485bn ($342.6mn) pressure-tube replacement contract at Romania’s Cernavoda Unit 1 starts contributing revenue from Q4 2026, per Korean press.
- Nuclear preventive-maintenance units are estimated by Kyobo to rise from 13 in 2025 to 20 in 2026. The revenue base itself is expanding.
- The dividend has never been suspended. Within the range I checked, 2018 through 2025, it has been paid in eight consecutive years, most recently ₩1,651 ($1.17) per share for fiscal 2025.
- Debt-to-equity is 31.75% and interest coverage was 225.72x in Q1 (₩37.02bn ÷ ₩0.164bn, by my calculation). Late cash does not threaten solvency here.
- Summed across four years, cash from operations totals ₩719.44bn ($508.2mn) against ₩679.53bn ($480.0mn) of operating profit, by my calculation. Over a long enough window there is no mismatch at all.
- The 2023 negative and the 2024 surge are probably two halves of one event. If so this is a single delay, dressed up as two outliers.
- Cash volatility may simply be the normal seasonality of an outage-driven maintenance business, where work concentrates in particular quarters.
- My second-quarter figures came from press coverage ahead of any filed report, and the ₩80.62bn first-half number is my own addition on top of them.
- My four-year sample is a window I chose. Extend it to six years or eight and the two rankings might line up. I have no principled answer for why four.
Owning the Parent and the Subsidiary at the Same Time
The overlap that actually matters here is easy to miss on a screen. This company’s dominant customer, Korea Electric Power, is itself listed on the same exchange, and on the NYSE as an ADR. An investor who already owns the parent and then adds the maintenance subsidiary has bought the same disbursement cycle twice, once as the entity deciding when to pay and once as the entity waiting to be paid. Those two positions look diversified on a screen. On the cash flow statement they are the two ends of one transaction.
Values I checked and left out
The dividend of ₩1,651 per share was declared on Monday, March 16, 2026. Total distribution works out to ₩74.30bn and a payout ratio of 59.79% against ₩124.25bn of 2025 net income, by my calculation, down 33.13% from ₩2,469 the prior year. The vendor screen carries two payout figures, 59.8 and 47.9, so I recomputed instead of quoting either.
Over the 243 trading sessions from August 12, 2025 to Tuesday, August 11, 2026, the stock fell 13.28% while the KOSPI rose 98.93% and the equal-weighted electric utilities sector, excluding this name, fell 2.90%. The sector-versus-stock split assigns 90.7% of the underperformance to the sector and the remainder to the company. I left the sector percentile out entirely: the aggregation covers five names, and a fourth-place finish among five carries no information.
Also checked and unused: beta of 0.41 against correlation of 0.404, price-to-sales of 1.32x, inventory of ₩24.21bn at 6.3 days, foreign ownership of 9.01%, and margin balance of 0.64%. The screen’s EBITDA field reads ₩37.02bn, identical to Q1 2026 operating profit down to the won, so I treated it as a copied value and dropped it.
KEPCO Engineering, Hyundai E&C piece
Where I Stand on KEPCO KPS Stock and the Sentence That Would Move Me
I am only watching KEPCO KPS stock. That is not a verdict on earnings. Seventeen profitable quarters in a row is not something I get to complain about.
What stops me is that the company does not control the sequence in which those earnings become money. To put a multiple on a business I need some rough sense of what arrives each quarter, and after laying out four years I still cannot say whether the next reading will be positive or negative. Four negatives out of seventeen does not convert into a probability, because the timing of those four was decided somewhere I cannot see.
So the condition is this. On Friday, August 14, 2026 I read the first-half cash from operations in the semi-annual report. Then I wait for the third and fourth quarters and check whether the annual cash figure starts landing in the same rank position as the annual operating profit. The specific test is written out below.
What would break my thesis
Once 2026 and 2027 are both closed, I rank six fiscal years by operating profit and six by cash from operations. If the two orderings match completely, I drop this thesis. Matching rankings would mean the arrival of cash has recovered a rule, and the reason I am only watching disappears with it.
If the orderings disagree again, what I revise is not the thesis but my method for this company. In that case I stop leading with a multiple and start by writing down the yearly spread of cash arrivals.
Let me put the falsifying sentence on the page now, so I recognize it when it shows up. It will read something close to: “H1 2026 cash from operations: ₩130bn, in line with H1 operating profit.” That sentence does not exist yet. I have written it out here because the version of me who reads the August 14 filing will be looking for reasons to feel clever, and it is easier to check a sentence I drafted in advance than to grade my own reaction on the day.
Prices and multiples reflect the August 12, 2026 close as checked at the time of writing. Second-quarter 2026 results are press-reported ahead of the semi-annual filing, and the first-half totals are my own additions on top of them. USD conversions are approximate, at roughly ₩1,415.7 per dollar on the same date, per the Seoul foreign exchange market close.