SKC Rights Offering Covers 38% of Three Years of Cash Burn
I did one piece of arithmetic on SKC stock before I read anything else about the company. In June 2026 SKC took in ₩1,167.1 billion (about $822.7 million) from a rights issue. Across 2022, 2023 and 2024 the same company’s free cash flow added up to minus ₩3,029.8 billion (about $2.14 billion). The new money covers 38.52 percent of what the previous three years consumed. That single ratio is why I opened this name at all, and it framed everything I looked at afterwards.
SKC (KOSPI: 011790) is a Korean materials group listed on the Korea Composite Stock Price Index, the main board of the Korea Exchange, which is the larger of Korea’s two equity markets and the one that carries most of the country’s industrial names. SKC makes propylene-oxide chemicals, semiconductor materials, and electrodeposited copper foil for lithium batteries through its subsidiary SK Nexilis, and it is building a glass-substrate business for semiconductor packaging. As of the close on Friday, August 14, 2026, the stock was ₩89,800 (about $63.30) and the market value was ₩4,453.9 billion (about $3.14 billion).
The June money, applied to three figures my screen still shows without it
| Figure | On my screen | With the raise applied | Gap |
|---|---|---|---|
| Shares outstanding | 49,597,996 | 49,597,996 | none; already counted |
| Price to equity | 3.14x | 1.98x (my calculation) | 1.16x points |
| Liabilities to equity | 236.25% (March 31) | 156% (company, June 30) | 80 points |
Contents
Two amounts that frame SKC stock
Let me be exact about both halves, because the whole piece rests on them.
The money that came in. SKC announced a ₩1 trillion shareholder-allocation rights issue on Thursday, February 26, 2026. The final issue price was set at ₩99,500 per share on Tuesday, May 12, 2026. Existing shareholders subscribed on Thursday and Friday, May 14 and 15. The 11.73 million new shares listed on Monday, June 8, 2026. Multiplying gives ₩1,167,135,000,000 (11,730,000 × ₩99,500), which is the ₩1,167.1 billion I keep citing. Korean press reported the gross proceeds at ₩1.1671 trillion, and one outlet put the figure at ₩1.1647 trillion; the difference is about ₩2.4 billion and I have not established which of the two is net of issue costs.
The money that went out. From the consolidated statements filed with Korea’s electronic disclosure system, free cash flow was minus ₩896.4 billion in 2022, minus ₩1,266.1 billion in 2023 and minus ₩867.3 billion in 2024. The three add to minus ₩3,029.8 billion. The 2025 annual free cash flow field is empty in the filing data I pulled, so that year is missing from my sum, and its absence makes my figure conservative, because 2025 would almost certainly deepen it.
₩1,167.1 billion measured against ₩3,029.8 billion is 38.52 percent. Measured a second way, that three-year cash consumption is 68.03 percent of the ₩4,453.9 billion the whole company is worth at Friday’s close. Both are my own calculations from filed figures.
I want to be careful about what this does and does not say. It does not say the raise was too small; the company sized it against a specific plan, and its own history was never the measure it worked from. It does say that anyone treating a trillion-won raise as decisive should first know what the three preceding years cost.
Where the new money went
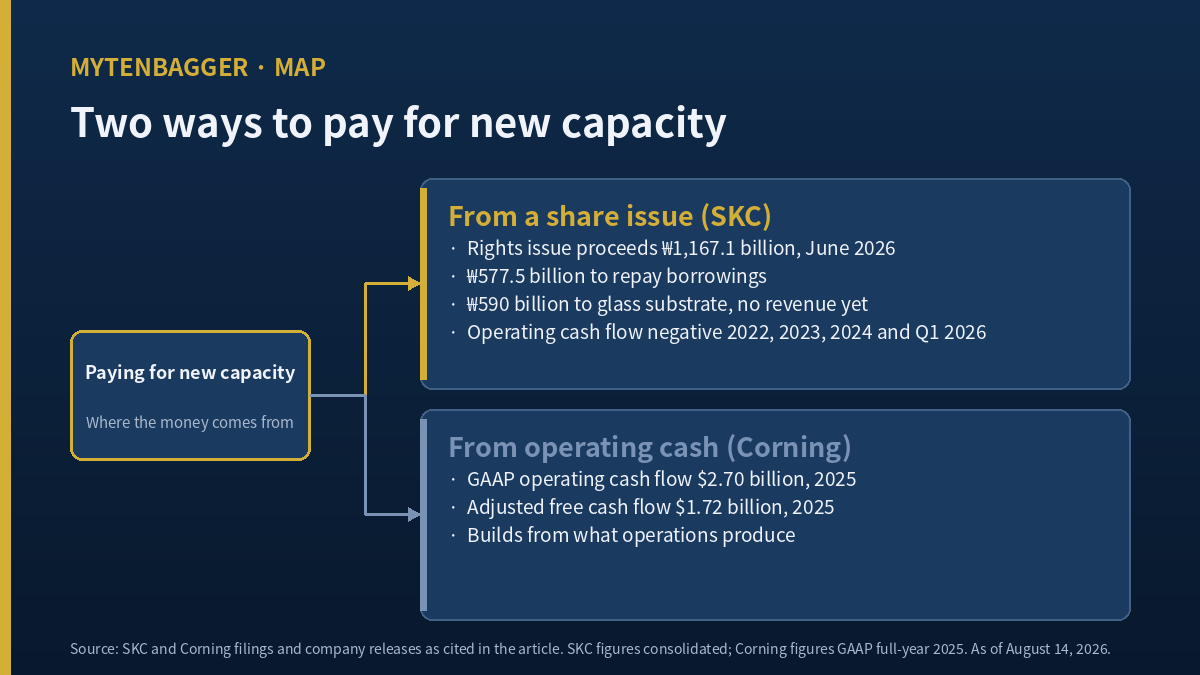
The split is almost even. ₩577.5 billion (about $407.1 million) to repaying borrowings, ₩590.0 billion (about $415.9 million) to the glass-substrate business. Those two come to ₩1,167.5 billion, within about ₩0.4 billion of the gross proceeds, which I read as rounding. As proportions: 49.48 percent to repayment, 50.55 percent to the new plant.
The repayment portion was originally set at ₩410 billion. Korean press reported that the share price rose during the subscription window, that roughly ₩170 billion more came in than planned, and that the extra went to debt. I take a plain reading from that. When more money arrived, this company chose interest expense over new capacity. With total borrowings reported at around ₩4.2 trillion, the choice is easy to follow.
SKC’s own guidance, given when the rights issue was priced, was that the liabilities-to-equity ratio would fall from roughly 230 percent at the end of 2025 to about 129 percent. I rebuilt that number to see which statement it stood on. Taking the 2025 year-end consolidated figures (liabilities ₩4,714.8 billion, equity ₩2,025.7 billion), then subtracting the ₩577.5 billion repayment from liabilities and adding the ₩1,167.1 billion of proceeds to equity:
(4,714.8 − 577.5) ÷ (2,025.7 + 1,167.1) = 4,137.3 ÷ 3,192.8 = 129.58% (my calculation)
That lands within 0.58 points of the reported “about 129 percent,” which tells me the guidance was built on the December statement and not on the March one. Running the same steps on the first-quarter figures gives 131.37 percent instead.
Why SKC stock ratios still look worse than the company does
Here is the part that cost me the most time. The market value on my screen counts 49,597,996 shares, which includes the 11.73 million listed on June 8. I confirmed this with a multiplication: ₩89,800 × 49,597,996 = ₩4,453,900,040,800, matching the displayed market value to the won. Using the pre-issue count of 37,867,996 instead gives ₩3,400.5 billion, more than a trillion won away.
But the equity-based figures beside it come from the March 31, 2026 consolidated statement, filed before any of the money arrived. I verified this too: liabilities ₩4,754.7 billion divided by equity ₩2,012.6 billion is 236.25 percent, matching the displayed ratio to two decimals. So the price side of every equity ratio is current and the equity side is four and a half months old.
Applying the same correction to the price-to-equity multiple: the displayed per-share equity of ₩28,572 multiplied by the pre-issue share count comes to ₩1,081.96 billion. Adding the ₩1,167.1 billion of proceeds gives ₩2,249.1 billion, and dividing by 49,597,996 shares gives ₩45,347 per share. At ₩89,800 that is 1.98x against the displayed 3.14x, so the screen figure is 1.59 times the recalculated one.
None of this makes 1.98x cheap. I am not making a valuation claim in this piece. I am saying that 3.14x and 1.98x describe the same company on two different dates, and that a reader who leans on one without knowing which date it belongs to is leaning on something looser than it appears.
What I could not pin down in that recalculation
₩1,081.96 billion is a long way from the ₩2,012.6 billion of consolidated equity on the same date, a gap of ₩930.6 billion, or 46.24 percent. Non-controlling interests are the obvious candidate given how SKC’s subsidiaries are financed, but I did not open the equity note to confirm it. So my 1.98x is best described as “the displayed per-share equity plus the proceeds.” It is not an audited controlling-interest figure.
For the same reason I left return on equity out of my argument entirely. The displayed −73.3 percent, combined with a per-share loss of ₩19,393 and the pre-issue share count, implies a controlling net loss near ₩734.4 billion and an average equity base near ₩1,001.9 billion. That average sits below the ₩1,082.0 billion year-end figure in a year when equity fell, and I could not make those two behave. A figure I cannot explain does not go into a conclusion.
One SKC stock quarter, two published improvement rates
SKC reported second-quarter results on Monday, July 27, 2026: revenue ₩645.4 billion (about $455.0 million), an operating loss of ₩14.4 billion (about $10.15 million), and a net loss of ₩82.2 billion. Korean headlines split. Some wrote that the loss had narrowed 79 percent; others wrote 50 percent. I assumed one was wrong. Both are right, and they measure against different quarters.
- 79 percent, measured against the same quarter a year earlier. The standalone second-quarter operating loss in 2025 was ₩70.17 billion. 1 − (14.4 ÷ 70.17) = 79.48 percent.
- 50 percent, measured against the quarter immediately before. The first quarter of 2026 was ₩28.74 billion. 1 − (14.4 ÷ 28.74) = 49.89 percent.
I pulled both standalone quarterly figures from the filed consolidated statements and did the division myself. Whenever I carry a percentage across from a news article I check what it was measured against, and this is the first time I have found two correct answers circulating for one result.
Samsung Securities noted that the ₩14.4 billion loss beat a consensus of ₩18.7 billion and came in slightly better than the company’s own estimate of ₩15.9 billion. Against consensus the actual loss was 22.99 percent smaller; against the company’s estimate, 9.43 percent smaller. The lowest of the three published expectations belonged to the company, and reality came in below even that.
The quarter where the two statements disagreed
The first quarter of 2026 is the one I keep returning to. The operating loss of ₩28.74 billion was the smallest in twelve quarters; the last time it was smaller was the first quarter of 2023 at ₩21.73 billion. Operating margin improved from minus 16.58 percent for full-year 2025 to minus 5.79 percent.
In that same quarter, operating cash flow was minus ₩243.4 billion (about $171.6 million). Comparing first quarters only: minus ₩203.6 billion in 2023, minus ₩52.0 billion in 2024, minus ₩173.1 billion in 2025. Of the four first quarters I can see, 2026 is the worst. The income statement had its best reading in three years while the cash flow statement had its worst in four.
One outflow I can name is inventory, which rose from ₩340.1 billion at the end of 2025 to ₩421.6 billion at the end of March, an increase of ₩81.6 billion, with inventory days lengthening from 72.3 to 77.3. That does not account for the whole movement, and I am not going to guess at the rest without opening the cash flow note. I have written before about a Korean company whose earnings and cash pointed in opposite directions, KEPCO KPS, profitable for seventeen straight quarters with four of negative cash. The mechanism there was working capital in a service business. Here it sits alongside a capital program.
Two segments earn, two lose
Second-quarter segment figures, as published by the company:
| Segment | Revenue | Operating result |
|---|---|---|
| Chemicals | ₩317.8bn | +₩30.5bn |
| Semiconductor materials | ₩72.9bn | +₩21.3bn |
| Battery materials (copper foil) | ₩254.0bn (quarterly record) | −₩30.8bn |
| New business (glass substrate) | not disclosed | −₩17.9bn |
The arithmetic does not close and I am flagging that. The four segment results sum to plus ₩3.1 billion while the consolidated operating result was minus ₩14.4 billion; the ₩17.5 billion difference is presumably corporate cost or inter-segment elimination, and I could not confirm its composition. Segment revenue sums to ₩644.7 billion against a reported ₩645.4 billion.
The copper foil line is the one that holds my attention. A record quarter for revenue and a ₩30.8 billion operating loss in the same three months. Korean coverage reported that segment revenue doubled year on year while the loss shrank by only ₩1.8 billion. On the earnings call, chief financial officer Park Dong-joo said the Malaysian plant is being run with a goal of turning to operating profit from next year; the plant reached full capacity utilization at the end of July, and the company plans to lift both production and sales shares there above 90 percent in the second half, from 61 percent and 50 percent respectively in the first half. Subsidiary utilization was reported at 69.6 percent in the first quarter of 2026 against a 2025 average of 53.7 percent. Depreciation on a plant that only recently filled up is the explanation offered, and it is a plausible one.
Glass substrate is earlier still. Embedding products entered early reliability evaluation in Taiwan, with results possibly this year, and ₩590 billion of the raise is allocated to the business. Initial production, customer delivery and first revenue dates are all undisclosed. I have looked at a Korean company selling a story whose revenue starts in a future year before, LS Eco Energy, where one price covered two businesses and the newer one earned nothing yet, and glass substrate is a step earlier than that one was.
The impairment history belongs here too. Korean press reported that SKC recognized ₩442.5 billion of equity impairment and ₩114.6 billion of goodwill impairment on SK Nexilis during 2025, ₩557.1 billion together, following ₩315.2 billion and ₩89.7 billion at the end of 2024. The timing fits the ₩498.6 billion standalone net loss the filings show for the fourth quarter of 2025. A separate ₩128.9 billion impairment on idle Malaysian equipment was also reported. These amounts come from Korean secondary coverage and I did not open the underlying notes. For a Korean company whose reported loss was decided well below the operating line, I have written about Simmtech, where a rising share price is what enlarged the net loss; there the mechanism was fair-value movement on convertible bonds, here it is the amount at which a subsidiary was stated.
The company already sitting where SKC is buying a seat
For a global comparison I did not want a copper foil producer. My subject here is how new capacity gets paid for, so I picked a company that works with the same material SKC’s new business is built on, glass, and that funds its plants from its own operations: Corning Incorporated (NYSE: GLW).
Corning’s full-year 2025 results, from its own release, show core sales of $16.41 billion, GAAP sales of $15.63 billion, GAAP net income of $1,596 million, and GAAP operating cash flow of $2.70 billion, with adjusted free cash flow of $1.72 billion.
I am comparing exactly one item, because only one is defined the same way on both sides: the sign of operating cash flow. Corning generated $2.70 billion from operations in 2025. SKC’s operating cash flow was negative in 2022 (minus ₩147.2 billion), negative in 2023 (minus ₩234.7 billion), negative in 2024 (minus ₩199.7 billion) and negative again in the first quarter of 2026 (minus ₩243.4 billion). One company builds from what its operations produce; the other builds from what its shareholders subscribe.
I deliberately did not build a table of multiples or margins across the two. Corning’s mix is optical communications and display, SKC’s is chemicals and battery materials, the profitability positions are opposite, and I did not read either company’s accounting notes closely enough to know that the line items are constructed alike. Putting those numbers in adjacent columns would give a reader precision that the underlying definitions do not support.
Two houses split 2.51 times on SKC stock in 2027
| House | Date | Stance and level | 2026E operating | 2027E operating |
|---|---|---|---|---|
| Samsung Securities, analyst Cho Hyun-ryul | Tuesday, July 28, 2026 | HOLD maintained; reset the number to ₩94,000 from ₩140,000 | −₩66.0bn | +₩109.0bn |
| SK Securities, analyst Park Hyung-woo | Wednesday, August 5, 2026 | Buy; put ₩104,000 on it | −₩71.6bn | +₩43.5bn |
What holds my attention is not the levels but how differently the two columns behave. For 2026 the two estimates are ₩66.0 billion and ₩71.6 billion apart by 8.48 percent. For 2027 they are ₩109.0 billion and ₩43.5 billion, a factor of 2.51. More than half of 2026 is already filed, so there is little left to disagree about; 2027 requires each house to size two events that have not happened, the copper foil turn and the first glass-substrate revenue.
Cho Hyun-ryul cut the level 32.86 percent from ₩140,000 and made any upgrade conditional on tangible confirmation that operating profit can turn, noting that SK Nexilis volume growth is coming entirely from non-captive customers, which is welcome, while the operating losses continue. Park Hyung-woo put second-quarter copper foil volumes at 10,600 metric tons, up 47 percent from the prior quarter, and estimates 13,000 metric tons for the third, arguing that competitors converting lines to circuit foil for IT substrates is tightening battery-foil supply while non-Chinese demand grows. I read neither report in the original; both sets of figures come from Korean secondary coverage and briefing summaries. A year where two houses disagree by more than double is something I have run into recently, KCTech, where two houses put the same year’s earnings per share 2.3 times apart. There, though, the contested year was the current one.
My position on SKC stock and what I am watching
At ₩4,453.9 billion of market value SKC sits outside the top hundred Korean listings by size, which puts it in my observe-only bucket by default. This time I have a second reason as well: the ratios I would normally screen with are anchored to a date that precedes the largest financing event in this company’s recent history, and I will not call anything cheap or dear until I know which company the number describes.
The two markers I am watching:
- The consolidated balance sheet in the 2026 half-year report. The statutory filing deadline is Saturday, August 15, 2026, which is Liberation Day in Korea, so it may move to the next business day, Monday, August 17. Once June 30 equity and liabilities are filed, my 129.58 percent and my 1.98x are both replaced by measured figures.
- The sign on the copper foil segment result. The chief financial officer has stated a goal of operating profit from next year. How fast the ₩30.8 billion quarterly loss shrinks between now and then tells me which of the two 2027 estimates the business is tracking.
My working assumption breaks like this. If the half-year filing comes in materially away from what I calculated, the thing that was wrong is my arithmetic, not the company. In that case I do not adjust a figure or two; I discard the calculations in this piece and start again from the filed statement. The 46.24 percent non-controlling estimate is the load-bearing piece; if that collapses, 1.98x has nothing under it.
Twenty ways I could be wrong about SKC stock
Before the list, one thing I nearly did and did not. Samsung Securities gave a second-quarter consensus of ₩18.7 billion, and I wanted to use that as evidence that the market had been too pessimistic. Then I realized I had no idea how many houses that average contained. A consensus figure built from three estimates and one built from fifteen are not the same evidence, and I could not tell which I was holding. It came out of the argument and it sits here instead.
On my tools and my own procedure
- The date mismatch between price data and equity data is unlikely to be unique to this name, and I have not run this check on every company I have written about.
- Comparing three years of free cash flow with today’s market value divides figures from different moments, so the 68.03 percent is a scale illustration and not a valuation input.
- I read neither broker report in the original; the estimates in my table are as quoted in secondary coverage.
- Only two houses with forward estimates means I am reading market expectations off a very small sample.
- My USD conversions use one rate for one date and will drift from live quotes.
On the balance sheet and my calculations
- The pre-issue share count of 37,867,996 is a figure I got by taking the difference; I did not open the share-count filing.
- The ₩930.6 billion gap between displayed per-share equity times shares and consolidated equity is unconfirmed as non-controlling interest.
- My 1.98x therefore starts from the displayed equity figure and never reaches an audited controlling-interest number.
- I assumed the proceeds accrue entirely to controlling equity; subsidiary-level issuance would undo that.
- I could not make return on equity of −73.3 percent consistent with the implied average equity base.
- The 27-point distance between guided 129 percent and reported 156 percent is unexplained by me.
- I did not confirm the ₩577.5 billion of repayment was fully executed by June 30.
- The ₩82.2 billion second-quarter net loss is a company figure I have not matched to a filing.
- I did not open the cash flow note behind the ₩243.4 billion first-quarter outflow.
- Beyond the ₩81.6 billion inventory build I cannot identify the other cash uses.
- 2025 free cash flow is absent from the filing data and therefore missing from my three-year sum.
On the business
- The ₩17.5 billion between summed segment results and the consolidated result is unexplained by me.
- Glass substrate has no disclosed production, delivery or revenue dates against ₩590 billion of committed spending.
- Copper foil lost ₩30.8 billion in a record revenue quarter, and the turn is a stated goal and no date for it has been disclosed.
- The non-Chinese copper foil supply argument is one house’s industry view and I did not test it independently.
Figures I checked and did not use
Relative performance
Over the year to Friday, August 14, 2026 (244 trading days), SKC returned −7.24 percent against the KOSPI at +116.33 percent and an equal-weighted chemicals sector at +2.65 percent. Decomposed, the sector accounts for 92.0 percent of the shortfall against the index. The stock ranks 59th of 113 chemicals names, with beta 1.035 and correlation 0.671. I have used this particular combination of verdicts as an argument in a recent piece, so I kept it out of this one.
Where the price sits
On the same closing basis as the table above, the one-year closing high was ₩174,100 on Thursday, May 7, 2026 and the low ₩64,200 on Thursday, July 30, 2026. Friday’s ₩89,800 is 48.42 percent below that high and 39.88 percent above that low. A 250-session adjusted-close window instead gives ₩184,400 and ₩61,100, which produces a 51.3 percent drawdown. The difference comes purely from how many sessions are included, so I used the one-year window to stay consistent with the closing price in my table. The price is 12.73 percent above its 20-session average of ₩79,660 and 15.76 percent below its 60-session average of ₩106,595.
Screen fields I discarded
The last dividend on record was ₩1,100 per share for fiscal 2022, with nothing since, so every dividend field came out. A three-year revenue growth rate of −16.31 percent spans a 2023 divestment that halved revenue and cannot be read as a growth measure. Interest coverage of −0.35 is the first quarter of 2026 operating loss of ₩28.74 billion divided by interest expense of ₩82.63 billion (−0.3478), so it is a one-quarter figure and meaningless while operating results are negative. The displayed EBITDA of −₩28.74 billion is identical to that quarter’s operating loss to the won and carries no separate information.
Prices and multiples here reflect the close on Friday, August 14, 2026, as I checked them at the time of writing; I wrote this on Saturday, August 15, a Korean public holiday, so the previous business day’s close is the basis. Financial figures are consolidated, from Korea’s electronic disclosure filings, except second-quarter and segment results, which are company figures released on Monday, July 27, 2026. USD amounts are approximate, converted at roughly ₩1,418.6 per dollar, the August 13, 2026 close as published in KB’s August 14, 2026 daily FX bulletin. Korean won is the reference currency throughout, and anything marked as my calculation was derived by me from filed figures.
Sources: Korea’s Financial Supervisory Service electronic disclosure system (consolidated statements) · Corning Incorporated full-year 2025 results · Newsis (rights issue proceeds and use of funds) · Dealsite (second-quarter call, leverage, management remarks) · Newstomato (impairments and utilization) · Sisa Journal e (segment results, consecutive losses) · Etoday (SK Securities estimates) · SKC investor relations