Why Hansol Paper Lagged the KOSPI but Led Its Paper Sector
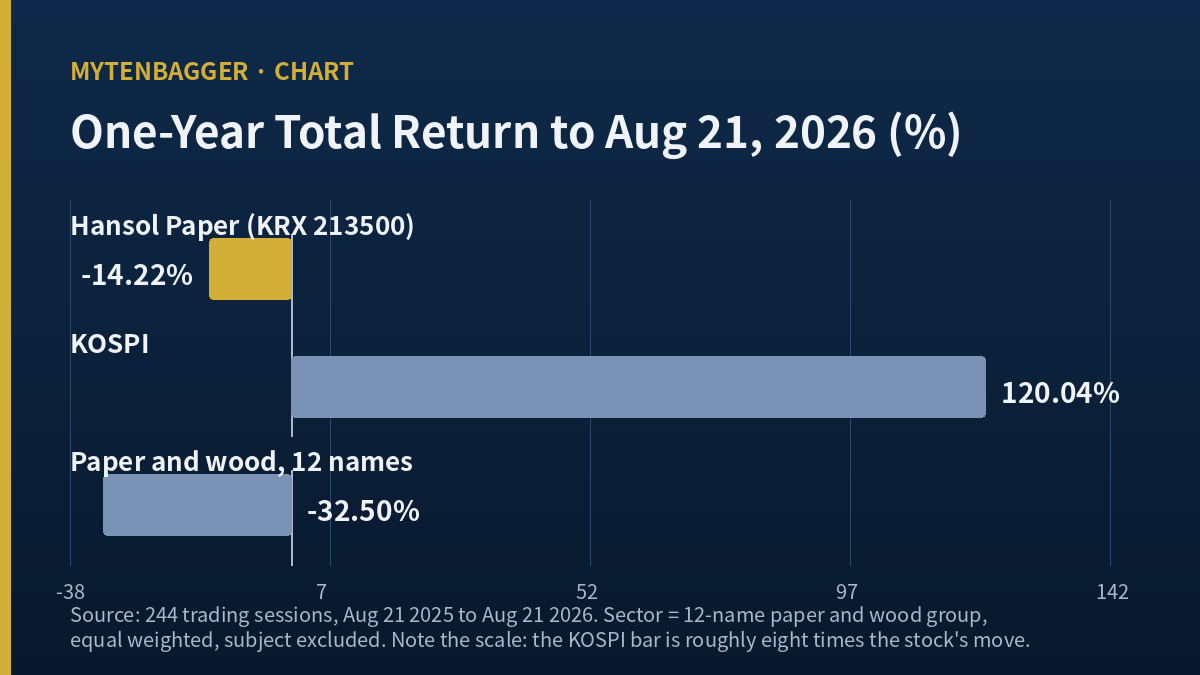
I ran the same one-year window twice and got two answers that point in opposite directions. Measured against the KOSPI, Hansol Paper stock is 134.25 points behind. Measured against the twelve-name paper and wood group it belongs to, the same ticker is 18.29 points ahead, and it ranks first in that group. Both numbers come from the same 244 trading sessions, closing August 21, 2026 (Fri).
My first reaction was to pick one and write about it. I sat on that for a while because the honest question is not which number wins. It is what a 134 point gap can possibly mean for a company whose beta against that index is 0.166 and whose correlation with it is 0.322. A stock that barely moves with the market cannot really be said to have lost to it. So I went somewhere else for the answer, and the rest of this post is what I found in the cash flow statement.
Hansol Paper is a KRW 173.7 billion company, roughly USD 125.3 million, listed on the KOSPI in Seoul under the code 213500. My stance is to watch it. Korean won is the base currency in everything below and dollar figures are a convenience for readers who think in dollars.
The headline number: minus 134.25 points against the KOSPI over one year.
Reason one to distrust it: beta against that index is 0.166, correlation 0.322. Over the same window the KOSPI gained 120.04% and this stock fell 14.22%. Those two series are barely holding hands.
Reason two: swap the yardstick for the company’s own sector and the sign flips to plus 18.29 points, first place out of twelve.
Contents
Hansol Paper Stock Against Two Yardsticks That Disagree
Here is the full split for the window running August 21, 2025 to August 21, 2026 (Fri), 244 trading sessions, sector index built equal weighted with the subject company excluded.
| Series | One-year return | Gap versus the stock |
|---|---|---|
| Hansol Paper (KRX 213500) | -14.22% | |
| KOSPI | +120.04% | -134.25 points |
| Paper and wood group, 12 names, equal weighted | -32.50% | +18.29 points |
| Same group, capitalization weighted | -31.54% | +17.33 points |
Source: Korean market data vendor series (daily closes, Kiwoom index candles plus a synthetic sector index), pulled August 22, 2026 (Sat). The decomposition identity holds: sector effect of minus 152.54 points plus stock effect of plus 18.29 points equals the minus 134.25 point total. Sector share of the gap is 89.3%. I checked that arithmetic by hand.
Two things matter in that table. First, the verdict does not depend on how I weight the sector. Equal weighted gives plus 18.29 and capitalization weighted gives plus 17.33, and the largest constituent carries 30.72% of the basket without being this company. Second, 89.3% of the shortfall against the index belongs to the sector, not to the company. Whatever went wrong here went wrong to Korean papermakers as a class.
A Year the KOSPI More Than Doubled
The index side of that comparison deserves a paragraph of its own, because a 120% gain in twelve months is not a normal denominator. The KOSPI closed at 9,114.55 on June 22, 2026 (Mon), fell to 5,593.56 by July 30, 2026 (Thu), and sat at 6,912.95 on August 21, 2026 (Fri). That is a 38.63% peak to trough decline inside five weeks, followed by a recovery of 75.8% of the lost ground.
An index doing that is not a stable measuring stick. When I say a small paper company trailed it by 134 points, I am mostly saying that Korean large caps had a violent year and this company was not in that trade. With a beta of 0.166 it was never going to be. I keep the number in the piece because it is true, and I refuse to build an argument on it.
Hansol Paper Stock Finished First Among Twelve Names in Its Sector
The sector comparison is the one I trust, and it is flattering in a way that needs unpacking. Out of twelve names that traded the whole window, this one ranks first. It beat eleven. The group median is minus 34.08% and this stock is minus 14.22%, a gap of 19.86 points against the median.
Coming first in a group where the median member lost a third of its value is a strange kind of victory. The right way to say it is that this company fell less. Nothing in the return series says it grew, earned, or compounded anything. It declined more slowly than eleven companies that were declining.
The Drawdown Table Tells a Third Story
| Series | Peak | Trough | Max drawdown | Recovery of lost ground |
|---|---|---|---|---|
| Hansol Paper | KRW 9,300 on April 16, 2026 (Thu) | KRW 6,040 on June 26, 2026 (Fri) | -35.05% | 78.5% |
| KOSPI | June 22, 2026 (Mon) | July 30, 2026 (Thu) | -38.63% | 75.8% |
| Paper and wood group | April 16, 2026 (Thu) | June 26, 2026 (Fri) | -37.61% | 65.2% |
Source: same vendor series, closing prices only, troughs searched after each series own peak. Recovery of lost ground is the share of the peak to trough decline that has been retraced as of August 21, 2026 (Fri). The stock and its sector share both dates, which is what I would expect if the move was a sector move.
On this measure the ranking holds. The stock had the shallowest maximum drawdown of the three and has retraced the most. It also sits 21.51% below its own April peak and 20.86% above its June low, which is the boring middle of a wide range.
One more line from the co-movement panel is worth keeping. Over the last twenty sessions the stock rose 5.49% while its sector fell 2.98% and the index fell 2.59%, a divergence of 8.48 points that the vendor flags as idiosyncratic. Something specific happened here in the last month, and the earnings print is the obvious candidate.
Why I Stopped Looking at Hansol Paper Stock and Opened the Cash Flow Statement
Return series told me the sector fell and this name fell less. That is a description, not a reason. So I went to the filings, and the first table I built was operating cash flow set against operating profit for each of the last four fiscal years.
| Fiscal year | Revenue | Operating profit | Operating cash flow | Cash over profit | Year end inventory |
|---|---|---|---|---|---|
| 2022 | KRW 2,458.0bn | KRW 130.2bn | -KRW 62.8bn | -48.2% | KRW 459.5bn |
| 2023 | KRW 2,194.1bn | KRW 47.2bn | +KRW 238.5bn | +504.8% | KRW 339.0bn |
| 2024 | KRW 2,215.8bn | KRW 22.0bn | +KRW 29.3bn | +133.4% | KRW 396.2bn |
| 2025 | KRW 2,290.0bn | KRW 49.9bn | +KRW 66.6bn | +133.4% | KRW 372.9bn |
| First half 2026 | KRW 1,152.5bn | KRW 62.0bn | -KRW 14.4bn | -23.2% | KRW 466.1bn |
Source: consolidated statements filed with Korea’s electronic disclosure system, converted from the filing unit of millions of won. The cash over profit column is my own division of two filed lines and appears under that name in no filing. First half 2026 figures are cumulative and come from the half-year report filed August 13, 2026 (Thu).
The ratio swings from minus 48% to plus 505% at the same plants making the same products. The right hand column explains most of it. Inventory fell by KRW 120.6bn during 2023 and cash from operations came in at five times operating profit. Inventory rose by KRW 93.2bn during the first half of 2026 and cash from operations went below zero.
Six Months That Added Profit and Removed Cash
| Line | First half 2025 | First half 2026 | Change |
|---|---|---|---|
| Revenue | KRW 1,140.6bn | KRW 1,152.5bn | +1.04% |
| Operating profit | KRW 39.7bn | KRW 62.0bn | +56.39% |
| Net profit, consolidated | KRW 15.2bn | KRW 33.4bn | +119.75% |
| Operating cash flow | +KRW 33.9bn | -KRW 14.4bn | -KRW 48.3bn |
| Interest expense | KRW 27.2bn | KRW 32.5bn | +19.57% |
| Inventory at period end | KRW 427.8bn | KRW 466.1bn | +8.97% |
Source: consolidated half-year filings. Every percentage in the change column is my own division of the two adjacent cells.
Revenue moved one percent, operating profit moved fifty six, and operating cash flow moved KRW 48.3bn in the wrong direction. Korean press reached the same conclusion from the filing. Seoul Economic Daily reported on August 15, 2026 (Sat) that KRW 89.2bn of cash was tied up in inventory and KRW 33.6bn in receivables, and that total liabilities reached KRW 1.40 trillion. Management puts the build down to pulp prices rising, to buying ahead of expected demand, and to paperboard moving slower than planned.
My own inventory increase of KRW 93.2bn is the difference between two balance sheet dates. A profit line and a cash line pulling apart is the pattern I traced at SeAH Steel, where cash flow went negative while profit did not. The KRW 89.2bn in that report is the working capital line inside the cash flow statement. They measure the same thing with two different rulers and I could not open the notes to close the KRW 4bn gap.
Three Years of Profit Against Three Years of Cash
Stack the two statements over the same three fiscal years and the divergence becomes the whole story. Net profit for owners of the parent came to KRW 1.8bn in 2023, minus KRW 30.4bn in 2024, and KRW 3.9bn in 2025. That sums to minus KRW 24.8bn. Operating cash flow across those same three years came to KRW 238.5bn, KRW 29.3bn and KRW 66.6bn, or plus KRW 334.4bn.
Dividends were paid every one of those years. The company declared KRW 300 per share as a final dividend for 2025, KRW 7.13bn in total, and KRW 200 per share as an interim dividend decided August 5, 2026 (Wed), KRW 4.76bn in total. Together that is KRW 11.89bn, about USD 8.6 million, against three years of owner profit that adds up to a negative number. The dividend has never come out of the income statement. It comes out of the years when the warehouse empties. I ran into the same shape at Hanil Cement, where the payout took 99% of a profit that had halved.
Hansol Paper Stock Carries Two Different Earnings Multiples
| Basis | Price to earnings | Price to book | What it uses |
|---|---|---|---|
| Vendor screen | 44.71 | 0.25 | Full year 2025 owner profit of KRW 3.9bn |
| My derivation | 7.87 | 0.24 | Trailing four quarters of owner profit, KRW 22.1bn, and June 30, 2026 (Tue) owner equity |
Both rows use the August 21, 2026 (Fri) close of KRW 7,300 and a share count of 23,800,576. The trailing four quarter figure is the sum of four discrete quarters: minus KRW 9.1bn, minus KRW 2.2bn, plus KRW 3.4bn and plus KRW 30.0bn. Neither row is wrong. They cut the twelve months in different places.
A 5.7 times spread between two honest multiples is what happens when quarterly profit crosses zero repeatedly. Anyone quoting a single price to earnings figure for this company without saying which twelve months they used is quoting a coin flip. Return on equity, for what it is worth, is 0.6%.
The Share Count Came From the Screen Values, Not the Screen Field
A small thing I want on the record because it cost me an hour. The vendor field for shares outstanding reads 23,794,521. Take the same screen’s precise earnings per share of KRW 163.27 and divide 2025 owner profit of KRW 3.886bn by it, and you get 23,800,453. Take its book value per share of KRW 29,311 and divide consolidated equity of KRW 697.6bn by it, and you get 23,800,576. Two Korean data services publish 23,800,576, and par value of KRW 5,000 against paid in capital of KRW 119.0bn agrees.
So the screen’s own ratios were computed on a share count its own field does not carry. The difference is 6,055 shares, three hundredths of one percent of market value. It changes nothing here. It would change something in a company with a tighter valuation, and the habit that caught it was dividing declared dividend totals by declared dividend per share.
What Made the Second Quarter Look Like That
The June quarter on a standalone basis produced revenue of KRW 592.7bn, operating profit of KRW 50.8bn and net profit of KRW 30.0bn. Operating margin works out to 8.57%. The preliminary release of July 30, 2026 (Thu) and the audited half-year filing of August 13, 2026 (Thu) match to the million won.
Eugene Investment titled its review “first 8% operating margin in sixteen quarters.” I counted the quarters myself before repeating it. Standalone operating margins from the June 2022 quarter forward run 8.91, 6.70, 1.13, 1.39, 2.88, 2.75, 1.70, 6.36, 0.90, -0.78, -2.26, 3.53, 3.42, 0.46, 1.30, 2.01, and then 8.57. Two quarters clear 8% and there are exactly fifteen in between. The title checks out.
Two of the Three Reasons Do Not Repeat
Management named three drivers: paperboard volume lifted by Korean cultural exports, thermal paper prices rising, and a customs duty refund following the reversal of US reciprocal tariffs. The refund does not come back next quarter. No filing or article I could find puts a number on it.
The larger one-off sits just outside the quarter. Korea’s competition regulator fined six paper companies KRW 338.3bn on April 23, 2026 (Thu) for coordinating printing paper prices between February 2021 and December 2024. This company drew the largest share at KRW 142.6bn, around a fifth of its equity at the time. A correction filing went up on June 12, 2026 (Fri) and Korean press reported the amount was waived in full, with two rivals cut by roughly a third and a third rival paying in full. No outlet I read stated the ground for the waiver, so I am not going to state one either.
Price increases were pulled and then reinstated in between. A five percent discount reduction on speciality grades due June 1 was withdrawn on May 28, 2026 (Thu), days after the fine. A similar reduction on five printing paper lines went ahead on July 1, 2026 (Wed). Printers have called that a breach of a May cooperation agreement and are weighing damages claims. Management has said the increases apply from July and August and therefore had nothing to do with the June quarter, which means the 8.57% margin contains no pricing benefit at all.
How Hansol Paper Stock Prices Against Global Papermakers
| Company | Fiscal year | Revenue | Operating margin | Price to book | Dividend yield | As of |
|---|---|---|---|---|---|---|
| Hansol Paper (KRX 213500) | 2025, December | KRW 2.29tn | 2.18% | 0.25 | 6.85% | Aug 21, 2026 |
| Nippon Paper (TYO 3863) | Year to March 2026 | JPY 1,192.6bn | 2.11% | 0.27 | 1.20% | Jun 29, 2026 |
| Oji Holdings (TYO 3861) | Year to March 2026 | JPY 1,861.7bn | 1.86% | 0.60 | 4.56% | Jun 29, 2026 |
| Stora Enso (HEL STERV) | 2025, December | EUR 9.33bn | 5.7%, adjusted EBIT | 0.73 | 2.64% | Jun 12, 2026 |
| UPM (HEL UPM) | 2025, December | EUR 9.66bn | 9.5%, comparable EBIT | 1.19 | 6.46% | Aug 12, 2026 |
| Suzano (NYSE SUZ) | 2025, December | BRL 50.0bn | 17.43% | 1.07 | 2.31% | Aug 20, 2026 |
Sources: company results releases for the revenue column (UPM, Stora Enso, Suzano) and a third party screening service for the multiples. Fiscal year ends, margin definitions and pricing dates all differ across these rows, so I compare the shape and leave the decimals alone. I did not convert any of these currencies into any other, which keeps this piece to a single exchange rate.
The pairing that caught me is Nippon Paper. Price to book of 0.27 against 0.25 here, operating margin of 2.11% against 2.18% here. Two companies in different countries, valued almost identically, earning almost identically. Oji is the awkward one: a thinner margin at 1.86% and more than double the price to book at 0.60.
What that says to me is that this company is not being punished for anything specific. It is sitting inside a valuation band that global paper occupies when margins run near two percent. Leaving that band takes the kind of margin structure Suzano and UPM have, and the last four years of filings suggest no such structure is close. Meanwhile the industry keeps shrinking capacity: Fastmarkets has argued that 2026 conditions only improve if capacity comes out, and Korean producers themselves are pushing into higher value materials as paper demand falls.
Thermal Paper Is Where the Company Is Actually Large
Three product lines carry the revenue: printing paper, industrial paper which is mostly white paperboard, and speciality paper which is mostly thermal receipt and label stock. The third is the one with a global position. Market researchers list this company among the five producers that hold roughly sixty percent of a thermal paper market sized at USD 4.88 billion for 2026 and projected at USD 6.32 billion for 2031. I could not obtain a company level share figure, so what I am describing is capacity standing, which is a weaker claim than market share.
Trade policy runs in both directions on that line. The United States Department of Commerce published the final results of an antidumping administrative review on May 8, 2026 (Fri) assigning this producer a 0.00% margin while all other Korean producers carry 6.19%. Europe is the open question. A 15.8% duty on heavyweight thermal paper has been in force since October 20, 2020, a 10.3% duty on lightweight grades since 2017, and the European Commission opened an expiry review on October 17, 2025. The notice allows twelve to fifteen months, which puts the outcome in late 2026 or early 2027.
Seven Arguments Against My Own Read of Hansol Paper Stock
- Both covering analysts are buyers. Two houses model this company and both say buy. I am watching. That disagreement belongs at the top, not buried.
- The dividend has never been cut. It was paid through a KRW 30.4bn loss year. My line about it not coming from the income statement reads as a warning, and it reads just as well as evidence that the cash flow has carried it for years.
- Inventory building can be preparation. Imported pulp went from USD 543 to USD 612 per tonne between 2025 and the March 2026 quarter by the company’s own account. Buying ahead of that is ordinary behavior for a mill.
- The 8.57% margin might be real. I call part of it one-off without knowing the refund amount. I have no way to size what I am discounting.
- Price increases land in the third quarter. The July 1 move being absent from the June quarter also means the September quarter has a fresh input the June quarter did not.
- The waived fine is enormous. A liability worth a fifth of equity went to zero. It is hard to name a bigger balance sheet positive.
- The sector index under this whole piece is not mine. Twelve constituents, equal weighted, built by a data vendor whose classification boundary I did not independently verify. Move that boundary and the plus 18.29 points, the median, and the first place ranking all move with it. That is the thinnest plank in the argument, and the argument leans on it in two separate sections.
My Position on Hansol Paper Stock and What Would End It
The dividend is attractive and the balance sheet discount is real, but the dividend is funded by working capital swings and working capital turned against the company in the first half of this year. That said, a minus sign on the cash flow is not automatically a warning — I explained why at Youngone.
The number I will watch is not the price. If this name drops out of the top three of its twelve-name sector over a rolling one-year window, my read that it defended better than its peers has failed, and the sector comparison was the only comparison in this piece I trusted. First place with a plus 19.86 point cushion against the group median gives that test room, which is exactly why it is a fair test. The KOSPI comparison plays no part in it, because a stock with a beta of 0.166 cannot be judged by an index it does not follow.
The date to check is the third quarter filing, legally due November 15, 2026. I will look at two cells: whether inventory has come down from KRW 466.1bn, and whether nine-month operating cash flow is back above zero.
On timing and precision. Prices, market value and multiples reflect the August 21, 2026 (Fri) close as I checked them at the time of writing. August 22, 2026 (Sat) has no session, so the previous business day close is the basis throughout. Dollar amounts are approximate conversions at 1,386.5 won per dollar on that same date, and Korean won is the reference currency for everything here. Financial figures come from consolidated filings and were converted from millions of won into billions, losing a decimal place in the process.
What I could not confirm. The size of the second quarter customs refund. The stated ground for the fine being waived. A breakdown of the inventory increase by category. The KRW 4bn difference between the two inventory measures. Any credit rating or outlook. The revenue share of the sustainable materials lines. The valuation in the Heungkuk note of July 31, 2026 (Fri). Depreciation, which the disclosure feed does not carry as a line. Company level thermal paper market share. None of these were filled in with an estimate.
- Pan Ocean Tanker Orders Ahead of a 2028 Delivery Wave
- Korean Fashion Firm F&F Buys the Discovery Expedition Brand