Rainbow Robotics Valuation: The Revenue a Robotics Price Implies
Rainbow Robotics stock closed at KRW 501,000 on Friday, August 14, 2026. Here is what that price asks the company to become, set beside what the company actually booked.
| Line | What this price asks for (my assumptions) | Fiscal 2025 actual (DART consolidated) |
|---|---|---|
| Net income | USD 342.57M (KRW 485.97bn) | USD 1.00M (KRW 1.421bn) |
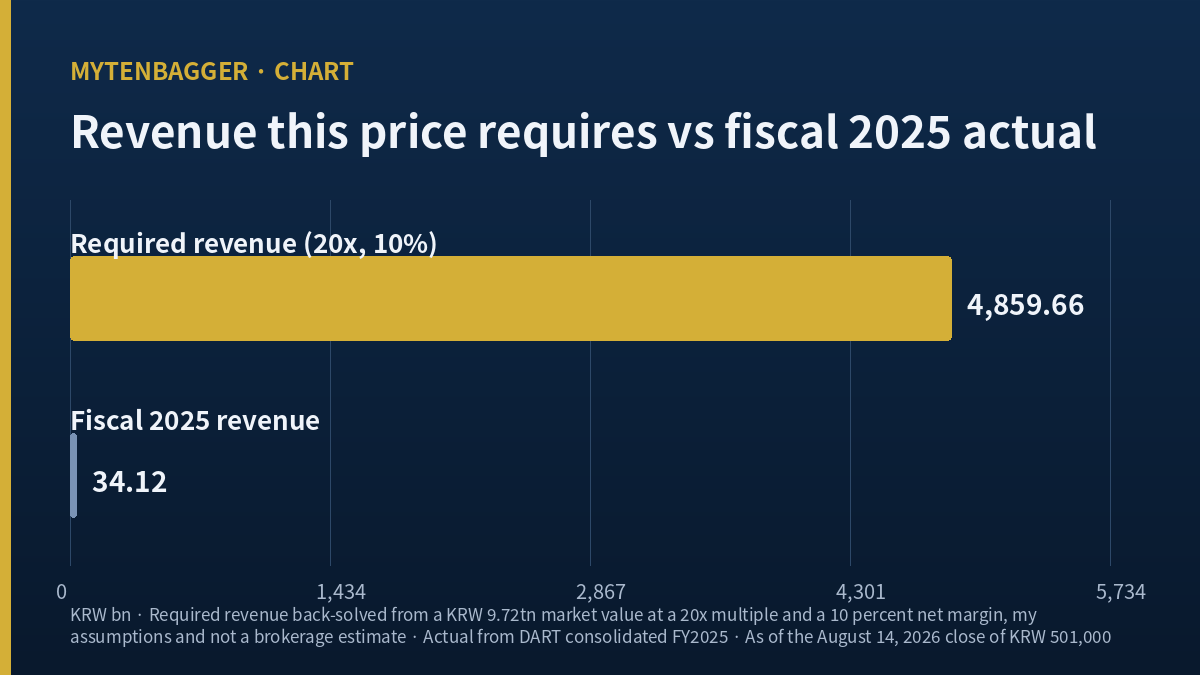
| Revenue | USD 3.43bn (KRW 4,859.66bn) | USD 24.05M (KRW 34.12bn) |
| Operating result | Positive | KRW 2.481bn loss |
| Price to earnings | 20x | 6,839.78x (my calculation) |
The left column comes from two assumptions I picked myself, a 20x earnings multiple and a 10 percent net margin. No brokerage and no company guidance says this.
The first word I wrote next to a price to earnings ratio of 6,837.72x was “expensive.” I deleted it within half a day. Calling something expensive requires two figures to hold up against each other, and here one of the two barely exists. Consolidated net income for fiscal 2025 was KRW 1.421 billion, about USD 1.00 million. Sitting on top of it is a market value of KRW 9.72 trillion, about USD 6.85 billion. The ratio computes, and it tells me nothing. So I turned the arithmetic around, held the price fixed, and solved for the company.
Contents
Closing Rainbow Robotics stock to the last won
Korea runs two boards. KOSPI is the main exchange where the large industrial names sit. KOSDAQ is the growth board, home to smaller technology and biotech issuers, and this company trades there under the code 277810. The distinction matters here because KOSDAQ carries a different investor mix and a wider dispersion of valuations than the main board.
The close on Friday, August 14, 2026 was KRW 501,000. Shares outstanding are 19,399,858 according to the Company Monitor screen dated August 13, 2026. Multiplying gives KRW 9,719,328,858,000. My indicator vendor (Kiwoom data, refreshed 16:49 on August 14, 2026) carries 19,399,800 shares, a difference of 58 shares, and that path produces KRW 9,719,299,800,000. The two land KRW 29,058,000 apart and round to the same KRW 9.72 trillion. I close the market value in won before anything else because every calculation in this piece branches out of that single figure.
One more check. Company Monitor shows an August 13 close of KRW 497,000, and 19,399,858 shares at that price gives KRW 9,641,729,426,000, matching the KRW 9,641.7 billion market value printed on the same screen. My vendor daily series agrees on both sessions. Book value per share of KRW 6,899 times the share count gives KRW 133.84 billion against consolidated equity of KRW 133.83 billion in the DART filing, a gap of 0.0072 percent, which tells me essentially all equity belongs to the controlling interest.
Three multiples on the Rainbow Robotics stock screen, and a warning the vendor wrote itself
The screen carries three multiples: price to earnings at 6,837.72x, price to book at 72.62x, and price to sales at 285.02x. Rebuilding them from source data I get 6,839.78x, 72.6192x, and 284.8322x. The small differences trace back to earnings per share being rounded to a whole won on the vendor screen; my figure is KRW 73.2480 per share, from KRW 1.421 billion over 19,399,858 shares.
What held my attention was not the ratios. It was the data quality block attached to the vendor response, which reads “PER above 1000, verify price or EPS,” with a price anomaly flag set to true. The provider filed a reservation against its own output. I have used this vendor across roughly twenty pieces and this is the first time I have seen that flag raised.
Both inputs are correct and the output is still unusable
I checked. KRW 501,000 is the real close and KRW 73.2480 comes straight out of the DART filing. Two correct inputs can still produce a ratio that carries no information, and that happens when the figure being divided into the price is small enough that ordinary noise moves the result by thousands of units. A KRW 1.421 billion bottom line is that small. A multiple needs a reasonably settled base underneath it, and this one has no such base.
What Rainbow Robotics stock would require in revenue
So I reversed direction. I treated the price as a given and asked what the company has to become for that price to make sense at a normal earnings multiple. This is not a forecast. It is an attempt to make the requirement already embedded in the price visible as arithmetic.
Two assumptions carry the table. First, that this business eventually earns a conventional profit multiple, which I split into 20x, 30x, and 50x. Second, that its net margin at that point is either 10 percent or 15 percent. Both numbers are mine. Because I cannot defend a single pair, I print all six cases.
| Assumed multiple | Required net income | Assumed net margin | Required revenue | Times fiscal 2025 revenue |
|---|---|---|---|---|
| 20x | KRW 485.97bn | 10% | KRW 4,859.66bn | 142.42x |
| 20x | KRW 485.97bn | 15% | KRW 3,239.78bn | 94.94x |
| 30x | KRW 323.98bn | 10% | KRW 3,239.78bn | 94.94x |
| 30x | KRW 323.98bn | 15% | KRW 2,159.85bn | 63.30x |
| 50x | KRW 194.39bn | 10% | KRW 1,943.87bn | 56.97x |
| 50x | KRW 194.39bn | 15% | KRW 1,295.91bn | 37.98x |
The kindest case is the last line. Even if the market hands this business a 50x profit multiple because it builds robots, and even if net margin reaches 15 percent, revenue still has to reach 37.98 times the fiscal 2025 figure. The strictest case is the first line at 142.42 times. Fiscal 2025 revenue grew 76.38 percent, from KRW 19.35 billion to KRW 34.12 billion. Compounding at that same 76.38 percent, six years produces 30.11x and seven years produces 53.11x, so the kindest case takes about seven years of uninterrupted triple digit compounding. The strictest case needs nine, because eight years lands at 93.67x.
There is also a consensus figure worth setting against this. The Company Monitor screen shows an estimated KRW 773 of earnings per share for 2026 as of August 13, 2026, though the screen does not name the contributing houses or say how many there are. Multiplied by the share count that is KRW 14.996 billion, about USD 10.57 million. That is 10.55 times the KRW 1.421 billion actually booked in 2025, an aggressive number on its own terms. Measured against my strictest requirement of KRW 485.97 billion, it is 3.09 percent.
A global peer that already earns that revenue
My strictest requirement, USD 3.43 billion of revenue, sounds abstract until a real company is set next to it. Teradyne Incorporated is the parent of Universal Robots and Mobile Industrial Robots, which makes it the largest owner of collaborative robot volume in the world and a direct competitor to the RB series that generates most of this Korean company’s sales.
Teradyne closed at USD 418.79 on August 14, 2026, the same session I am pricing the Korean shares from. Market value is USD 65.47 billion, trailing price to earnings is 57.49x, forward price to earnings is 42.94x, trailing earnings per share is USD 7.29, trailing revenue is USD 4.46 billion, and shares outstanding are 156.34 million. I reproduced two of those: 418.79 times 156.34 million gives USD 65.47 billion, and 418.79 divided by 57.49 gives USD 7.2846 against the printed USD 7.29.
Three comparisons follow, and I am deliberately limiting myself to these three because the two businesses are not alike. Teradyne earns most of its money from semiconductor test equipment and robotics is one segment, so a full margin or earnings comparison would be dishonest, and I have read neither company’s segment notes.
First, Teradyne’s trailing revenue of USD 4.46 billion converts to KRW 6,326.96 billion, which is 130.19 percent of my strictest requirement of KRW 4,859.66 billion. A company that already books more than this price asks for exists, and it is listed. Second, that same Teradyne revenue is 185.42 times the Korean company’s fiscal 2025 revenue of KRW 34.12 billion. Third, Teradyne trades at 14.68 times trailing sales, while Rainbow Robotics trades at 284.83 times, a gap of 19.40 times. Put the market values beside each other and the Korean company is worth 10.46 percent of Teradyne while booking 0.54 percent of its revenue.
The other side of the Rainbow Robotics stock case
The arithmetic above does not explain the price, and the side that does explain it has real evidence behind it. Some of that evidence is firmer than my assumptions.
Growth is genuine. First quarter 2026 revenue of KRW 9.06 billion is 2.17 times the KRW 4.18 billion booked in the first quarter of 2025, a rise of 116.59 percent. The annual step from KRW 19.35 billion to KRW 34.12 billion was 76.38 percent. Whatever my table demands, pointing it at a company that compounds in triple digits at the quarterly level fails as a standalone test.
A named sell side house sits far above the current price. iM Securities analyst Lee Sang-soo published a buy opinion with a KRW 915,000 valuation on May 19, 2026, according to Korean press coverage in Money Today dated May 19, 2026; I have not read the report itself. That figure is 82.63 percent above the August 14 close and 154.87 percent above the KRW 359,000 the same house carried on July 31, 2025.
Ownership is the third argument. Samsung Electronics exercised a call option and took 35.0 percent on December 31, 2024, becoming the largest holder and consolidating the company as a subsidiary, as reported by ZDNet Korea. That followed KRW 59.0 billion for 10.22 percent in January 2023 and a further KRW 27.8 billion in March 2023, which together produced a 14.7 percent position. The relationship itself is being used as a valuation argument and I have nothing that contradicts it.
Balance sheet strength is the fourth. Total liabilities of KRW 9.47 billion against equity of KRW 133.83 billion at the end of 2025 gives a debt to equity ratio of 7.08 percent. This company can lose money for several more years without an immediate funding problem.
Scope is the fifth. At an extraordinary general meeting held on July 3, 2026, shareholders took up an amendment to the articles of incorporation adding, among other lines, the operation of unmanned and semi-unmanned stores using service robots, plus food service, general retail, and software and data analysis services, as reported by Edaily on May 21, 2026. The stated reason was building a robot-based automated store to improve amenities at the new headquarters. I do not read that as a revenue plan. It is still worth recording that a maker of collaborative robots has written into its charter an intention to operate the stores its robots go into.
Where the bull case runs thin for me
The only named forward valuation I could verify is that single iM Securities note. The other figure search returns is a KRW 210,000 valuation dated June 4, 2024 from Hi Investment Securities, and Hi Investment Securities is the former name of iM Securities. Two names, one house. For a company carrying KRW 9.72 trillion of market value, finding exactly one nameable forward view in public sources tells me the published support under this price is thinner than the price implies. I am recording that as a coverage gap.
What the ownership change did to Rainbow Robotics stock and the company’s equity
Here is something I built this session that I have not seen written elsewhere. I traced how much cash the transaction that made Samsung Electronics the largest holder actually put into the company, using the equity line.
Consolidated equity was KRW 130.66 billion at the end of 2023 and KRW 132.75 billion at the end of 2024, a rise of KRW 2.095 billion across the year. Net income for that same year was KRW 2.135 billion. The two are KRW 40 million apart. The 2024 increase in equity is explained almost entirely by what the company earned, which means essentially no new outside capital entered the accounts.
Compare 2023. Equity went from KRW 61.51 billion to KRW 130.66 billion, a rise of KRW 69.15 billion, in the year Samsung put in KRW 59.0 billion and then KRW 27.8 billion. That increase cannot be explained by earnings, because 2023 closed with a net loss of KRW 843 million.
Setting the two years side by side separates them cleanly. The 2023 transactions were share issuance that delivered cash to the company. The December 2024 call option exercise moved ownership. Reading the change of control as a change in the company’s funding position contradicts the equity line. One caveat stands: neither report I read states the share count acquired, the consideration paid, or whether new shares were issued. The equity series points to no new issuance, and I am leaving it at that because I did not open the filing.
Revenue grew, capital spending grew faster, and one quarter carried the year
Revenue moved from KRW 15.26 billion in 2023 to KRW 19.35 billion in 2024 to KRW 34.12 billion in 2025. Purchases of property and equipment over the same three years were KRW 3.23 billion, KRW 11.66 billion, and KRW 17.61 billion, which is 21.14 percent, 60.27 percent, and 51.60 percent of revenue. The first quarter of 2026 continued at 48.08 percent, KRW 4.36 billion against KRW 9.06 billion of revenue.
Free cash flow was negative KRW 3.70 billion in 2023, negative KRW 13.57 billion in 2024, and negative KRW 26.89 billion in 2025. The 2025 outflow of KRW 26.89 billion equals 78.81 percent of that year’s KRW 34.12 billion of revenue, and the three years total KRW 44.16 billion of cash leaving the business. Growth is real; cash is leaving faster than it arrives, and the question this raises is about the price attached to the growth.
| Discrete quarter | Revenue | Operating result | Net result |
|---|---|---|---|
| 2025 Q1 | KRW 4.18bn | KRW 1.40bn loss | KRW 0.73bn loss |
| 2025 Q2 | KRW 6.22bn | KRW 2.06bn loss | KRW 0.53bn loss |
| 2025 Q3 | KRW 10.70bn | KRW 0.72bn loss | KRW 0.03bn loss |
| 2025 Q4 | KRW 13.02bn | KRW 1.70bn | KRW 2.71bn |
| 2026 Q1 | KRW 9.06bn | KRW 1.57bn loss | KRW 0.90bn loss |
Split fiscal 2025 into discrete quarters and the first three sum to a net loss of KRW 1.286 billion while the fourth alone produced KRW 2.707 billion. The fourth quarter therefore accounts for 190.50 percent of the KRW 1.421 billion annual result, and its net figure exceeds its own operating profit of KRW 1.700 billion by KRW 1.007 billion. The KRW 73 of earnings per share printed on every screen comes from one quarter. Fourth quarter figures are calculated as the annual total minus nine month cumulative, since Korean filings do not publish them separately, and the first quarter of 2026 has already returned to a loss.
The same pattern runs through the operating line. Operating results were a KRW 44.59 billion loss in 2023, a KRW 2.98 billion loss in 2024, and a KRW 2.48 billion loss in 2025, summing to KRW 50.05 billion of operating losses across three years. Yet the net line was positive in 2024 at KRW 2.135 billion and in 2025 at KRW 1.421 billion. The gaps are KRW 5.114 billion and KRW 3.902 billion respectively, both my calculation. For a company holding roughly KRW 130 billion of equity with almost no debt, income arising outside operations covering the operating shortfall matches the size of those gaps. In the first quarter of 2026 that gap narrowed to KRW 0.665 billion and the quarter closed in loss.
What I left out
Three vendor fields went unused because I could not reproduce them. The EBITDA field reads 1,568 while the same screen shows a KRW 2.48 billion operating loss, and the units do not reconcile. The interest coverage field inverts in sign during an operating loss period. The quarterly operating and free cash flow fields do not reconcile against the annual fields, so I used annual figures only.
Items I could not confirm at all: the share count and consideration in the call option exercise, first half 2026 results, the third quarter reporting date, the actual baseline multiple the market assigns to listed robotics companies, and the composition of the KRW 23.43 billion operating loss booked in the first quarter of 2023. That last item drives the three year operating total, so it is the first thing I will open in the next filing.
My stance on Rainbow Robotics stock and the two conditions I set
Watchlist only. At KRW 9.72 trillion this is large enough that I did not apply my default observation stance by size alone; I worked through the indicators and arrived there. On my vendor’s seven point checklist the company passes one of seven, positive earnings per share, and that one item traces to a single quarter.
Price context: the close sits 48.83 percent below the 250 session high of KRW 979,000 and 100.80 percent above the 250 session low of KRW 249,500. It is 10.41 percent above the 20 day average of KRW 453,775, 6.73 percent below the 60 day average of KRW 537,167, and 17.83 percent below the 120 day average of KRW 609,675.
Two conditions would bring me in. One, the operating line turns positive on a discrete quarterly basis and stays positive for two consecutive quarters, because a single positive quarter in the fourth quarter of 2025 does not establish repeatability. Two, that profit originates in operations. I have already watched two full years in which only the net line was positive.
The condition that would make me abandon this analysis sits on my side of the table, not the company’s. The six cases rest on my assumption that this business eventually earns somewhere between 20x and 50x. If I find evidence that the actual baseline multiple for listed robotics companies falls outside that band, I do not adjust the cells. I discard the table and rebuild on the measured figure. That is the fourth time I have placed the disproving condition outside the company, and the fifteenth distinct way I have written one.
Two earlier pieces on this site approached robot expectations from the opposite direction. I looked at what remained of Hyundai Glovis after the robot premium drained out and at why I watched tariffs and margins at Hyundai Motor. Both watched expectation leaving a price. This one watches expectation sitting inside a price. The habit of rebuilding vendor multiples from source data is the same procedure I used when I followed the LG Uplus income statement line by line.
Sources and reference dates
Price and daily series come from Kiwoom data refreshed at 16:49 on August 14, 2026, based on the August 14, 2026 close. Financial history is consolidated data drawn from DART periodic filings, converted here from millions of won to billions. Share count, per share metrics, and the 2026 estimate come from Company Monitor as of August 13, 2026. The sell side figure is from Money Today, May 19, 2026, translated by me from the Korean; I did not read the underlying report. The ownership change is from ZDNet Korea, December 31, 2024. Peer figures are from the Teradyne page at stockanalysis.com, priced at 4:00 PM EDT on August 14, 2026. The exchange rate of KRW 1,418.6 per USD, August 13, 2026 close, is from KB Kookmin Bank’s August 14, 2026 daily note. Every figure marked as my calculation was computed by me from those sources.
- SFA Engineering Order Backlog Is Now Two-Thirds Robotics
- YC 232140 Memory Wafer Tester: Why Shares Fell With the Sector