LG Display Stock Has Five Second Quarters of Operating Loss
When a company’s earnings jump around, I stop reading the income statement year by year. I lay the same calendar quarter side by side. That habit has earned its keep in manufacturers that swing with the seasons, so before I looked at what the price implies, I sorted LG Display stock by quarter instead of by year. The close on Wednesday, 2026-09-02 was 9,010 won, or about USD 6.58 at the 1,368.7 won per dollar rate I use everywhere in this piece.
The sort came out cleaner than I expected. Every second quarter from 2022 through 2026 was an operating loss. Then I checked what sat behind each one, and that is why this piece exists. The fifth loss did not come from where the first four came from.
What five identical labels gave me
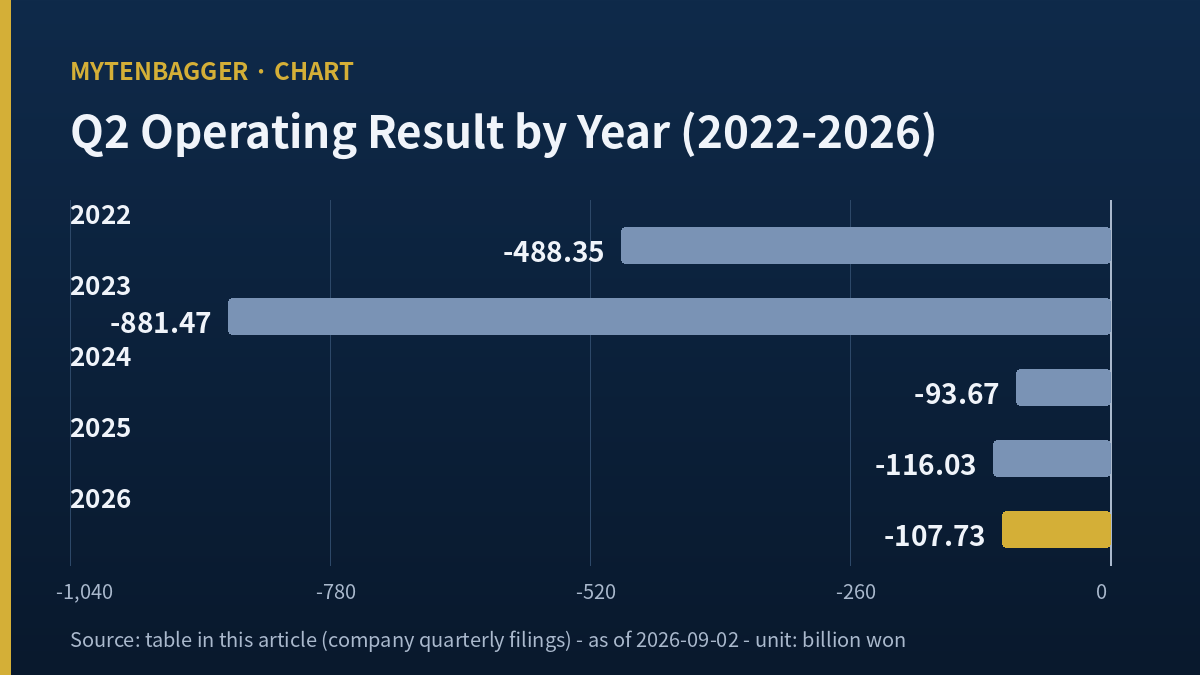
Q2 operating result → 2022 minus 488.35 billion won
Q2 operating result → 2023 minus 881.47 billion won
Q2 operating result → 2024 minus 93.67 billion won
Q2 operating result → 2025 minus 116.03 billion won
Q2 operating result → 2026 minus 107.73 billion won
The left column is the same five times over. Only the right column moves. And the bottom line turns into a 132.27 billion won profit once the roughly 240 billion won one-off charge the company disclosed is taken out. I do not own the shares, I have no order in, and I am watching.
Contents
Laying the same quarter side by side for LG Display stock
The quarterly figures below are consolidated single-quarter values from the Korean regulatory filing system. Flow items arrive as year-to-date cumulatives in Korean quarterly reports, so a single quarter has to be built by subtracting the previous cumulative, and the fourth quarter is the annual figure less the third-quarter cumulative.
Only the second quarter, five years running
| Fiscal year | Q2 revenue | Q2 operating result |
|---|---|---|
| 2022 | 5,607.32 billion won | minus 488.35 billion won |
| 2023 | 4,738.57 billion won | minus 881.47 billion won |
| 2024 | 6,708.20 billion won | minus 93.67 billion won |
| 2025 | 5,586.96 billion won | minus 116.03 billion won |
| 2026 | 5,612.06 billion won | minus 107.73 billion won |
The five second-quarter losses sum to 1,687.25 billion won and average 337.45 billion won. The average resembles none of the five actual years. The worst of them, 2023 at minus 881.47 billion won, is 9.41x the smallest, 2024 at minus 93.67 billion won. Five identical signs, and a nine-fold spread in size.
I stopped there. I had been about to turn a sign into a rule, and a spread that wide means the rule is not “the second quarter loses money.” It is “there were five years in which the second quarter lost money.” Those are different claims, and only one of them predicts anything.
The other three quarters do not hold their sign
To call a quarter seasonal I have to show the other three behave differently. So I built the same view for the first, third and fourth quarters.
Four quarters, five years, one consistent sign
| Quarter | 2022 | 2023 | 2024 | 2025 | 2026 |
|---|---|---|---|---|---|
| Q1 | +38.35 | minus 1,098.36 | minus 469.43 | +33.46 | +146.72 |
| Q2 | minus 488.35 | minus 881.47 | minus 93.67 | minus 116.03 | minus 107.73 |
| Q3 | minus 759.31 | minus 662.08 | minus 80.60 | +431.04 | not yet reported |
| Q4 | minus 875.74 | +131.74 | +83.11 | +168.51 | not yet reported |
Values are single-quarter operating results in billions of won. The first quarter is three profits and two losses. The fourth is one loss and three profits. The third ran red for three straight years and then turned to a 431.04 billion won profit in 2025, which is the largest single-quarter operating profit this company has posted in five years. The second quarter is the only one whose sign holds across all five years. I had assumed the third would look similar before I built the table, and it does not.
The fifth loss did not come from where the first four came from
At the results briefing on 2026-07-22 the company reported second-quarter revenue of 5,612.1 billion won, an operating loss of 107.7 billion won, and a net loss of 418.8 billion won. In the same briefing it attributed roughly 240 billion won of one-off cost to workforce efficiency measures including a voluntary retirement program, and said that excluding that charge the underlying business was profitable. The Korean trade press outlet TheElec carried the full conference call transcript and Dailian reported the same figures. Both are Korean-language sources and the wording here is my rendering, not a quotation of an English original.
The arithmetic is plain. An operating loss of 107.73 billion won plus 240 billion won is a 132.27 billion won profit, roughly USD 96.64 million. Only the fifth row flips.
The fourth one was strange in the opposite direction
The 2025 second quarter was a different animal again. On that year’s call the company reported revenue of 5,587.0 billion won, an operating loss of 116.0 billion won, and net income of 890.7 billion won. It lost 116 billion won at the operating line and earned 890.7 billion won at the bottom, and the company attributed that to improved foreign exchange results and a gain on the sale of its stake in the Guangzhou liquid crystal plant, booked in other income. On the operating line the 2025 and 2026 second quarters look like siblings. One line below, they point opposite ways.
The 2022 and 2023 second quarters sit inside the liquid crystal price collapse, and in those two years almost every quarter ran red, not merely the second. The 2024 second-quarter loss of 93.67 billion won is the smallest of the five.
So behind five identical signs sit a price collapse, a price collapse, a shallow loss, a quarter that other income turned upside down, and a loss manufactured by a one-off charge. I could not find a single cause that covers all five. That is why I keep the table but refuse to forecast from it.
What LG Display stock loses between the operating line and the bottom line
First-half 2026 revenue was 11,146.1 billion won, about USD 8.14 billion, with an operating profit of 38.99 billion won. The comparable half of 2025 was an operating loss of 82.57 billion won, so the operating line improved by 121.56 billion won. Several Korean outlets called it the first profitable first half in five years, and that description is accurate.
The net line went the other way. Profit attributable to owners of the parent for the same half was minus 975.33 billion won, about USD 712.60 million. The comparable half of 2025 was a positive 603.09 billion won. That is a 1,578.42 billion won deterioration at the bottom while the operating line improved by 121.56 billion won.
One line accounts for most of the distance
The distance between the consolidated half-year operating profit of 38.99 billion won and the consolidated half-year net loss of 994.55 billion won is 1,033.54 billion won, roughly USD 755.12 million. Interest expense for the same half was 901.14 billion won, or about USD 658.39 million. That single item accounts for 87.19 percent of the 1,033.54 billion won distance.
The direction is the part that bothers me. Interest expense was 774.56 billion won in the first half of 2025 and 901.14 billion won in the first half of 2026, an increase of 126.58 billion won or 16.34 percent. Over the same twelve months total liabilities fell from 20,385.61 billion won to 19,850.95 billion won, a decrease of 534.66 billion won or 2.62 percent. The debt got smaller and the interest bill got larger. The company reported gross borrowings of 13,396.0 billion won, net borrowings of 11,944.0 billion won, and a debt-to-equity ratio of 260 percent as of the second quarter of 2026.
This is the same reading motion I used on a semiconductor equipment name whose cheapest multiple sat next to its weakest return. A single favorable line does not settle a company.
What breaks my reading of LG Display stock
A watching stance with no opposing evidence behind it is not a stance at all. The items that argue against me come first.
One. The company guided third-quarter revenue per square meter to rise by a high-teens percentage from the prior quarter. Second-quarter 2026 revenue per square meter was USD 1,079 on shipments of 3.6 million square meters. That figure is the company’s own disclosure in dollars and I have not converted it. If prices move that much, the operating line improves faster than I have assumed.
Two. Kang-ho Park at Daishin Securities, in a 2026-07-23 note, estimated a third-quarter operating profit of 435.9 billion won and a second-half operating profit of 848.8 billion won. If those land, my five-year table contributes nothing to the next quarter’s judgment.
Three. OLED reached 57 percent of revenue in the second quarter of 2026, up from 56 percent a year earlier. By product the mix was 36 percent IT, 32 percent mobile and other, 21 percent television, and 11 percent automotive. Reading this company through its liquid crystal era cost structure produces the wrong answer.
Four. Korean credit assessment work cited in the Korean press, from NICE Investors Service, holds that given Apple’s supply chain diversification the second source is likely to be this company. North American flagship customer volume is the first reason both brokerages give for a second-half recovery.
Five. Second-quarter 2026 EBITDA was 872.0 billion won on a 15.5 percent margin, per the company. In a capital-intensive business carrying heavy depreciation, the operating line alone is not always the right lens.
Six. Asset efficiency improved. Total assets fell from 35,686.02 billion won at the end of 2022 to 26,916.70 billion won at the end of 2025, a decrease of 24.574 percent, while annual revenue over the same three years moved from 26,151.78 billion won to 25,810.08 billion won, a decrease of only 1.307 percent. A quarter of the balance sheet went away and the revenue barely moved.
On the other side, Jung-hoon Jang at Samsung Securities cut his full-year estimate by 15 percent from his prior figure and wrote that customer pressure on panel prices in the second half cannot be ruled out. Hyun-woo Park at Shinhan Investment wrote that earnings visibility had fallen below his earlier expectation. Chief financial officer Sung-hyun Kim named semiconductor supply issues, geopolitical issues, and the resulting raw material price increases as third-quarter uncertainties.
Which year’s earnings the LG Display stock multiple is using
The price-to-earnings multiple on my data screen reads 19.91. Having just confirmed a loss-making half year, I had to find out which period that number leans on. Market capitalization of 4,505.0 billion won divided by 19.91 gives 226.27 billion won. Profit attributable to owners of the parent for fiscal 2025 was 226.31 billion won. The gap is 0.02 percent.
Reproducing each screen value and dating it
| Screen value | My recalculation | Difference | Which period |
|---|---|---|---|
| P/E 19.91 | 4,505.0 / 226.31 = 19.906 | 0.02% | fiscal 2025 profit to owners |
| Book value per share 13,208 won | 6,604.12bn / 500m shares = 13,208.248 | 0.0019% | fiscal 2025 year-end equity to owners |
| P/B 0.68 | 4,505.0 / 6,604.12 = 0.6821 | reproduced | fiscal 2025 year-end equity to owners |
| Return on equity 3.4 | 226.31 / average 6,573.19 = 3.443% | reproduced | average of 2024 and 2025 year-ends |
| Debt to equity 259.5 | 19,850.95 / 7,649.64 = 259.50% | reproduced | consolidated, end of June 2026 |
Four of the five rows lean on fiscal 2025 or its year-end. Only the last uses June 2026. Two different periods live on one screen. The 226.31 billion won that the 19.91 multiple rests on has already been erased 4.31x over by the 975.33 billion won first-half loss to owners. I do not read that multiple as a description of the company’s current state.
The book multiple has the same property. Recalculated on equity to owners of 6,301.01 billion won at the end of June 2026, it becomes 0.7150. The price does not have to move at all for that number to climb: equity fell 303.12 billion won over the half, and the multiple rose 4.81 percent as a result.
A panel maker that finished the same transition first
For a global comparison I wanted a panel maker that went through the liquid crystal collapse ahead of this one and whose outcome is already settled. Sharp Corporation, listed in Tokyo under 6753, fits that description. It closed at 643.10 yen on 2026-08-27 with a market capitalization of 416.14 billion yen on 649.31 million shares, trailing revenue of 1.86 trillion yen, trailing net income of 23.31 billion yen, and trailing earnings per share of 35.90 yen against a stated price-to-earnings multiple of 17.85.
I checked those against each other before using them. Price times share count gives 417.57 billion yen against the stated 416.14 billion, a drift of 0.344 percent. Price divided by earnings per share gives 17.914 against the stated 17.85, a difference of 0.36 percent. Net income divided by share count returns 35.90 yen exactly.
I am deliberately not converting any of those yen figures. This piece uses one exchange rate, the 1,368.7 won per dollar close from the Seoul market on 2026-09-02, and adding a second currency conversion would make the numbers in this article harder to audit. What travels across currencies without conversion is the multiple itself. Sharp carries 17.85x on a trailing period that includes its most recent quarters. This company carries 19.91x on a fiscal year that its own next two quarters have already overwritten. The two numbers look close and they are not measuring the same thing, and that difference is the whole reason I built the table above. Sharp’s segment composition is something I did not verify beyond the summary screen, and I am not resting anything on it.
Two named LG Display stock estimates that differ by 178 billion won
Forward coverage came from two named sources. Both are constructive on the company and they disagree on size.
Both sets of numbers close on their own arithmetic
| Item | KB Securities, Dong-won Kim | Daishin Securities, Kang-ho Park |
|---|---|---|
| Note date | 2026-04-30 | 2026-07-23 |
| 2026 revenue estimate | 23,881 billion won | 25,410 billion won |
| 2026 operating profit estimate | 1,066 billion won | 888 billion won |
| Second-half operating profit | 963.8 billion won | 848.8 billion won |
| Stated valuation | 17,000 won | 17,000 won |
I checked both for internal consistency. Daishin’s 848.8 billion won second half is a 41.57 percent increase over the actual 599.55 billion won the company earned in the second half of 2025, which matches the 41.6 percent printed in the note. Its full-year 888 billion won equals the actual first half of 39.0 billion won plus that second half, within 0.2 billion won. KB’s 963.8 billion won second half is a 60.76 percent increase over the same 599.55 billion won base, matching the 61 percent in that note. Neither set contradicts itself.
What separates them is scale. The 2026 operating profit estimates stand at 1,066 billion won and 888 billion won, a gap of 178 billion won or 16.7 percent. The earlier note predates the second-quarter results and the later one follows them by a day, which explains the direction, and the 15 percent cut at Samsung Securities is a similar magnitude.
That gives me one testable condition. With the first half now fixed at 38.99 billion won, KB’s full-year 1,066 billion won requires 1,027 billion won in the second half, which is 1.713x the 599.55 billion won the company actually earned in the second half of 2025. Both houses state 17,000 won as their valuation. I record that and I do not adopt it as my own.
Values I decided not to use
Anything I could not reproduce from primary inputs stayed out of the body. A blank is better than a plausible wrong number.
| Item | Screen value | Reason for exclusion |
|---|---|---|
| One, three, six and twelve month returns, and the 20, 60 and 120 day moving averages | supplied | the screen’s current price of 9,010 won and its time series latest price of 9,140 won disagree, so any series built on the second base is out |
| Dividend history | 500 won for each of the last three years | the regulatory history in the same response puts the last dividend at 650 won for fiscal 2021 and flags dividends as unavailable |
| Dividend yield 7.21 | supplied | computed on the fiscal 2021 payment, so it is not a current yield |
| Enterprise value 3.2 | supplied | an impossible order of magnitude for a company at 259.5 percent debt to equity |
| Raw payout ratio 56.1 | supplied | cannot be reproduced by any route when there is no dividend |
The EBITDA field is empty on that screen, which is normal and not a defect, because the Korean filing schedule does not carry depreciation as a line item. I used the 872.0 billion won the company disclosed instead, and I labeled it as the company’s figure where it appears. I also kept the 250-day high of 17,950 won and low of 8,120 won, since both reproduce against the 9,010 won close: the price sits at 50.19 percent of that high, which the screen rounds to 50.2 percent, and 10.96 percent above that low, which the screen rounds to 11.0 percent. I could not establish whether the high is a closing price or an intraday one.
My stance and the conditions that break it
I do not own it, I have no order in, and I am watching. At 4,505.0 billion won of market value, size is not what keeps me out. Two things do. The operating improvement does not reach the bottom line, where 1,033.54 billion won went missing over a half year and 87.19 percent of it was interest. And the tool I brought to this company, the seasonal read, did not work here.
The checkpoint is the third-quarter report, whose statutory filing deadline is 2026-11-15.
Four conditions
| Number | Condition | When it can be checked |
|---|---|---|
| 1 | Third-quarter 2026 single-quarter operating profit exceeds 435.9 billion won | third-quarter report, due 2026-11-15 |
| 2 | Third-quarter 2026 profit to owners turns positive | same report |
| 3 | Third-quarter 2026 interest expense falls below 450.57 billion won | same report |
| 4 | The second quarter of 2027 is not a sixth operating loss | mid-August 2027 |
The 450.57 billion won in the third condition is half of the 901.14 billion won first-half interest expense, and I am flagging it as an arithmetic split of a half-year figure, not something the company reported. The habit of reading the funding lines before the earnings lines is the same one I applied when I waited for a second quarter instead of chasing a contract win.
The paragraph I delete first if I am wrong
This piece began by bringing one tool to a company and ended by finding that the tool does not fit. What remains is the question of which paragraph fails first, so I am setting the order now so that I am not deciding it under pressure later.
First to go is the five-year second-quarter table. If the second quarter of 2027 is not a sixth loss, those five rows were five separate events and there is no reason to keep the table standing.
Second is the section that reverse-engineers the screen multiples. If profit to owners turns positive in the third quarter of 2026, the period those multiples lean on changes and the reverse-engineering has to be redone.
Third is the section that explains the gap between the operating line and the bottom line through interest. If third-quarter interest expense comes in below 450.57 billion won, that explanation carries less weight.
Last to go is one sentence. The 107.73 billion won second-quarter 2026 operating loss becomes a 132.27 billion won profit once the roughly 240 billion won one-off charge the company disclosed is removed. That sentence stays true whichever of the four conditions fires. Of everything I checked in this company, it was the only thing that no condition touches.

Sources
- TheElec, full transcript of the 2026 second-quarter earnings call, 2026-07-22 (Korean)
- TheElec, full transcript of the 2025 second-quarter earnings call, 2025-07-24 (Korean)
- Dailian, second-quarter operating loss of 107.7 billion won, 2026-07-22 (Korean)
- HuffPost Korea, first-half turnaround and component cost inflation, 2026-07-23, carrying the Samsung Securities and Shinhan Investment comments (Korean)
- KB Securities, Dong-won Kim, second-half earnings improvement outlook, 2026-04-30 (Korean)
- Daishin Securities, Kang-ho Park, third-quarter turnaround results comment, 2026-07-23 (Korean)
- Dealsite, board approval of a 1,360 billion won rights offering, 2023-12-18 (Korean)
- LG, 2025 second-quarter results release (Korean)
- Korean business daily at mt.co.kr, Seoul daytime session close of 1,368.7 won per dollar, 2026-09-02
- Stock Analysis, Sharp Corporation summary, close of 2026-08-27
Quarterly and annual financials come from an indicator server that loads consolidated statements from the Korean regulatory filing system, and single-quarter values are cumulatives less the prior cumulative. Price and multiples are on the Wednesday 2026-09-02 close from a Kiwoom data feed, refreshed at 17:02 local time that day. The exchange rate used throughout is 1,368.7 won per dollar, the Seoul daytime session close on 2026-09-02.
Related reading