TK Corporation Stock: Alone in the Gap Its Peers Left
I did something mechanical on the night of Tuesday, September 8, 2026, and it produced the only question in this entry worth asking. I took five listed companies that make fluid-handling hardware, pulled the last full fiscal year each of them had reported, divided operating income by revenue, and sorted the results from high to low. The point was to see where a small Korean forging company landed among them.
The sorted list came back with a hole in the middle of it.
Three questions I opened this file to answer:
1. Where does a 13.03 percent operating margin sit among the companies that do roughly the same work?
2. Did it always sit there?
3. What is the company promising to pay out while that number moves?
Contents
What TK Corporation stock is attached to
TK Corporation trades on the KOSDAQ under 023160. KOSDAQ is the smaller of South Korea’s two main boards, the venture and mid-cap tier that sits beside the larger KOSPI, and it is where a lot of the country’s industrial component suppliers live. The company forges pipe fittings, the elbows and tees and reducers that connect large-diameter piping in refineries, petrochemical complexes and ships.
The mix is narrow. For fiscal 2025 the company reported that plant equipment accounted for 89.44 percent of revenue, battery-industry equipment for 10.13 percent, and everything else for 0.43 percent, figures carried in Korean coverage of its annual filing (Daily Invest, March 23, 2026). Roughly nine tenths of what this company does is one thing.
The market values it at 685.5 billion won as of the Tuesday, September 8, 2026 close, or about 511 million dollars at 1,340.5 won per dollar, the rate I last confirmed on Monday, September 7, 2026. That is small enough that no American depositary receipt exists for it. A US-based reader who wants exposure has to go through a broker with direct Korea Exchange access, and the Korea funds that trade in New York are built around the large caps, so I could not confirm whether this name appears in them at all. I am not going to guess at index membership I have not checked.
I do not own this one and I have no order sitting on it. What follows is the record of an afternoon’s arithmetic.
The sorted list behind TK Corporation stock had a hole in it
Here are the five companies, each at its own latest reported fiscal year. I have not converted any currency. Each row is printed in the currency that company reports in, and the fiscal year end is printed beside it because the periods are not the same length of calendar away from today. The margin column is my own division of the two columns to its left.
| Company | FY end | Revenue | Operating income | Currency | Margin |
|---|---|---|---|---|---|
| Mueller Industries (NYSE: MLI) | 2025-12-27 | 4,178.5 m | 958.5 m | USD | 22.94% |
| Advanced Drainage Systems (NYSE: WMS) | 2026-03-31 | 3,050.4 m | 619.2 m | USD | 20.30% |
| Watts Water Technologies (NYSE: WTS) | 2025-12-31 | 2,438.5 m | 448.1 m | USD | 18.38% |
| TK Corporation (KOSDAQ: 023160) | 2025-12-31 | 296,966 m | 38,735 m | KRW | 13.03% |
| KITZ Corporation (TYO: 6498) | 2025-12-31 | 176,682 m | 15,454 m | JPY | 8.75% |
| Kurimoto, Ltd. (TYO: 5602) | 2026-03-31 | 128,126 m | 8,059 m | JPY | 6.29% |
Sources: company results releases, retrieved September 8, 2026. Mueller, its own fiscal 2025 fourth-quarter release; Watts Water, its full-year 2025 release; Advanced Drainage Systems, its fiscal 2026 release; KITZ, its December 2025 financial summary; Kurimoto, its March 2026 financial summary on the company IR library. TK Corporation figures come from the Korean financial data screen at Kiwoom’s company monitor, consolidated basis, in millions of won. All margin figures in the last column are mine.
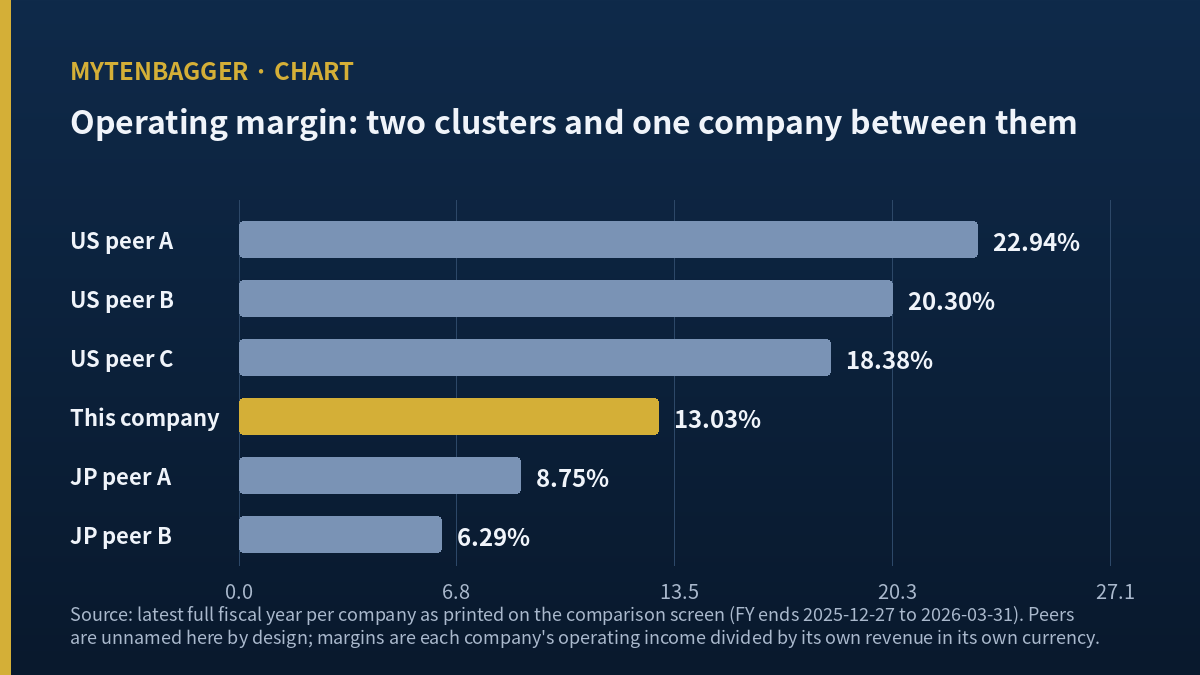
Read the margin column downward. It runs 22.94, 20.30, 18.38, then 13.03, then 8.75, 6.29. The three American names occupy a band of roughly four and a half points. The two Japanese names occupy a band of about two and a half points. Between 18.38 and 8.75 there is a stretch of just under ten points where nothing sits except the Korean company.
I want to be precise about what that does and does not mean. It is not a ranking of quality, and this table cannot produce one. The revenue columns are printed in three currencies that I have deliberately left unconverted, so no reader should compare the sizes of these businesses from this table, and I am not comparing them either. Two of the five close their books in March while the rest close in December. What the table supports is one narrow observation: on the single ratio that is computed the same way in every currency, the distribution is bimodal, and one company falls in the empty part.
What TK Corporation stock sells, and why that lands it in the gap
The clusters are not mysterious once you look at end markets. Mueller sells into residential and commercial building plumbing and, since a 2024 acquisition, into electrical distribution products. Advanced Drainage Systems makes recycled-resin stormwater pipe for civil and agricultural sites. Watts Water sells valves and flow control into building services. All three sell branded product into replacement-heavy building markets where specification lock-in supports pricing.
The two Japanese names sit at the other end for equally structural reasons. KITZ makes valves for plant, semiconductor and energy customers and carries a copper alloy materials business alongside. Kurimoto’s core is ductile iron pipe for municipal water infrastructure, which is funded by public budgets and not by private capital spending.
The Korean company is between those two worlds, and its end market explains why. Forged fittings for refinery and shipyard projects are engineered-to-order industrial parts sold into engineering and construction procurement, which is neither a branded replacement market nor a public-budget one. So the position in the gap is legible. What I did not expect was the direction of travel.
I nearly wrote a word the table cannot support
I deleted the phrase. Mid-pack means the middle of a distribution, and it implies there is a distribution to be in the middle of. There is not one here. There are two groups and an empty stretch, and a company alone in an empty stretch is not in the middle of anything. It is simply unattached to either cluster.
That distinction changed how I read the next table. If this company belonged to a peer group, I could reason about it by reference to that group. Since it does not belong to either one, the only meaningful comparison left is against itself over time.
TK Corporation stock and four years of its own margin
Here is the same ratio for the same company over four consecutive fiscal years, on the consolidated basis, in millions of won. The margin column is again my own division.
| Fiscal year | Revenue | Operating income | Margin | Return on equity | Debt to equity |
|---|---|---|---|---|---|
| 2022 | 249,700 | 45,400 | 18.18% | 7.81% | 13.31% |
| 2023 | 312,100 | 57,700 | 18.49% | 10.92% | 8.85% |
| 2024 | 266,800 | 39,900 | 14.96% | 8.20% | 8.34% |
| 2025 | 296,966 | 38,735 | 13.03% | 10.73% | 10.63% |
Source: Kiwoom company monitor annual financial summary, consolidated, retrieved September 8, 2026. Margins are my division of the two revenue and operating income columns; the return and leverage columns are as printed on that screen. I checked the leverage column against total liabilities over total equity for all four years and it reconciles to within a tenth of a point.
In 2022 an 18.18 percent margin would have placed this company inside the American cluster, a fifth of a point above where Watts Water sits today. In 2025 it sits 5.15 points lower and belongs to neither group. The company walked out of one cluster and stopped before reaching the other.
Now put that against how little the peers moved over the same stretch. Comparing each peer’s latest year with the one before it: Mueller went from 20.44 to 22.94 percent, Watts Water from 17.33 to 18.38, Advanced Drainage Systems from 22.64 to 20.30, KITZ from 8.27 to 8.75, and Kurimoto from 6.26 to 6.29. All five of those figures are my own division of the reported revenue and operating income for each year. The largest single move among them is 2.34 points, and the ordering of the five does not change between the two years.
The Korean company moved 5.15 points across its own four years. Nobody else in the table moved half that far.
The promise TK Corporation stock carries while that number falls
The interesting part is what the company committed to during the same period. In a corporate value enhancement plan disclosed in March 2026 and reported in Korean trade press, it set out to buy back and cancel 10 billion won of its own shares within 2026, to return 30 percent of net income to shareholders across 2024 through 2026 and 45 percent across 2027 through 2029, and to push its price-to-book ratio above one over the medium term (Digital Today, March 13, 2026, reporting the filing).
Part of that is already done. The company cancelled 632,758 shares on Friday, February 6, 2026, at a stated value of 11.22 billion won, which Korean press put at 2.39 percent of the share count then outstanding (Edaily, January 30, 2026, reporting the cancellation filing). The count went from 26,500,000 to 25,867,242, and I can check that: the difference is exactly 632,758.
The cash dividend moved further. Total dividends declared went from 6,466,810,500 won for fiscal 2024 to 13,838,974,470 won for fiscal 2025, an increase of 114 percent, both figures from the same disclosure. Payout ratio across the four years ran 12.29, 7.98, 14.40 and 21.67 percent on the company monitor screen, so the last year roughly doubled the prior one. Forward consensus on that screen carries a 2026 dividend per share estimate of 623 won, against estimated earnings per share of 3,157 won and book value per share of 26,975 won.
None of that is funded by borrowing. Debt to equity has run between 8.34 and 13.31 percent over four years, and Korean coverage of the half-year filing states the company carries no interest-bearing debt (Lead Economy, September 7, 2026). This is a balance sheet that can pay for a promise like this for a long time regardless of what the margin does.
Which profit line the 45 percent applies to
The payout target is expressed as a share of net income, and that matters here more than it usually would. Net income at this company has been running well above operating income, and the gap is not small or occasional. I could not open the audited notes that would explain where the non-operating income comes from, so I am not going to describe what it is. What I can say is that a payout ratio anchored to net income at a company whose net income is substantially non-operating is a promise whose size depends on a line I have not been able to read.
That does not make the promise unreliable. It makes it a different promise from the one it looks like at first glance.
Where TK Corporation stock trades against all of this
The KOSDAQ close on Tuesday, September 8, 2026 was 26,500 won, and 25,867,242 shares at that price give a market value of 685,481,913,000 won, which matches the market capitalization printed on the same screen to the nearest hundred million won. Against the 2026 consensus estimates above, that price is 0.98 times estimated book value, as printed on the consensus screen and not computed by me.
Three brokerages carry the name and all three published objectives sit above the current price. Those are their figures and I have not adopted any of them, so I am deliberately leaving the levels out of this entry. What I want on the record is the shape of the disagreement: the highest of the three is a multiple of the lowest large enough that the three houses cannot be describing the same business, and that shape is the part a reader can use.
A comparable spread has shown up before in this journal. When I looked at Doosan Enerbility, the price had halved while the published analyst objective sat near double it, and my conclusion there was that the width of a gap tells you nothing until you know what is expected to close it.
The nearest Korean comparable to TK Corporation stock
There is one domestic company doing close to the same work, and its recent numbers are a useful check on whether the margin story here is company-specific or sector-wide. Sungkwang Bend reported first-quarter 2026 shipbuilding and offshore revenue of 5.4 billion won, down 57.5 percent year on year, and Korean coverage of its results named tariff cost recognition timing and inventory valuation provisions among the pressures on the sector (Bloter, July 10, 2026). For fiscal 2025 that company reported revenue of 245.7 billion won and operating income of 42.0 billion won.
The same article records that its order intake actually rose 18.1 percent year on year in the same quarter. Orders up, one segment’s revenue sharply down, margin pressure named in the commentary. I wrote about that company’s capital spending separately, and I am borrowing only the sector datapoint here.
What this tells me is that the compression is not unique to one company’s execution. Something is squeezing Korean forged-fittings makers as a group, and a table of American building-products companies was never going to show it.
Values I looked at and left out
- Order backlog. This company does not disclose one. Analysts publish annual order intake instead, so I have no way to know how much of the next year’s revenue is already contracted.
- Regional revenue split. Korean coverage carries amounts for the Americas and the Middle East, but the percentages attached to them imply a base figure that does not match the period the article names. I dropped the percentages instead of passing along a share I cannot reconstruct.
- Trailing price to earnings. Different Korean data screens show materially different multiples for this company on the same day because they use different net income periods. I used only the consensus forward figures, and I have labeled them that way.
- Cost of goods detail. The half-year filing would show input cost movement directly. I could not reach the filing itself, and Korean secondary coverage did not summarise it.
- Peer balance sheets. The five comparison companies are compared here on one ratio only. I did not pull their leverage or returns, so nothing in this entry ranks them on financial strength.
My position on TK Corporation stock and what would change it
I hold none of this and have no order working. The company is well outside the top hundred Korean listings by market value, and names in that range go on my watch list, and my account is a separate question. That rule is not up for renegotiation on the strength of one interesting table.
What I did take from the exercise is a rule about tables, and not one about this company. When a sorted list of comparables comes back in clusters with a gap between them, I stop treating position in the list as information and start reading the sorted company against its own history instead. A gap in a distribution is a statement about the distribution, not about whatever happens to be sitting in it.
Two things that would end the watch
The first is the full-year 2026 margin, which will be readable once the annual filing lands in the first quarter of 2027. If the annual figure comes in below 13.03 percent, that is a third consecutive year of decline and the walk out of the American cluster becomes a trend, no longer an episode. If it recovers above 15 percent, I was reading a two-year cost cycle as something structural and I will say so.
The second is the buyback. The value enhancement plan committed to 10 billion won of repurchase and cancellation within 2026. I could not find a trust contract filing for it as of September 8, 2026. If the year closes without that repurchase executed, the 45 percent payout commitment for 2027 through 2029 loses most of its evidentiary weight with me, because a company that misses the near commitment has not yet earned credit for the far one.
Seventeen ways this entry could be wrong
- A five-company comparison set is small enough that the gap could be an artefact of which five I picked.
- I chose the peers myself. A different selection of fluid-handling manufacturers might fill the empty stretch entirely.
- Two of the five close their fiscal year in March. The calendar distance from today is not the same across rows.
- Advanced Drainage Systems closed a large acquisition inside its latest fiscal year, and the associated costs pulled its operating income down. Its margin is not a clean run rate.
- Watts Water made three acquisitions in the last quarter of its latest year, which affects the comparability of its figures too.
- Operating income definitions differ by reporting standard. Korean, US and Japanese filers do not draw that line in identical places.
- Third-party data aggregators showed operating income figures for the American names that differed from the companies’ own releases. I used the releases, but that discrepancy means the number is more contestable than it looks.
- A single ratio is a thin basis for grouping companies. Margin structure follows business model, and these five have five different ones.
- Battery-industry equipment is about a tenth of the Korean company’s revenue and none of the peers have a comparable line at all.
- The four-year margin path covers a period that includes a global capital spending cycle. Some of the decline may be cyclical and have nothing to do with competition.
- Return on equity actually improved from 8.20 to 10.73 percent in the year the margin fell. If I weighted that line instead, this entry would read differently.
- The dividend increase and the share cancellation are real cash returned. An entry built around a falling ratio can make a company look worse than its shareholders experienced.
- I could not read the audited notes on non-operating income, which means my caveat about the payout base is itself uncertain.
- Sungkwang Bend is one comparison company, and one company is not a sector.
- Three analysts publish objectives well above the current price. They have access to management and I do not.
- The balance sheet carries no interest-bearing debt, which gives this company far more time to fix a margin than a leveraged peer would have.
- I built this entry around a hole in a sorted list. That is an aesthetically satisfying starting point, and aesthetically satisfying starting points are exactly the ones I should distrust.

What I will check next
I started this file expecting a spectrum and got two clusters. That result reframed everything downstream of it: because the company has no group to be measured against, the four-year path of its own margin became the only comparison with any content in it, and that path shows a 5.15 point decline while every peer in the table moved less than half as far.
Set against that decline is a company with no interest-bearing debt, a cancelled 2.39 percent of its own shares, a dividend that more than doubled in a year, and a stated intention to pay out 45 percent of profit from 2027. Both of those things are true at once. My reading is that the balance sheet buys the company time to fix the margin, and that nothing in this table tells me whether it will.
So I am watching and I am not buying, and I have deliberately reduced what I need to check to two items, on the assumption that I will not remember writing this when the time comes. One: the full-year 2026 operating margin against 13.03 percent. Two: whether the 10 billion won repurchase was executed inside 2026. Both are visible from a single filing each.
Prices and multiples in this entry reflect the Tuesday, September 8, 2026 Korean market close as I checked them while writing. This piece publishes after it was written, so quoted levels can differ from live prices by the time you read it. The Korean won is the reference currency throughout; the single dollar figure in this entry uses 1,340.5 won per dollar, the rate I last confirmed on Monday, September 7, 2026, and it is approximate. Figures drawn from Korean-language sources are described in my own words without direct quotation, since translating a quotation into English can make it look like an English original.