SM Entertainment Stock: Equity Up 64%, Share Count Down
Between the close of 2024 and the close of 2025, shareholders’ equity at SM Entertainment grew by 529.6 billion won. Over the same twelve months the number of shares outstanding fell by 458,937. Two directions, one year, one company. I do not own this stock and I have no order working in it, but a year that moves those two lines in opposite directions is a year I want dated before I accept any multiple printed on top of it.

Contents
What SM Entertainment stock costs on September 9, 2026
SM Entertainment trades on KOSDAQ under the ticker 041510. KOSDAQ is the junior board of the Korea Exchange, the venue where most Korean mid-cap growth names list, and it sits alongside the senior KOSPI board and is not underneath it in any regulatory sense. Foreign investors held 31.79 percent of the register at the date below, which is high for a KOSDAQ name and tells me the free float is already well traveled by non-Korean money.
| Item | Value |
|---|---|
| Close, September 9, 2026 (Wed) | 82,700 won |
| Market capitalization | 1,893.4 billion won (about US$1.41 billion) |
| Shares outstanding | 22,894,690 |
| Paid-in capital | 11,447,345,000 won |
| Par value | 500 won |
| Foreign ownership | 31.79 percent |
Before I use any of this I divide the paid-in capital by the share count. It gives 500.0 won exactly, which matches the stated par value and tells me there is no preferred class and no split sitting between these two lines. That check takes ten seconds and it has saved me from writing a wrong market capitalization more than once, because a per-share figure computed on one share count and a total computed on another will disagree quietly and never announce itself.
Equity grew by 529.6 billion won in one year
Here are four year-ends of the balance sheet, in billions of won. I converted nothing in this table; these are the figures as the Korean financial data screen carries them, and the last two columns are ratios I recomputed myself.
| Year-end | Assets | Liabilities | Equity | Debt ratio | Return on equity |
|---|---|---|---|---|---|
| 2022 | 1,463.0 | 576.9 | 886.1 | 65.10% | 12.18% |
| 2023 | 1,541.0 | 631.6 | 909.4 | 69.45% | 12.30% |
| 2024 | 1,419.1 | 590.0 | 829.1 | 71.17% | 2.64% |
| 2025 | 2,007.7 | 649.0 | 1,358.7 | 47.76% | 41.65% |
The 2025 column is the one that does not belong with the other three. Assets grew by 588.6 billion won, liabilities by only 59.0 billion, and equity by 529.6 billion. Three of those four years show a company whose balance sheet barely moves; the fourth shows one that added more equity in twelve months than it had added in the previous three combined. The debt ratio dropped 23.41 percentage points in a single step, which is a larger single-year move than any pair of rows above it produces.
The 2025 balance sheet, as one identity
| Change in liabilities | +59.0 billion won |
| Change in equity | +529.6 billion won |
| Sum of the two | +588.6 billion won |
| Change in assets | +588.6 billion won |
The two sides close to the won. Almost all of what arrived on the asset side in 2025 arrived as equity, with only 59.0 billion of it as borrowing.
The identity that had to close before I wrote anything
I ran the same arithmetic on the two 2026 quarters, because an identity that closes once can close by coincidence. At the end of the first quarter, assets were up 2.3 billion won on the year-end, liabilities up 7.1 billion, and equity down 4.8 billion; 7.1 minus 4.8 gives 2.3. At the end of the second quarter, assets were down 0.9 billion against the first, liabilities down 32.7 billion, and equity up 31.8 billion; those close as well. Three periods, three closures, so the figures I am about to lean on are internally consistent even where I cannot yet explain them.
SM Entertainment stock and a share count going the other way
While equity was climbing, the share count was doing the reverse. The company reported 23,804,501 shares at the end of 2022 and 23,830,901 at the end of 2023, a small increase. Then it reported 23,353,627 at the end of 2024 and 22,894,690 at the end of 2025. That is a fall of 477,274 shares in one year and 458,937 in the next, or 936,211 shares in total, which is 3.929 percent of the 2023 count.
I want to be careful about what I claim here. I can see that the count fell in two consecutive years. I did not find the filing that says why, and I am not going to put a retirement label on a number whose cause I have not read. What I can say is that the number underneath every per-share figure in this company got smaller two years running while equity got larger, and that combination pushed book value per share up by 50.82 percent over the 2025 financial year, from a base of 29,037 won. The equity rose 63.88 percent; the per-share figure rose less because part of the equity increase is not attributable to the shares I am dividing by.
A Korean label I looked at in July moved its price and its reported quarter in opposite directions too, though for reasons that sat entirely above the operating line. My notes on that quarter ended somewhere quite different from where this one is going.
SM Entertainment stock and a debt ratio that moved twice
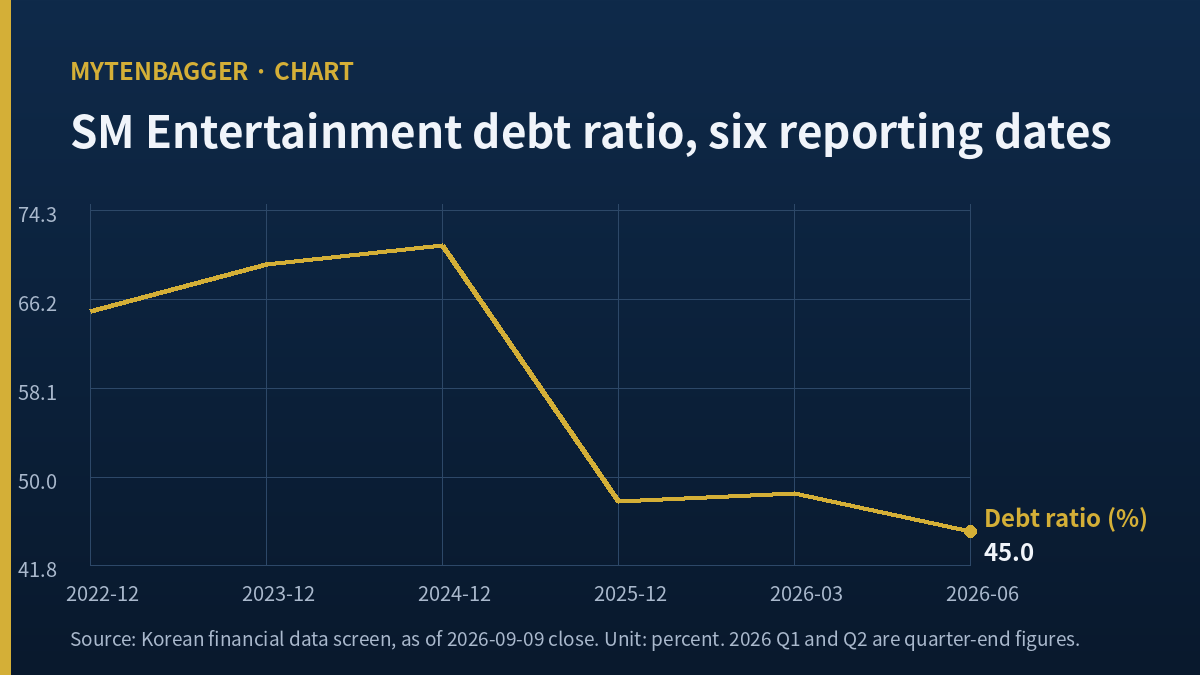
The debt ratio is the cleanest way I have to watch this balance sheet without waiting for a full filing. It went 65.10, 69.45, 71.17, then 47.76 across the four year-ends. Then 48.46 at the end of the first quarter of 2026, and 44.99 at the end of the second.
The pattern is not a straight line down. It rose for two years, dropped by more than twenty-three percentage points, ticked back up by 0.70 of a point in the first quarter, and fell again by 3.47 points in the second. A ratio that behaves this way is not being managed to a target; it is reflecting things that happen to the two halves of the ratio at different times. The company put that quarter on the record on August 6, 2026 (Thu), in an announcement Korean press carried the same day. In it, liabilities fell by 32.7 billion won while equity rose by 31.8 billion, and both of those movements push the ratio the same way at once, which is why that quarter produced the largest single-quarter move in the series.
Return on equity came back down to where it started
Here is the figure that decides how I read all of the above. Return on equity ran 12.18 percent, 12.30 percent, then 2.64 percent, then 41.65 percent across the four years. In the first quarter of 2026 the screen shows 13.78 percent, and in the second 13.40 percent.
Forty-one point six five to thirteen point four zero in two quarters is not a business deteriorating. It is a business whose one enormous year has rolled out of the trailing window. The 2025 return sits on earnings that arrived once, and once those earnings stop being counted the ratio settles back near where it was in 2022 and 2023. In summary, Korean press reporting the company’s own annual announcement attributed the jump to non-operating income following an additional stake purchase in an affiliate that brought it into consolidation, together with a lower tax charge, as one Korean outlet put it in February 2026.
That distinction changes what the balance sheet is worth to me. Equity of 1,358.7 billion won is real and it is still there in the second quarter of 2026, at 1,385.7 billion. A debt ratio under fifty percent is real. But if I were to price this company off a 41.65 percent return on equity I would be pricing a year that will not repeat, and the two quarters since have already told me so.
A second company, and what sat between its two profit lines
I wanted one outside case where operating profit and bottom-line profit moved in different directions in the same year, so I could see whether the pattern I am describing is unusual or ordinary. Sony Group Corporation is the one I picked, and I picked it because its most recent full year does exactly that.
| Company | Operating profit direction | Bottom line direction | What sat in between |
|---|---|---|---|
| Sony Group Corporation (TSE: 6758) FY ended March 31, 2026 |
Rose, to 1.45 trillion yen | Fell, to 1.03 trillion yen | The spin-off of its financial services unit and losses tied to a discontinued vehicle program |
| SM Entertainment (KOSDAQ: 041510) FY ended December 31, 2025 |
Rose | Rose far more | Non-operating income from a step acquisition, and a lower tax charge |
Sony turned 12.48 trillion yen of sales into 1.45 trillion yen of operating profit and 1.03 trillion yen attributable to its shareholders, so its bottom line came to roughly 0.71 times its operating profit. SM Entertainment’s own year ran the other way. I have not put a valuation column in this table and I am not going to, because the two companies report under different accounting regimes in different currencies, and a multiple built across that boundary would look precise while meaning very little. Each ratio in the table is computed inside one company only, which is the one comparison that survives the currency difference intact.
What the two rows share is the direction of the lesson. In both cases the operating line and the attributable line told different stories about the same twelve months, and in both cases the thing that separated them was an event, which is a different object from a trend.
The consensus behind SM Entertainment stock is a figure no house published
The screen I use says seventeen houses currently carry estimates on this name. It puts their 2026 earnings estimate at 5,316 won per share and their collective valuation at 114,176 won. Divide the September 9 close by that earnings estimate and the forward multiple is 15.56 times.
The 114,176 won is worth pausing on for a different reason than the usual one. It is an average, which means it is almost certainly a figure that not one of the seventeen actually wrote down. Somebody published a higher number and somebody published a lower one, and the arithmetic mean of those is a value that exists only on my screen. When I quote it I am quoting a construction; no analyst is on record defending it as a view. That is a different kind of object from a valuation with a name attached, and I try not to let the two sit in the same sentence without saying which is which.
The named views are in the Korean edition, where two Korean houses are quoted with their dates and their figures. One of them cut its valuation on September 8, 2026 (Tue) while keeping a buy rating, and the other had published a higher figure four months earlier alongside three specific worries. I kept both on that side because they are Korean-language research reached through Korean press summaries, and I prefer to credit them once, properly, in the language they were written in.
What I did not verify about SM Entertainment stock
The reason the share count fell in 2024 and 2025. I read the numbers off the financial screen and I did not locate the corresponding disclosure.
Whether the quarterly operating cash flow cells are standalone or cumulative. The screen does not say, and the two 2026 quarters differ enough that the answer would change how I read them.
How much of the 2025 equity increase is attributable to controlling shareholders versus non-controlling interests. Book value per share rose 50.82 percent while equity rose 63.88 percent, and the difference between those two rates has to live somewhere, but I did not open the equity statement to find out where.
The composition of the 649.0 billion won of liabilities at the end of 2025. A debt ratio under fifty percent looks comfortable, but I have not split borrowings from operating payables, and in a company that collects concert money in advance those are very different things.
Where I stand on SM Entertainment stock and what breaks it
I hold none of it and I have no order in the market. This is a watch. It is not a position. My own rule keeps names outside the top hundred Korean listings by market value in the observation column, and at about US$1.41 billion this one sits well outside that line.
The way I read a year like this: when equity jumps and the share count falls at the same time, I separate the part of the balance sheet that stays from the part that only explains how it got there. Equity stays. The return that created it may not. A larger equity base with fewer shares over it is a durable improvement in what each share owns. A forty-one percent return on that equity, produced by an event, is not a rate I can extend forward, and the two quarters since have already brought it back to thirteen.
I have two conditions. First, whether the debt ratio keeps working down through the forties or stalls somewhere near forty-five. Second, whether the second quarter’s simultaneous fall in liabilities and rise in equity repeats in the third, or turns out to have been a single settlement. The third-quarter report answers both, and the statutory filing deadline for it is November 16, 2026 (Mon).
There is a question that survives even after that report lands. Both of my conditions are phrased in the vocabulary the company currently uses to present itself, and companies revise that vocabulary. A line item can be reclassified, a subsidiary can move between consolidation and the equity method, and a ratio I have been tracking for four year-ends can quietly begin measuring something adjacent to what it measured before. If that happens, my conditions will not be proved or disproved; they will simply stop having anything to attach to. I would rather notice that as a possibility now than discover in November that I have been watching a line that changed its meaning while I was watching it.
Here is the case against my own reading, in nineteen pieces.
- Almost all of the 2025 equity increase traces to a year whose earnings came from a single transaction and a lower tax charge.
- Return on equity has already fallen from 41.65 percent to 13.40 percent in two quarters.
- Thirteen point four zero is roughly where this company sat in 2022 and 2023, so the 2025 figure is the outlier and 13.40 percent is nearer the level.
- In 2024 return on equity was 2.64 percent. This balance sheet has produced a near-zero year within the last twenty-four months.
- The debt ratio rose in 2023 and again in 2024 before it fell. Two of the last four years moved the wrong way.
- It also ticked back up, to 48.46 percent, in the first quarter of 2026.
- I cannot say why the share count fell, so I cannot say whether it will keep falling.
- Book value per share rose 50.82 percent while equity rose 63.88 percent, and I have not explained the difference.
- The forward multiple of 15.56 times rests on a 5,316 won estimate that I did not build and cannot audit.
- The collective valuation of 114,176 won is an average that no individual house published.
- One Korean house cut its valuation on September 8, 2026 (Tue).
- The 649.0 billion won liability balance is unsplit in my notes.
- Quarterly operating cash flow may be cumulative where I have read it as standalone, which would make the first-quarter figure look worse than it is or the second better.
- Foreign ownership at 31.79 percent means a large share of the register can leave for reasons that have nothing to do with this balance sheet.
- Equity fell by 4.8 billion won in the first quarter of 2026, so the direction is not one-way even within this year.
- Sony’s most recent year shows that operating profit and the attributable line can diverge in the unfavorable direction as easily as the favorable one.
- Anything on a KOSDAQ listing carries thinner liquidity than a comparable KOSPI name, and my exit assumptions should be worse here.
- The financial screen I used mislabeled one quarterly column, which I found and corrected on the Korean side. A screen that gets one label wrong may have others.
- The close of 82,700 won is a little over half of this stock’s own 52-week high, and a balance sheet that improved through 2025 did not stop that from happening.
There is no American depositary receipt for this company that I could locate. The broad Korea exchange-traded funds available to US investors are weighted toward the large KOSPI industrials and semiconductors, so a KOSDAQ entertainment name of this size contributes very little to them even where it appears at all; buying the sector through those vehicles would mostly buy something else. Direct KOSDAQ access exists through brokers that support the Korean market, with the currency exposure and the settlement calendar that come with it. I looked at a peer in the same industry last month using a different set of tools, and that piece approached the sector from the operating line, one statement above where this piece works.

Prices and ratios in this piece reflect the September 9, 2026 (Wed) close as I checked it at the time of writing, so live quotes can differ. Korean won is the currency of record here and the single US dollar figure is approximate, converted at about 1,344.45 won per dollar as quoted on September 8, 2026 (Tue), the most recent daily close available to me at the time of writing. The debt ratios, returns, growth rates, per-share changes and the Sony ratio were computed by me from the figures printed in this piece. Balance sheet data comes from a Korean financial data screen and from Korean-language press reports of the company’s own announcements, which I have attributed individually.