GS Retail Stock Meets a Peer That Reports Two Store Margins
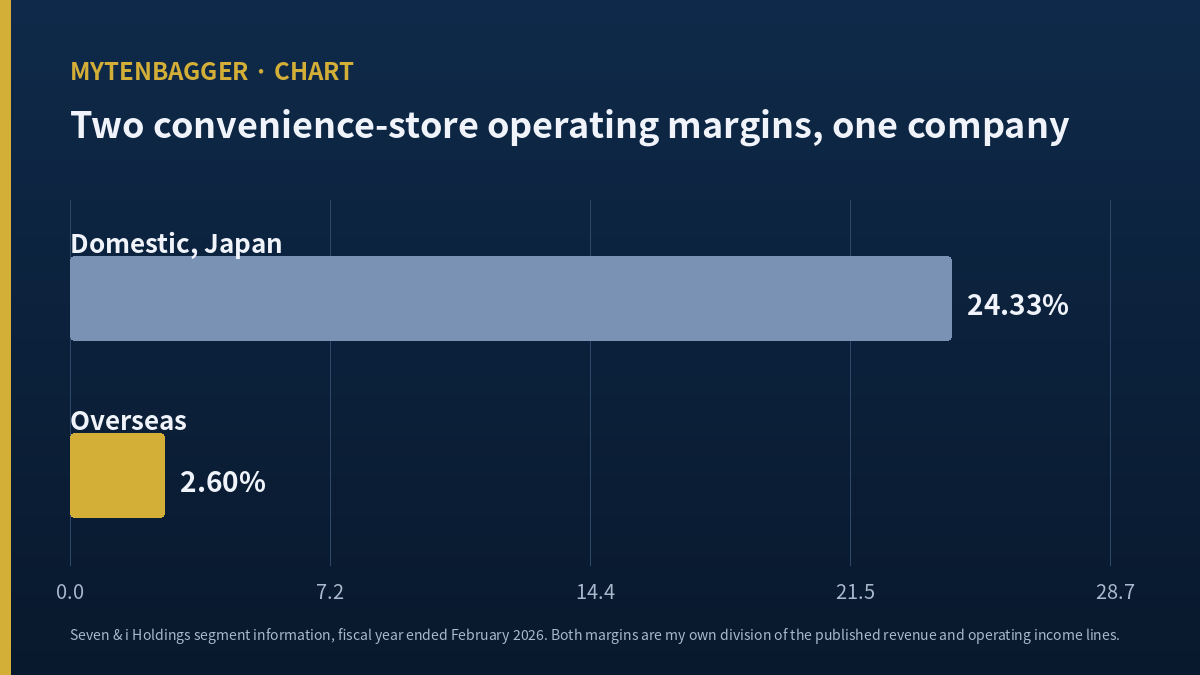
Twenty-four point three three percent. Two point six zero percent. Both figures are operating margins. Both come from convenience stores. Both belong to one company, Seven & i Holdings, in one fiscal year, in one published segment table. The difference between them is not performance. It is what each revenue line is allowed to contain.
I went looking for that table because I wanted a number to put beside GS Retail stock, and the Korean company had just published a store-segment margin of 2.99% for the second quarter of 2026. On its own that figure tells a reader almost nothing. Placed next to 24.33% it looks like a disaster. Placed next to 2.60% it looks ordinary. The same peer supplies both anchors, which is why I spent the session on the anchors before I spent it on the company.
| Seven & i, domestic convenience stores | 24.33% | commission-based revenue from franchised stores |
| Seven & i, overseas convenience stores | 2.60% | merchandise and fuel sold through company-run stores |
| GS Retail, convenience-store segment | 2.99% | segment revenue as the company reports it |
Contents
What GS Retail stock is a claim on
GS Retail trades on the KOSPI, the main board of the Korea Exchange, under the code 007070. The KOSPI is the larger of Korea’s two listed markets; the KOSDAQ, which holds smaller and more technology-weighted names, is the other. The company runs three businesses: the GS25 convenience-store chain, a supermarket chain, and a home-shopping channel. Until December 2024 it also owned a hotel business, which was separated into a new listed entity, and that separation is why any four-year per-share series on this company is really two series with a break in the middle.
The closing price on September 10, 2026 was 25,050 won, on 83,607,415 shares outstanding. That works out to a market value of about 2,094.4 billion won, or roughly US$1.57 billion by my own conversion. This is a mid-cap by Korean standards and a small-cap by American ones, which matters for how a reader outside Korea can reach it at all. I come back to that below.
The December 2024 separation deserves one more sentence, because it changes what a screen shows without changing what the company does. A hotel operator left the group, and with it a substantial block of property and the debt attached to that property. Anything a data service computes across that date is comparing two different companies carrying the same ticker: the earnings-per-share series is computed on a smaller share count from that point on, the return-on-equity series is measured against a smaller capital base, and the total assets underneath any efficiency ratio drop by roughly a quarter in a single step. None of that is visible on a price chart. I have worked through the exact figures on the Korean side of my file, and every GS Retail financial figure in this English piece comes from after the break, so that no comparison of this company’s own numbers has to cross it.
Two margins for one business, and how the Japanese peer reports them
Seven & i Holdings runs 7-Eleven at home in Japan and across North America. Its published segment information for the fiscal year ended February 2026 shows domestic convenience-store revenue of 914,583 million yen against segment operating income of 222,521 million yen. Overseas convenience-store revenue for the same year is 8,556,832 million yen against operating income of 222,223 million yen.
The two operating income figures are within a few hundred million yen of each other. The two revenue figures differ by a factor of more than nine. Dividing gives 24.33% and 2.60% respectively, both my own arithmetic on those four published lines.
The cause is not that Japanese stores are nine times more profitable per unit of sales. It is that a franchised store in Japan sends the parent a commission, and only that commission enters the revenue line, while a company-operated store in North America puts the full ticket, fuel included, into revenue. One system reports a slice; the other reports the whole sale. Margin is the ratio between two lines, and if the top line means different things in two places, so does the ratio.
I am setting this out at length because it is the single most useful thing I found this session, and because it decides how the Korean number should be read.
Where GS Retail stock’s store margin actually sits
For the quarter ended June 2026, the convenience-store segment produced revenue of 2,384.4 billion won and segment operating income of 71.4 billion won. That is 2.99% by my own division. Korean convenience-store chains run a mix of franchised and directly operated stores and consolidate store-level sales into segment revenue, so the makeup of that top line is much closer to the overseas row of the Japanese table than to the domestic one.
Which means the honest sentence is this. GS Retail’s store margin belongs beside 2.60%, and against that anchor a 2.99% quarter is slightly ahead, in a business where slightly ahead is the whole game. Against 24.33% it would look catastrophic, and that reading would be an accounting artifact.
I want to be clear about how far I checked. I have not gone through either company’s revenue-recognition notes line by line. What I have is the segment tables, the descriptions each company gives of what its stores are, and the size relationship between the two Japanese rows, which is itself strong evidence for the commission explanation. That is enough to reject the 24.33% comparison. It is not enough for me to claim that 2.99% and 2.60% are measured identically.
The second quarter, segment by segment
The group numbers, as Seoul Economic Daily reported them on August 7, 2026 (Fri): consolidated revenue of 3,175.1 billion won, up 6.7% year on year; operating profit of 109.4 billion won, up 27.5%; net profit of 64.6 billion won, up 354.5%.
| Segment, quarter ended June 2026 | Revenue (bn won) | YoY | Operating income | YoY |
|---|---|---|---|---|
| Convenience stores | 2,384.4 | +7.1% | 71.4 | +21% |
| Supermarkets | 469.8 | +10.1% | 9.3 | +72.2% |
| Home shopping | 268.2 | +0.9% | 26.7 | +6% |
| Group, consolidated | 3,175.1 | +6.7% | 109.4 | +27.5% |
Two details are worth pulling out. The supermarket chain ended the quarter with 596 stores, 36 more than a year earlier, and its operating income grew faster in percentage terms than either of the other two lines from a very small base. And sales to foreign customers grew 67.2%, which in a Korean convenience-store context means tourists, and which is the kind of demand that does not require the company to open anything.
Dividing each segment’s operating income by its own revenue produces three numbers that do not sit anywhere near each other. Convenience stores came in at 2.99%. Supermarkets came in at 1.98%. Home shopping came in at 9.96%. All three are my own arithmetic on the lines in the table above.
The ordering is the part I did not expect. The smallest revenue line in the group carries by some distance the fattest margin, and the largest one carries a margin barely above the retail floor. Home shopping took 8.59% of the three segments’ combined revenue and produced 24.86% of their combined operating income in the quarter, both my own calculations. That is a useful thing to hold onto when reading the objection further down about that unit shrinking: the business getting smaller is the one whose every won of sales is worth the most to the group.
The gap between the segment sum and the group line
Add the three segment operating income figures and I get 107.4 billion won. The group line is 109.4 billion won. The difference is 2.0 billion won when I take one figure from the other, and the group total is the larger one. On revenue the direction is the same: the three segments sum to 3,122.4 billion won against a group line of 3,175.1 billion, a difference of 52.7 billion won.
Gaps of this kind are normal. Reported segments do not have to cover every activity a group runs, unallocated corporate items sit outside them, and intra-group eliminations move both directions. I mention it because it caps how precisely anyone can talk about this company’s store economics from segment data alone, and because I got it wrong for an hour, which I come back to further down.
The convenience-store segment supplied 66.5% of the three segments’ combined operating income in the quarter, by my own arithmetic. Whatever this company is, it is a convenience-store operator with two attachments.
Store counts stopped falling, and GS Retail stock is riding that
Korean convenience-store chains spent 2025 closing stores for the first time in the format’s history. Seoul Economic Daily set out the counts on September 1, 2026 (Tue). GS25 finished 2024 with 18,112 stores and 2025 with 18,005, a fall of 107 on my own count, and was back to 18,021 at the halfway point of 2026. Seven-Eleven Korea went from 12,152 to 11,040, a fall of 1,112 that followed its absorption of the Ministop chain. Emart24 went from 6,130 to 5,510, down 620.
The four chains together held 53,266 stores at the end of 2025, the first contraction on record, and 53,458 by July 2026, a net addition of 192. Industry sales grew 2.5% in the first quarter of 2026 and 4.8% in the second, after declines the year before.
What changed inside the stores matters as much as the count. The same Seoul Economic Daily piece puts the recovery down to a widening product range: cigarettes and packaged goods once carried the format, and fresh food, ready meals and desserts now pull in demand that used to go to supermarkets and restaurants. That is a different kind of growth from opening more doors, because it lifts the average ticket at stores that already exist, and store-level operating leverage in this format is steep. A chain adds very little cost when an existing store sells a lunch box instead of a pack of gum, and almost all of the difference between those two sales survives to the segment operating line. That mechanism, and not the store count itself, is the most plausible explanation I have for a store margin moving from where this industry sat in 2025 to where GS Retail reported it in the second quarter of 2026.
This is the part of the case I trust most, because it does not depend on any one company’s accounting. The format stopped shrinking and started growing again, and the operator with the largest single chain in it posted its best store margin in some time in the same window. I looked at the other big Korean convenience-store operator a few weeks ago from a completely different angle, and the industry backdrop there is the same one.
What I checked and left out of the GS Retail stock case
The three segment lines cost me an hour. I added them, got 107.4 billion won against a group figure of 109.4 billion, and my first instinct was that one of the two sources had a typographical error. I went back to the article, then to the segment percentages, then to the year-ago comparatives, looking for the mistake. There was no mistake. Reported segments simply do not have to reconcile to a group total, and I know that; I have written it into other pieces. What happened is that I had spent the previous hour on a peer whose segment table did reconcile neatly, and I carried that expectation across without noticing I had picked it up. The hour was not wasted, since the size of the gap is now something I can quote, but the reason I spent it was that I let one company’s presentation set my expectation for another’s.
Two other things I checked and am not using. The home-shopping channel’s revenue growth of 0.9% is close enough to flat that a single quarter of it carries no information about direction, so I have taken the direction from a longer Korean series instead, which appears in the objections below. And the net profit growth of 354.5% is arithmetically true and analytically empty until I know what made the year-ago quarter small, which I have not established.
Six things that would break this reading
One. The comparability claim at the center of this piece rests on segment descriptions and on the size relationship between two revenue lines. It does not rest on a line-by-line check of either company’s revenue-recognition policy. If Korean segment revenue turns out to be reported on a basis closer to the Japanese domestic one, the anchor I chose is the wrong anchor and the conclusion inverts.
Two. The overseas row of the Japanese table includes fuel retail. Fuel is a high-turnover, low-margin category with its own cycle, and GS Retail sells none of it. A margin anchor contaminated by gasoline is a rough anchor even when the accounting basis matches.
Three. One of the three Korean businesses keeps getting smaller. Korean press reporting from June 2026 puts the home-shopping unit’s revenue at its 2022 peak well above where it sits now, with segment operating income following the same path down, and the convenience-store share of group revenue rising as a result. A group whose margin improves partly because its weakest unit shrinks is improving for a reason that eventually runs out.
Four. Expansion restarting is not only a tailwind. All four chains are opening again, which is exactly the condition under which the 2025 discipline that produced these margins gets competed away. The store-count recovery I quoted as supporting evidence is also the mechanism that could end it.
Five. The 2.0 billion won I cannot place between the segments and the group is small in this quarter. It is not guaranteed to stay small, and I have no visibility into what sits inside it.
Six. Korean sell-side coverage is unusually bunched. A large number of houses published valuations within days of the second-quarter release, all of them above where the shares actually trade, and the shares have not moved to meet them. Agreement among analysts who read the same release in the same week is not the same thing as independent confirmation, and I do not treat a majority as evidence.
Where I stand on GS Retail stock and what would end it
I do not own the shares and I have no order working. This sits in my file as an observation and I hold no position in it. The reason is that the most interesting thing I found is a fact about how two companies write down their revenue, which is a fact about measurement and not about earning power.
What I would need to see. First, a third-quarter store margin that holds near or above the level the second quarter produced, since a single quarter of margin in a format this seasonal is a data point and not a trend. Second, some evidence about what the shrinking third business is going to be, because a group margin that improves because a piece keeps leaving has a floor and I do not know where it is.
What would end my interest. If the store margin falls back toward where the industry sat before the 2025 store cleanup while the chains keep opening, then the improvement was a pause in competition instead of a change in how these stores work, and I have no reason to keep the file open. I have written the same test from the balance-sheet side in the Korean-language version of my file on this company; the two pieces share a subject and almost no numbers.
Related reading: interest coverage I worked through separately
Prices and multiples reflect the September 10, 2026 (Thu) close as checked at the time of writing and should be treated as approximate. The Korean won is the reference currency throughout, and the single dollar figure in this piece uses 1,338.24 won per dollar on that same date, sourced from a market data provider’s historical series. Company financials come from the WiseReport company page and a Korean account-level balance-sheet service, on a consolidated IFRS basis. Where a figure is described as my own arithmetic, it is a calculation I performed on published lines and no source printed it. Korean-language press cited here is quoted in translation.