Hanwha Engine Stock and Where Its Shareholder Equity Came From
Four lines. One total. They do not match.
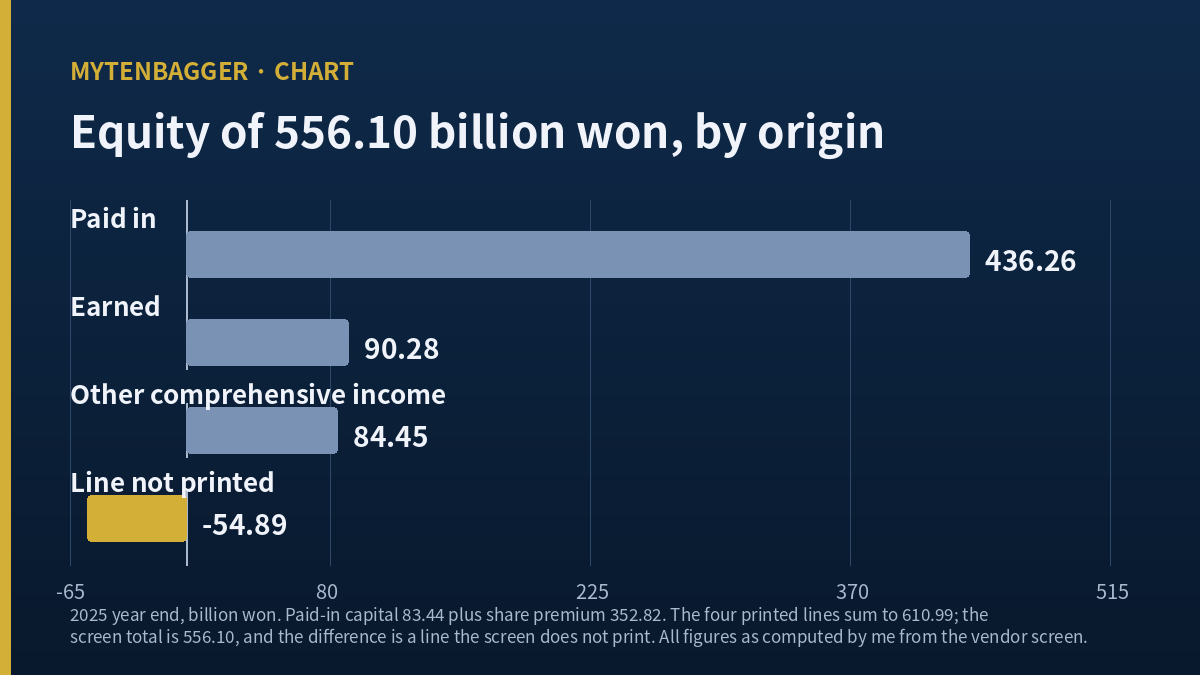
On the Korean vendor screen I use, Hanwha Engine (KOSPI: 082740) closed on Thursday, September 10, 2026 at 48,350 won, and the same screen prints a price to net assets ratio of 7.25. Underneath that ratio sits a balance sheet with four equity lines: paid-in capital, share premium, retained earnings, and accumulated other comprehensive income. I added them. The sum came to 610.99 billion won. The equity total on the same screen is 556.10 billion won.
The gap is 54.89 billion won by my calculation, and it is not a typing error on my end. I checked the same four lines for 2024 and for 2022 and got 54.90 and 54.91. Over four reporting years the missing amount has moved by 20 million won. Something durable and negative lives in a line the screen does not print, and I am paying for the total that includes it.
EARNED = retained earnings 90.28 billion won, positive for the first time in 2025
OCI = accumulated other comprehensive income 84.45 billion won
MINUS = the line the screen does not print, 54.89 billion won by my calculation
Percentages are my own, taken against the 556.10 billion won total, so they run past 100 before the negative line pulls them back.
I do not own this company and I have no order in the market. What follows is the work I did before deciding to keep watching instead of buying, and the points at which that decision stops holding.
Contents
Hanwha Engine Stock Sits on Equity That Does Not Add Up
Hanwha Engine builds large low-speed and medium-speed engines for merchant ships. It was Doosan Engine, then HSD Engine, and since 2024 it has been part of the Hanwha group. KOSPI is the senior board of the Korea Exchange, roughly the local equivalent of the New York Stock Exchange in standing, and this company sits well outside its hundred largest members. Market value is about US$3.01 billion by my calculation, using 1,338.24 won per dollar as of Thursday, September 10, 2026.
A company that changes owners twice inside a decade tends to leave marks on its equity section, and this one has. The vendor screen shows total assets of 1,695.69 billion won against total liabilities of 1,139.58 billion won at the end of 2025, which puts liabilities at 204.92 percent of equity by my calculation. Neither of those numbers explains the missing 54.89 billion won, because both of them are totals that already contain it.
The Four Lines and the One That Is Missing
Adding the printed lines
Here is the arithmetic, in billions of won, as I ran it for three years the screen gives in full.
| Line | 2022 | 2024 | 2025 |
|---|---|---|---|
| Paid-in capital | 71.54 | 83.44 | 83.44 |
| Share premium | 273.46 | 350.24 | 352.82 |
| Retained earnings | minus 147.54 | minus 71.04 | 90.28 |
| Accumulated OCI | 79.07 | 85.55 | 84.45 |
| Sum of the four | 276.53 | 448.19 | 610.99 |
| Equity total on screen | 221.62 | 393.29 | 556.10 |
| Difference | 54.91 | 54.90 | 54.89 |
The line that has barely moved
A deduction that holds at roughly 54.9 billion won while everything around it doubles is almost certainly a fixed capital adjustment, treasury stock, or a loss carried from an old capital reduction. I have not opened the audited notes to confirm which, so I am stating what I measured and stopping there. What I can say is that it is real enough to matter: 9.87 percent of the equity total by my calculation, and every ratio built on equity, including the 7.25 that started this piece, already carries it.
It is worth seeing how much of the ratio that one line accounts for. Had the four printed lines been the whole of equity, the total would be 610.99 billion won, net assets per share would be 7,321.88 won by my calculation, and the September 10 close of 48,350 won would sit at 6.60 times net assets instead of 7.25. Set that against the 6.76 I get for the Finnish peer below, and most of the distance between the two companies on this measure turns out to live in a line I cannot yet name. That is an uncomfortable place for a valuation argument to rest, mine included.
What Hanwha Engine Stock Pays for Each Unit of Net Assets
Net assets per share on the screen are 6,666 won. Dividing the 2025 equity total by the 83,447,142 shares outstanding gives 6,664.10 won by my calculation, a gap of under two won that comes from rounding at the vendor. At the September 10, 2026 close, 48,350 divided by 6,666 gives 7.2532, which is the 7.25 the screen prints.
One caution about which figure to use. A second Korean data provider prints net assets per share of 7,786 won for the same company, which implies equity of about 649.72 billion won by my calculation, some 93.62 billion above the December 2025 total. That provider is dividing a more recent balance sheet by the same share count, and the first half of 2026 has added profit that the year-end figure does not contain. Every net asset calculation in this piece uses the December 2025 basis, and a reader comparing my 7.25 against a screen quoting the newer basis will get a lower number for a good reason.
Seven and a quarter times net assets is a high number for a company that makes heavy industrial hardware. It is the sort of multiple that usually belongs to a business with very little capital tied up and a long record of compounding what it earns. This company is the opposite on the first count and, until last year, was the opposite on the second as well.
Wartsila Carries Almost the Same Multiple
For a global peer I went to Wartsila (Helsinki: WRT1V), the Finnish group whose marine power business competes with and licenses alongside the same engine platforms Korean builders use. I am writing its name in plain ASCII throughout; the company itself spells it with two diacritics.
Its shares last printed at EUR 29.12 on Friday, September 4, 2026, for a market value of EUR 17.17 billion against shareholders’ equity of EUR 2.54 billion. That is 6.76 times equity by my calculation, and it agrees with the ratio published on the same statistics page. Net assets per share are EUR 4.30.
I have deliberately not put the two market values into one currency. The comparison I want runs on ratios and on origins, and converting would add an exchange rate that does nothing for either.
The Finnish company’s own year is worth a moment, because it shows what a mature version of this business looks like. Net sales rose to EUR 6,914 million in 2025 from EUR 6,449 million in 2024. Its comparable operating result rose to EUR 829 million from EUR 694 million, lifting that margin to 12.0 percent from 10.8, and the reported operating result went to EUR 833 million from EUR 716 million. Earnings per share went to EUR 1.06 from EUR 0.85, a rise of 24.71 percent by my calculation. Order intake, meanwhile, barely moved: EUR 8,102 million against EUR 8,072 million the year before. Profit improved on flat demand, and the payout that followed still leaves the shares yielding 1.91 percent on the base dividend alone.
Two further contrasts sit behind the balance sheets. The Finnish company holds EUR 2.22 billion of cash against EUR 551 million of total debt, which is net cash of EUR 1.669 billion by my calculation, so its equity is not standing on borrowed money. Its five-year beta is reported at 1.25, against 0.76 for the Korean name. The larger, older, cash-rich company is the one that moves more with its market, and the smaller one moves with its own industry news. That pairing is the reverse of what I would have guessed before looking, and it is a reminder that size and volatility do not travel together in a cyclical supply chain.
| Where the two agree | ||
| Multiple of net assets | Hanwha Engine 7.25 | Wartsila 6.76 |
| Business | Large marine engines | Marine power and services |
| Order intake trend | Rising through 2026 | EUR 8,102 million in 2025 |
| Where they do not | ||
| Retained earnings | Positive since 2025 | Long-standing, funds an extra payout |
| Dividend for the year | None | EUR 0.54 plus EUR 0.52 extraordinary |
| What the 2025 profit did | Stayed in, closing the deficit | Went out, matched to the cent by the two dividends |
The last row is the one I sat with. Wartsila proposed to hand shareholders EUR 0.54 as a base dividend and EUR 0.52 on top, and the two together come to exactly the EUR 1.06 it earned per share in 2025. A company can only do that when the equity behind it has been accumulating for a long time and the current year’s profit is genuinely spare. Hanwha Engine, at a multiple within half a turn of Wartsila’s, cannot do that yet for a reason that is written into its own balance sheet.
Where the Two Sets of Equity Came From
Paid in
Paid-in capital plus share premium at Hanwha Engine come to 436.26 billion won, which is 78.45 percent of total equity by my calculation. Between 2022 and 2024 paid-in capital went from 71.54 to 83.44 billion won and share premium from 273.46 to 350.24, the signature of a share issue placed with a new controlling owner. Most of what a buyer is measuring against today arrived as a payment into the company; only a small share of it was generated inside.
The size of that issue can be recovered from the capital line itself. Dividing 83.44 billion won by the 83,447,142 shares now outstanding gives 999.91 won, so the par value is 1,000 won and the arithmetic closes. Running it backwards on the 2022 figure of 71.54 billion gives 71,540,000 shares by my calculation, which means 11,907,142 shares were created in between, an increase of 16.64 percent. Anyone holding before that issue owns a proportionally smaller claim on the larger equity that resulted.
Earned
Retained earnings were minus 147.54 billion won in 2022 and minus 71.04 in 2024, and turned positive at 90.28 in 2025. The swing across those four years is 237.82 billion won by my calculation, and the swing in the final year alone is 161.32. That single year did most of the work.
Total equity grew 2.51 times from 2022 to 2025 by my calculation. Per share the picture is duller, because the share count grew too. Net assets per share work out to 3,097.85 won at the end of 2022, 4,713.04 at the end of 2024 and 6,664.10 at the end of 2025, all by my calculation from the equity totals and the share counts above. That is growth of 2.15 times, against 2.51 times for the equity pool itself. The difference between those two figures is the dilution, and it is the part a screen showing only the total will never make you look at.
Hanwha Engine Stock and a Deficit That Closed in 2025
An accumulated deficit is not merely an accounting scar. In Korea it is a legal gate: distributable profit is calculated after the deficit is cleared, which is why several Korean shipbuilders have gone a decade or more without paying anything. I wrote about that exact mechanism when I looked at a much larger yard, and the piece is worth reading alongside this one: Samsung Heavy Industries and its eleven-year dividend drought.
Hanwha Engine walked through that gate in 2025. What it has not yet done is announce what it intends to do on the other side. The one capital action on the record this year runs the other way: on Tuesday, July 14, 2026 the board approved an open-market purchase of its own shares running from Wednesday, July 15 to Monday, October 12, 2026, and the stated purpose is share-based compensation for employees. Those shares are due to leave the company again in someone’s hands. Korean press covering the resolution recorded no cancellation plan attached to it.
The group connection matters here too. On Wednesday, May 13, 2026 the company disclosed an engine supply contract with Hanwha Ocean, its affiliate. I have written separately about how that yard is priced after its Canadian submarine defeat: what remains of Hanwha Ocean after the Canada loss. Related-party volume is real revenue, and it is also revenue whose pricing an outside reader cannot audit.
Hanwha Engine Stock Against the Korean Market Around It
Four Reasons Hanwha Engine Stock Could Be Wrong Here
The unnamed line could be benign. If the 54.89 billion won deduction is treasury stock held for a specific purpose, my framing of it as a permanent drag on equity is too heavy. I did not open the notes, and that is a hole in my own case.
Origin of equity may not matter to a buyer. A won of paid-in capital and a won of retained profit fund the same machines. Investors who think that way will read this entire piece as a distinction without consequence, and they will not be obviously wrong.
Korean sell-side is broadly positive. Seven houses carry estimates on the name, and every one of their valuations sits above the traded price, with the most cautious of them still above it. My hesitation puts me on the other side of all seven.
The comparison itself may not hold. Wartsila earns a large share of its result from long-lived service contracts, while this company is closer to a pure equipment maker. If the two businesses convert equity into profit by different routes, then matching their multiples of net assets proves less than I want it to.
Where I Went Wrong While Writing This
My own addition is what I doubted first. When the four lines came to 610.99 against a printed total of 556.10, I assumed I had fat-fingered a figure, so I retyped all four and added them again. Then I did it a third time on paper. Only after the third attempt did it occur to me that the screen might be showing an incomplete set of lines, which is the possibility I should have tested first, since it costs nothing to check a second year and I had two more years sitting right there. Checking 2024 and 2022 took under a minute and turned a suspected mistake into the finding this piece is built on. I keep treating my own error as the likelier explanation when the cheaper test is on the data.
What Would Break My Read on Hanwha Engine Stock
I am watching without holding, and these are the two events that would end the watching.
One. Retained earnings going back below zero in any quarterly filing through 2027. The gate this company just cleared can close again, and if it does, the argument that 2025 marked a durable turn has failed outright, and one weak quarter would be enough to end it.
Two. The unnamed deduction moving materially in either direction without an explanation I can locate. It has held within 20 million won across four years; a sudden change in a line I cannot yet name would mean the equity I have been measuring is not the thing I thought it was.
There is a cheaper test available before either of those. The next full balance sheet will let me redo the same addition on a newer set of four lines. If the four still fall short of the total by something near 54.9 billion won, my read on the durability of that deduction is confirmed at almost no cost. If the gap has changed, I learn that in the same minute. It is rare to have a thesis whose main uncertainty can be checked by taking one published total away from another, and I would sooner use that than wait for a narrative to settle.
If instead the deficit stays closed through 2027 and the company puts a capital return policy on the record, the origin of its equity becomes a historical note and I will be looking at the earnings line for a reason to buy instead of at the balance sheet for a reason to wait.
Prices and multiples reflect the Thursday, September 10, 2026 close as checked at the time of writing. The dollar figure is approximate, at roughly 1,338.24 won per dollar on the same date, and Korean won is the reference currency throughout. Wartsila figures are in euro and are not converted. Balance sheet lines are as printed by the Korean vendor screen; sums, percentages and ratios marked as my calculation are mine.
Sources: Wartsila financial statements bulletin for January to December 2025, Wartsila valuation statistics, Korean vendor company screen for 082740, Korean vendor balance sheet detail, Korean press report on the second quarter results, July 31, 2026, Korean press report on the July 14, 2026 buyback resolution.