Dongsuh Net Margin Runs 3.4 Times Its Operating Margin
I could not open the books that explain most of this company’s profit. That sentence is the whole reason I spent a session on Dongsuh (026960), a packaged food name on the KOSPI, the larger of South Korea’s two main boards and the one that carries the country’s blue chips. The Korea Exchange runs it alongside the KOSDAQ, which holds smaller and more speculative listings.
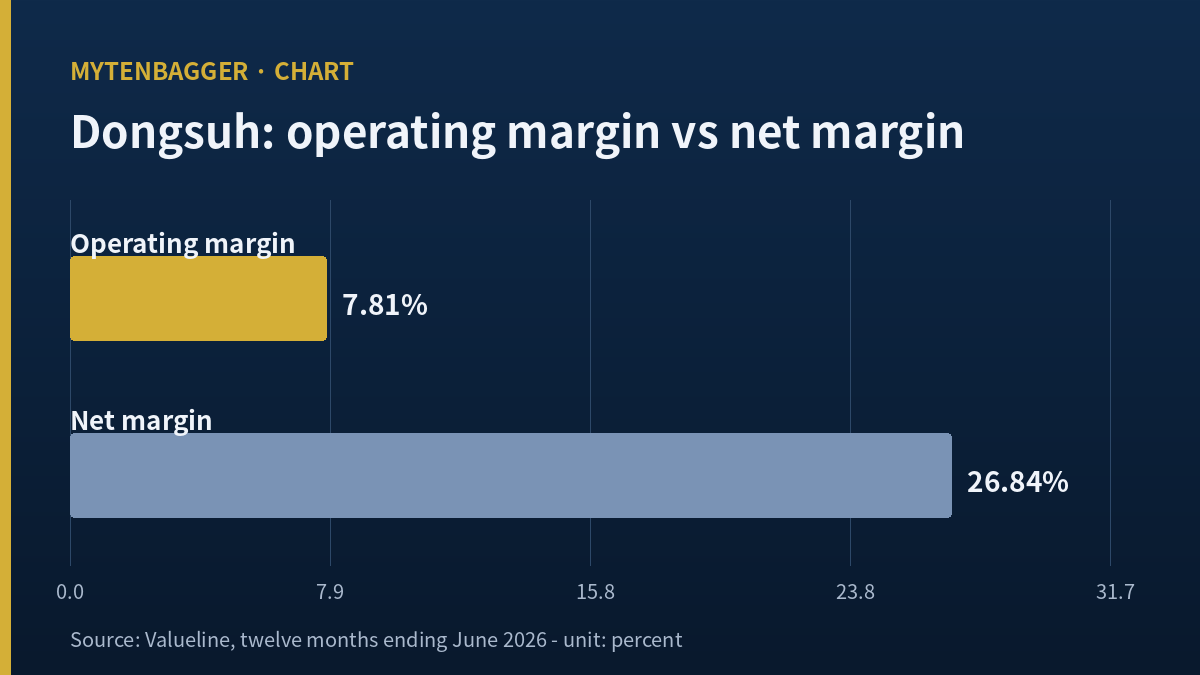
Here is the shape of the thing. Over the twelve months ending June 2026, Valueline puts the operating margin at 7.81 percent and the net margin at 26.84 percent. The second is 3.4366 times the first. For a company that roasts and sells coffee, tea and a handful of adjacent grocery lines, that is not a normal relationship between two lines on the same income statement.
A wide gap between operating and net margin usually means one of a small number of things: a large one-off disposal, a tax event, or income that arrives from an entity the company owns a piece of but does not fold into its own operating line. I went looking for which one it was.
% Operating margin 7.81 percent against net margin 26.84 percent, a factor of 3.4366
% About 102.42 billion won of profit arrives from below the operating line
% The venture that most likely produces it has never been listed anywhere
Contents
What the Dongsuh net margin is measured against
Start with the denominator, because everything here depends on it. I built trailing revenue from the six most recent reported quarters instead of lifting an annual figure off a screen. I wanted to know whether the chain closed before I leaned on it.
Investing.com lists the release dates and the reported figures. The four quarters ending June 2026 are 137.32 billion won (reported November 13, 2025), 129.88 billion won (February 27, 2026), 135.28 billion won (May 14, 2026) and 135.73 billion won (August 13, 2026). Added together that is 538.21 billion won of trailing revenue.
Apply the two margins to that base. An operating margin of 7.81 percent puts trailing operating profit near 42.03 billion won. A net margin of 26.84 percent puts trailing net profit near 144.46 billion won. The difference between the two is roughly 102.42 billion won, and that number is the subject of this piece.
I want to be precise about what those two derived figures are. They are my own arithmetic. The company disclosed neither of them. The margins are published; the won amounts are what those margins imply when I multiply them by a revenue base I assembled myself. If either input is wrong, both outputs move.
Where the Dongsuh net margin gap is not coming from
The first thing I ruled out was debt. Companies sometimes show a wide operating-to-net spread because of financing swings, but that runs the other way here and in any case there is almost nothing to swing. This balance sheet carries a debt ratio in the low single digits and a borrowings ratio close to zero. Interest coverage is in the hundreds of times. Whatever is adding to profit below the operating line, it is not a financing effect on a leveraged book.
The second thing I ruled out was a one-off. A single disposal or a tax reversal would show up in one quarter and vanish in the next. Instead the per-share earnings line stays in a band across six quarters: 444.65 won, 410 won, 342 won, 271 won, 437 won and 413 won, in the order the company reported them from May 2025 through August 2026. There is variation, and the December 2025 quarter at 271 won is visibly the weak one, but there is no single quarter carrying the entire spread. Something recurring is doing this.
What I could see and what I could not
I did not open the company’s half-year report this session. I want that on the record before I go further, because everything that follows is reconstruction from secondary screens and press, and the report itself would settle it in one page.
What I could see: the two margins, the six quarterly revenue figures, the six quarterly per-share earnings figures, and the ownership structure of the venture I am about to describe. What I could not see: the actual line item names in the income statement, the size of the equity-method contribution, and the tax treatment of any of it. So I can tell you the shape of the answer with reasonable confidence and I cannot tell you the exact amount.
The Dongsuh net margin rests on a company nobody can buy
Dongsuh owns half of Dongsuh Foods. The other half belongs to Mondelez Holdings Singapore. Korean press has reported that structure consistently, including in a Financial Today piece from July 2025 that describes Dongsuh Foods as an unlisted entity split evenly between the two owners.
Dongsuh Foods is the operating business most Korean consumers would actually recognize. It makes Maxim, the instant coffee brand that has anchored the category domestically for decades, and Kanu, the instant espresso line. A Business Report company analysis put its revenue at 1,615.2 billion won in 2022 and 1,755.4 billion won in 2023, with operating profit of 160.1 billion won and 167.1 billion won in those years, and an operating margin holding near ten percent.
Hold those two revenue figures against the parent. Dongsuh Foods turned over 1,755.4 billion won in 2023. The listed parent turned over 532.88 billion won across its own four 2025 quarters. The venture is 3.2942 times the size of the company whose shares trade.
I should be honest that those venture figures are three years old. I did not find a more recent public statement of Dongsuh Foods revenue in this session, and I am not going to extrapolate them forward. They establish an order of magnitude. As a current number they are worthless.
A fifty-fifty split has one specific consequence
Under Korean accounting, as under IFRS generally, a fifty percent holding with joint control is not consolidated line by line. Revenue does not flow into the parent’s revenue. Operating profit does not flow into the parent’s operating profit. A single figure, the investor’s share of the venture’s result, lands below the operating line.
That is exactly the mechanism that would produce the pattern I started with. Revenue stays small, so the operating margin is computed on a small base and comes out at a normal grocery-business 7.81 percent. Profit arrives from outside that base, so the net margin lands at 26.84 percent. The two ratios are not in conflict; they are measuring two different businesses.
There is a second consequence, and it is the one a shareholder would actually feel. The venture’s board decisions are shared. The parent does not unilaterally set the venture’s dividend, its capital spending, or its export strategy. A Shareholder Economy article reports that trademark rights for Maxim and Maxwell sit with the foreign partner, which constrains what the venture can sell abroad. I could not date that article precisely and its own figures run only to 2021, so I am carrying it as a structural claim about how the venture is set up, with no assertion that the position holds today.
One chain closes to the won and the other does not
Before I trust a reconstruction I test whether the pieces add up to the totals somebody else published. Two chains, two different results.
The revenue chain closes exactly. The four quarters the company reported for 2025 are 128.79 billion won, 136.89 billion won, 137.32 billion won and 129.88 billion won. They sum to 532.88 billion won. Alphasquare’s annual figure for 2025 revenue is 532.88 billion won. Not close, identical.
The per-share chain misses by 14.65 won
The earnings chain does not close the same way. Those same four quarters carried per-share earnings of 444.65 won, 410 won, 342 won and 271 won, which sum to 1,467.65 won. The annual per-share earnings figure published for 2025 is 1,453 won. The chain overshoots by 14.65 won, or 1.0083 percent.
A one percent miss is small enough that I am not treating it as an error by anyone. There are ordinary reasons for it: quarterly figures may be on a different basis from the annual one, minority interests may be handled differently, or rounding may accumulate across four quarters. I record it anyway and I do not smooth it, because the direction of my whole argument depends on per-share earnings being a reliable proxy for profit, and a chain that does not close is a small warning against leaning on it too hard.
The half-year comparison is cleaner. The two quarters of 2026 carried 437 won and 413 won, summing to 850 won. The matching 2025 quarters carried 444.65 won and 410 won, summing to 854.65 won. The company is running essentially flat on a per-share basis across that span.
Three listed companies that sell what the venture sells
I picked peers on an unusual basis this time. Instead of looking for companies that resemble the listed parent, I looked for the counterparty to the joint venture and for two companies that own outright what the venture only half owns. The point of the comparison is the ownership structure. Size is beside it.
Mondelez International, listed on the Nasdaq under MDLZ, is the other half of Dongsuh Foods. Stockanalysis showed it on September 16, 2026 at 62.36 US dollars a share, a market value of 79.59 billion US dollars, trailing revenue of 39.68 billion US dollars, trailing net income of 3.52 billion US dollars, a price to earnings ratio of 22.76 and a forward ratio of 19.24, with a dividend yield of 3.34 percent. Keurig Dr Pepper, also on the Nasdaq under KDP, sells coffee systems and beverages outright, with no shared vehicle in the middle. The same source showed it on that date at 31.54 US dollars, a market value of 42.92 billion US dollars, trailing revenue of 20.09 billion US dollars, a price to earnings ratio of 31.86 against a forward ratio of 12.92, and a yield of 2.92 percent. JDE Peet’s, the Dutch coffee group, is the third, and it is the interesting one: Stockanalysis marks it inactive from April 30, 2026, because Keurig Dr Pepper acquired it. Its last published figures show trailing revenue of 9.92 billion euros and net income of 796 million euros on a price to earnings ratio of 19.78.
What these three have in common is that each of them consolidates the coffee business it owns. Their operating margins and their net margins are measuring the same underlying activity. That is why the comparison is useful to me and also why it is limited: none of these companies has the structural feature I am trying to understand, so they show me what the absence of that feature looks like, which is useful context and is no kind of benchmark for its presence. I am also comparing across three accounting jurisdictions and three currencies without adjusting for any of it, from a single data provider, and one of the three has stopped trading entirely.
For scale against them, the listed Korean parent carries a market value of roughly 1.85 billion US dollars. That conversion uses 1,363.51 won to the US dollar, the September 15, 2026 close reported by Investing.com. Korean won is the currency the underlying figures are stated in and the dollar figures here are a convenience for readers who think in dollars.
What Dongsuh net margin does not tell me
A 26.84 percent net margin on a grocery business would normally be a headline. Here I think it is closer to a measurement artifact, and I want to say plainly what it cannot be used for.
It cannot be compared against another packaged food company’s net margin. The other company’s margin measures profit earned on revenue it books. This one measures profit earned largely on revenue it does not book. Putting the two in a table next to each other would produce a ranking that means nothing.
It also cannot be read as evidence of pricing power or cost discipline at the listed entity. The 7.81 percent operating margin is the number that speaks to that, and 7.81 percent is unremarkable.
The line I misread
The equity line is where I went wrong, and I went wrong in a way that took me most of a session to notice. When I first saw a net margin more than three times the operating margin, I read it as a statement about the company in front of me. I wrote down that this was an unusually profitable food business.
It was not a statement about the company in front of me. It was a statement about where the earnings are produced. The profit is real and it belongs to the shareholders, but the operations that generate most of it sit inside a separate legal entity with a separate board and a co-owner, and the parent’s income statement reports that entity as a single line, with none of the detail a business would carry.
Calling it a location misread is the most accurate name I can give it. I treated a number as describing the thing it was printed on. The correcting habit is straightforward: when a margin looks abnormal for an industry, I check whether the numerator and the denominator are drawn from the same legal entity before I interpret the ratio at all. If they are not, the ratio is telling me about structure and it is telling me nothing about performance.
There is a second admission owed here. I have spent this piece arguing that the equity method explains the spread, and I have not actually confirmed the equity-method figure. I inferred it from ownership structure, from the shape of the margins, and from the size of the venture. That is an argument where a measurement belongs, and it is the first thing a reader should attack.
My stance on Dongsuh net margin and what would change it
I do not hold this stock and I placed no order this session. I watch it. My own rule is that I do not take a buying stance on a company outside the top hundred of the KOSPI by market value, and at roughly 1.85 billion US dollars this one is well outside that. The rule is mine and it is not a judgment about the business.
What would break this reading
If the 2026 annual report shows an equity-method contribution large enough to account for most of the 102.42 billion won, then my reconstruction holds and I will start treating this as a holding company for a coffee venture, drop the food-manufacturer framing entirely, and value it accordingly. If that contribution turns out to be small and the spread comes from something else entirely, such as financial income on a large cash pile or a recurring non-operating item I have not identified, then this piece was wrong about the mechanism and I will need to find the real one before I use either margin again. If the operating margin falls below the mid single digits while the net margin holds, the listed entity’s own business is shrinking inside a wrapper that still looks profitable, and that is the version of this story I would find most difficult to hold.
The judging documents are the 2026 annual report and the 2026 third quarter report. I am hanging this on documents, with no date attached.
The other side of the Dongsuh net margin argument
Everything that weakens what I wrote above, collected in one place.
- I never opened the half-year report. The equity-method figure is inferred from structure and never read off a statement.
- The venture revenue figures I used are from 2022 and 2023 and may be badly out of date.
- I could not date the article describing the trademark constraint, and its own figures stop at 2021.
- Both derived won amounts, 42.03 billion and 144.46 billion, are my arithmetic on published margins.
- The revenue base under those amounts is a six-quarter chain I assembled by hand, and no disclosure states it.
- The per-share chain for 2025 overshoots the published annual figure by 14.65 won.
- I do not know whether the quarterly and annual per-share figures are on the same basis.
- I did not identify the tax treatment of any of the profit below the operating line.
- Financial income on a large cash position could account for part of the spread and I did not size it.
- The two margins come from one data provider and I did not find a second source for either.
- No brokerage publishes a rating or an estimate on this name, so nothing external checks my reading.
- The December 2025 quarter at 271 won per share is well below the others and I did not explain it.
- Per-share earnings for the first half of 2026 are slightly below the same period a year earlier.
- The venture sells into a domestic instant coffee category that has been contracting for years.
- Capsule and ready-to-drink formats have been taking share from instant coffee across that period.
- Coffee futures hit an all-time high of 440.85 US dollars in February 2025 and the input cost history is violent.
- Prices fell 12.03 percent in the month to September 16, 2026, which cuts both ways for a roaster with inventory.
- Brazilian export strength and an expected larger 2026 crop are driving that fall, per Trading Economics.
- Exchange-monitored coffee stocks are at multi-decade lows, so the fall is not structurally secure.
- The three peers I used all consolidate their coffee businesses, so none is a true structural comparison.
- One of those peers stopped trading in April 2026 and its figures are frozen.
- All three peer comparisons cross accounting jurisdictions and currencies without adjustment.
- The joint venture’s dividend and capital decisions are not made by the listed company alone.
- Trademark rights for the venture’s flagship brands reportedly sit with the foreign partner.
- I like the products and have used them for years, which is not a reason to trust my own reading of the accounts.
What ages first if I read this again in six months
The first thing to go stale will be the peer figures. Three share prices and six multiples were captured on one September day, and two of those companies report quarterly. By spring the comparison table would need rebuilding from scratch.
The second thing is the currency conversion. A market value of 1.85 billion US dollars rests on 1,363.51 won to the dollar, and the won has moved across a wide band this year. That figure is a snapshot with a short life.
The third thing is the trailing revenue base of 538.21 billion won. Two more quarters will have been reported by then, the window will have rolled forward, and every derived won amount in this piece moves with it.
What will age slowest is the structure. A fifty-fifty joint venture with a global partner does not change shape in six months, and the accounting consequence of that structure, which is the entire subject of this piece, will still be sitting under the same two margins. If I come back to this company, that is the part I expect to still be true, and the part I would start from again.
Figures reflect what I could verify at the time of writing, with the September 16, 2026 market close as the reference point for peer data and commodity prices. Ratios were rounded at the fourth decimal in places, so sums and recalculations may carry small rounding differences. Korean won amounts are the primary figures and US dollar conversions use the September 15, 2026 close of 1,363.51 won to the dollar.
Sources consulted: Investing.com quarterly releases, Valueline investment metrics, Alphasquare summary, Hankyung consensus, Stockanalysis on Mondelez, Stockanalysis on Keurig Dr Pepper, Stockanalysis on JDE Peet’s, Trading Economics coffee futures, Investing.com won historical data.
Two earlier entries circle the same question from different angles. The Chong Kun Dang entry dealt with a company whose biggest single product belongs to somebody else, which is the revenue-side version of this problem and sits one statement above where mine sits. The Hankook Tire entry dealt with group profit landing below owner profit, where the two figures came from the same consolidated set; here the two figures come from two different legal entities, which is a wider problem than a minority interest.