The KOSPI Selloff Wasn’t the Index: It Was the Leverage
One. Calling the KOSPI selloff “underperformance” is wrong. The July 24 close is up 58.8% from last year’s close — the best of every major index I compared.
Two. Over the same period the KOSDAQ is down 19.2%. What rose was not Korean equities but two semiconductor names, and what is now unwinding is the leverage stacked on those two.
Three. Good news stops working not because the news is weak but because the market’s focus moved from this quarter’s earnings to the durability of 2027 capital spending. So I am not buying the index here; I am waiting for that specific thing to be confirmed.
About a month ago, when the KOSPI cleared 9,000, I did not think much of it. I knew semiconductors had carried it there and I knew a correction would come eventually. What I did not do was count one particular number: how much foreign investors had sold on the way up.
Checking afterwards was uncomfortable. Cumulative foreign net selling in the first half of 2026 was ₩150.26 trillion, roughly $103 billion — the largest half-year figure on record. Samsung Electronics accounted for ₩75.51 trillion of it and SK hynix ₩60.53 trillion; those two names were more than 90% of the total. Over the same six months the KOSPI rose 91.9%.
If ₩150 trillion of selling coincided with the index nearly doubling, somebody was absorbing it. I had not asked who. Understanding this selloff meant starting the count there.
Contents
Why the KOSPI selloff is not an underperformance story
The facts first. The KOSPI’s record close was 9,114.55 on June 22. Its July 24 close was 6,690.62, down 5.72% on the day — 26.6% below the peak on my own calculation. Korea has triggered seven circuit breakers in 2026 alone; of the thirteen ever recorded since the mechanism was introduced in 2000, seven happened this year.
Read that far and it is a collapse. Change the starting point and the picture inverts.
| Index | 2026-07-24 close | YTD (my calculation) |
|---|---|---|
| KOSPI | 6,690.62 | +58.8% |
| Taiwan TAIEX | 43,654.84 | +50.7% |
| Nikkei 225 | 64,611.15 | +28.4% |
| S&P 500 | 7,411.98 | +8.3% |
| Nasdaq Composite | 24,975.82 | +7.5% |
| KOSDAQ | 748.22 | -19.2% |
Sources: July 24, 2026 closing reports for each market. YTD figures are my own calculation against 2025 year-end closes. All figures are closes, not intraday.
Down 26% and still first. And inside a single country, the KOSPI is +58.8% while the KOSDAQ is −19.2%. Building that table changed my question. Not “why is Korea lagging,” but “why did Korea split like this internally.”
The answer is not complicated. This rally was not Korean equities rising; it was two semiconductor names lifting an index. Through the July 14 close alone, the semiconductor sub-index was down 22.80%, Samsung Electronics 21.26%, SK hynix 27.81%, and ₩1,312 trillion — roughly $902 billion — of market value evaporated in the process. The KOSDAQ never boarded the rally, so it had nothing to give back.
The KOSPI selloff’s fingerprints are domestic, not foreign
Take July 24 on its own and an odd combination appears.
The US was flat that day
The S&P 500 closed +0.05%. The Nasdaq Composite was −0.64%. On a day when American equities barely moved, the KOSPI fell 5.72%. And the won’s onshore close was ₩1,466.6 per dollar, 0.2 won stronger than the prior session.
That combination decided it for me. When foreign investors are exiting at scale, the currency moves. It did not. And domestic retail investors were net buyers of ₩5.18 trillion, about $3.6 billion, that same day. This is not the picture of foreigners dumping into retail hands. It is the picture of something inside the market being liquidated involuntarily.
Margin debt peaked, then broke
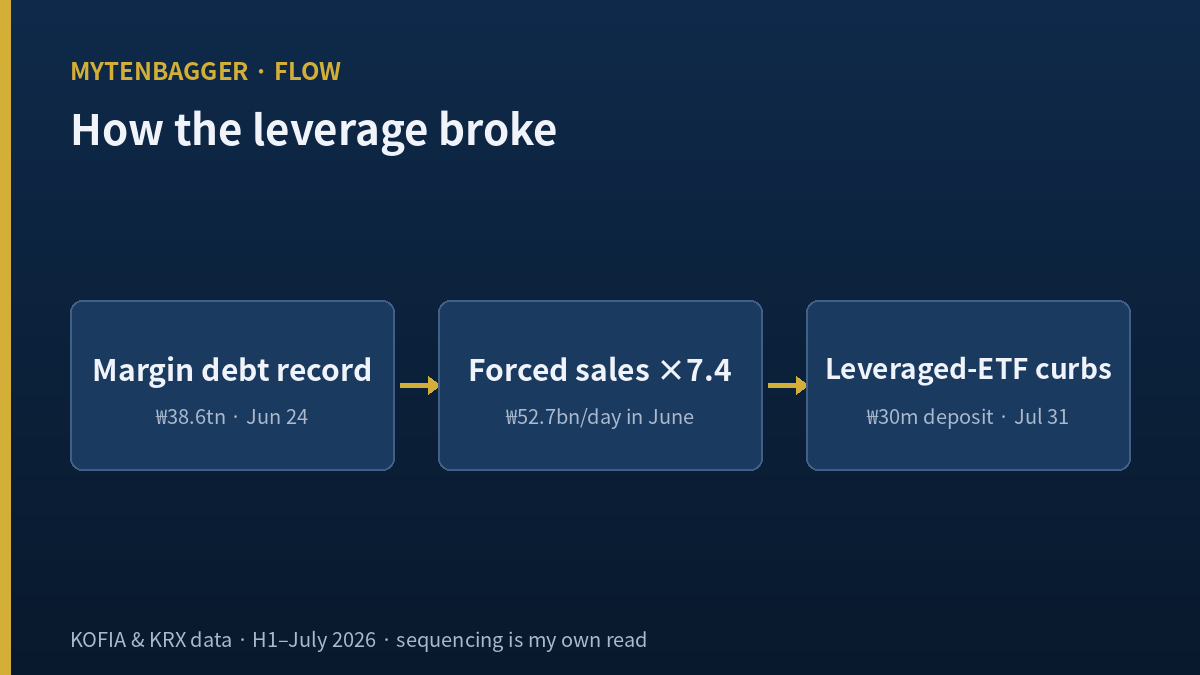
Korea Financial Investment Association data puts margin loan balances at a record ₩38.63 trillion on June 24, roughly $26.6 billion — up nearly ₩10 trillion from ₩27.3 trillion at the end of 2025. By July 23 the balance was ₩32.75 trillion. Around ₩5.9 trillion, or 15%, disappeared in a month. KOSDAQ margin balances fell 23.9% over the same stretch.
Forced liquidation shows the pace. Daily average forced sales ran ₩7.1 billion in 2025 and reached ₩52.7 billion in June 2026 — 7.4 times higher — with a single day on July 9 at ₩142.2 billion, taking forced sales to 10.2% of outstanding unsettled receivables.
And there was a new instrument
This is the part of the research that genuinely surprised me. Single-stock leveraged ETFs listed in Korea at the end of May. Retail investors bought ₩8.9 trillion — about $6.1 billion — net in roughly one month, accounting for 92% of the flow, with average daily turnover of 105.3% of assets. By July that turnover approached 130%.
The share of total activity is what stopped me. Leveraged and inverse products went from 25.8% of KOSPI trading value on July 1 to 42.6% by July 21. The single largest line by trading value was an SK hynix leveraged product; second was a double-inverse.
Seven of the thirteen circuit breakers in Korean market history occurred in 2026, and five of those came after these products listed at the end of May. I do not read that as coincidence.
Korea’s Financial Supervisory Service banned new listings of single-stock leveraged ETFs on July 20 — a reversal two months after first approving them. On July 24 it announced a rise in the cash deposit requirement from ₩10 million to ₩30 million and pulled the effective date forward from August 5 to July 31. The news of accelerated tightening was itself cited among the drivers of that day’s selling.
Put simply: what broke was not Korean corporate earnings. It was the positioning stacked on top of those earnings.
Why good news stopped working during the KOSPI selloff
The question still stands. AI infrastructure demand is real, governments are spending, earnings are at records — so why does none of it get paid for?
Two cases side by side answer it.
Samsung Electronics reported preliminary Q2 operating profit of ₩89.4 trillion on July 7, about $61 billion, up 1,810% year on year and the largest in its history. The shares fell 8.96% that day.
TSMC reported Q2 revenue of $40.2 billion at a 67.7% gross margin on July 16. Also a record. The next day the shares fell 7.29% and Taiwan’s TAIEX posted its largest single-day point decline ever.
TSMC’s case has a clear cause. In the same release it guided third-quarter gross margin to 65–67%. Against 67.7%, the 66% midpoint implies a 1.7-point decline — my arithmetic. What the market repriced was not the confirmed second quarter but the direction of the next quarter’s margin.
Memory shows the same structure. TrendForce projects third-quarter conventional DRAM contract prices rising 13–18% quarter on quarter, describing it as “a noticeably slower pace than in previous quarters.” Its stated reasons are softening consumer demand, a high base, and contract prices already at record levels reaching the limit of what customers will accept.
Shinhan Investment’s head of research, Yoon Chang-yong, put the regime in one line: what the market is experiencing is “not a recession or an earnings collapse, but doubt about the durability of AI investment.” Hyundai Motor Securities analyst Kim Jae-seung made the same point from the buyer’s seat — investors do not want earnings confirmation, they want confirmation that AI investment will eventually earn an adequate return.
The ₩89.4 trillion was already in the price. What was missing was a hyperscaler commitment to 2027 capital spending.
The 20-point gap I found inside the KOSPI selloff
Here is what I did not know before doing this work.
On FnGuide consensus data compiled by BNK Investment Securities, semiconductors as a share of KOSPI 200 operating profit run as follows: 56% in the first quarter of 2026 (₩94.8 trillion of ₩169.3 trillion), 69% in the second (₩154.5 trillion), an estimated 75% in the third (₩205.4 trillion) and an estimated 77% in the fourth (₩220.5 trillion). Over the same span, non-semiconductor operating profit is estimated to decline 14%.
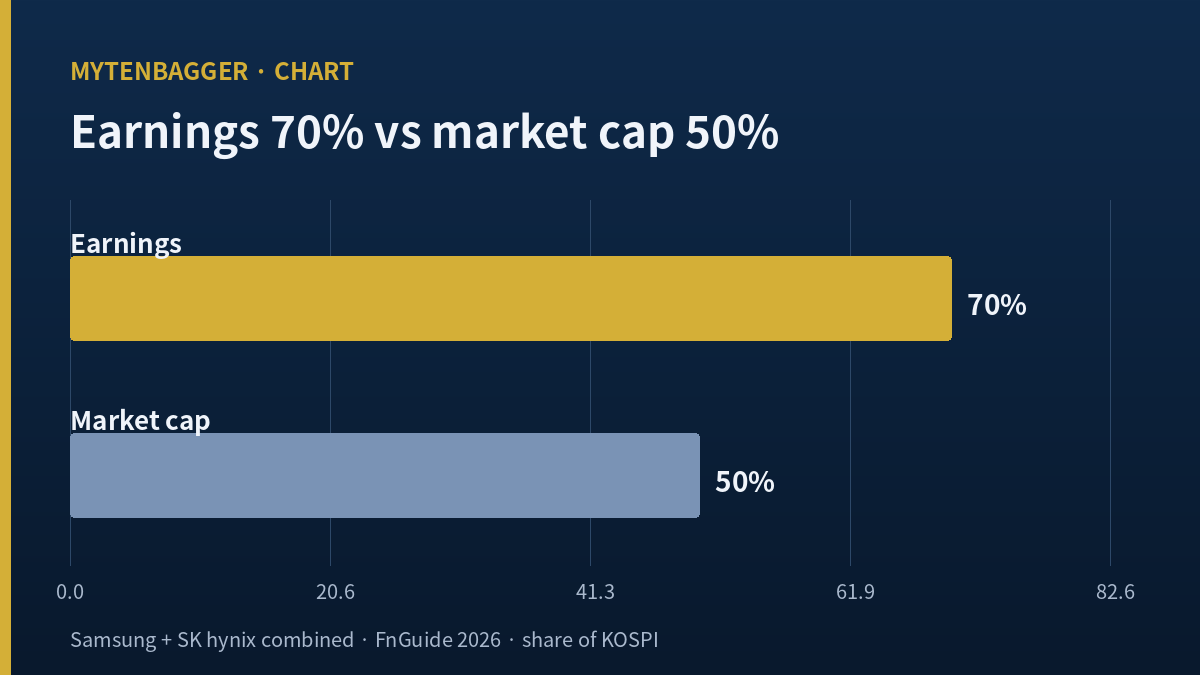
Meanwhile, on FnGuide’s numbers Samsung Electronics and SK hynix together account for roughly 70% of 2026 KOSPI net income — against a combined market-capitalisation weight of about 50%.
Earnings concentration exceeds market-cap concentration by 20 percentage points. I think that gap is the centre of this episode. It means the market was already declining to pay full price for those earnings. A discount on earnings quality was in place before July; July merely made it visible.
Why the discount? As I worked out in the piece taking apart the summit’s $950 billion, what Korea received is not investment but five years of purchase commitments. A commitment is only worth what the counterparty keeps buying. These earnings are therefore contingent on somebody else’s capex decisions, and markets assign lower multiples to contingent earnings. That, I think, is what the 20 points are.
It also explains why the valuation gauges contradict each other. Citi put the KOSPI’s 12-month forward P/E at 5.8x on July 16, below the 6.4x of the 2008 crisis and the 8.5x of the pandemic. Yet the Korea Exchange’s own corporate value programme white paper, published in May, puts Korea’s ten-year average price-to-book from 2016 to 2025 at 1.1x — against 2.3–2.7x today. On earnings it is cheaper than the financial crisis; on book it is more than twice its own decade average. The contradiction exists because the denominator exploded, which means the entire “it’s cheap” case rests on the credibility of next year’s semiconductor earnings estimate.
There is a second, slower reason the rest of the index is not picking up the slack, and it goes to whether Korea captures AI as a user rather than only as a supplier. The commonly cited “28% AI adoption among Korean firms” is a science ministry survey figure from 2022 and is too old to use as a current reading; the Korea Chamber of Commerce’s 2026 work puts generative AI usage at 66.5% at large firms and 52.7% at SMEs. Adoption is not the gap. Conversion is. A Bank of Korea issue note measures AI use as cutting working time by about 3.8%, roughly 1.5 hours a week, while explicitly questioning whether that saved time converts into additional output. The Chamber’s survey supplies the mechanism: large firms redeploy the saved hours into new projects, while SMEs report using them to rest. Firms with no AI roadmap at all run 70.4% of SMEs against 54.4% of large companies. That is what a 14% decline in non-semiconductor operating profit looks like from the inside.
What the KOSPI selloff means if you are not in Korea
This is the part US readers should take seriously, because the linkage got much tighter this year.
Bloomberg reported in mid-July that the 60-day correlation between the KOSPI and the Nasdaq 100 had reached 0.46, a two-year high against a five-year average near 0.16. The same piece quoted PineBridge Investments’ Hani Redha saying “we are all Korean investors now,” and Tigress Financial Partners CIO Ivan Feinseth observing that Korea “has effectively become part of the same volatility ecosystem as Nasdaq.”
There is a reason for that, and it is not sentiment. The leader of the 2026 AI trade was memory, not Nvidia. On year-to-date figures as of early July, Micron was up around 229% and SK hynix around 170%, while Nvidia was up roughly 5.6%. When capex skepticism arrived, the thing that unwound hardest was the thing that had run hardest — and the market where memory is roughly half of total capitalisation is Korea. This is not Korea being structurally worse. It is Korea holding the most leveraged expression of the same cycle.
Both are dominated by Samsung Electronics and SK hynix, which means you already own the two names in this story and the beta that comes with them. The KOSDAQ, down 19.2% while the KOSPI rose 58.8%, is the part of Korea those funds effectively do not give you.
Three things happening around the KOSPI selloff that are not about AI
I want to be careful not to explain everything with one variable. Three unrelated pressures landed in the same window, and a US reader trying to reconstruct July 24 would miss the day without them.
Oil and the Gulf. Brent crossed $100 on July 23 for the first time since May after Iran’s Revolutionary Guard declared a complete closure of the Strait of Hormuz, following Houthi strikes on two Saudi tankers the day before. For an economy that imports essentially all of its crude, that is a direct margin and inflation shock, and it hit on the eve of the session in question.
Rates turned. The Bank of Korea raised its policy rate from 2.50% to 2.75% on July 16 — a unanimous decision and the first hike in three and a half years, against consumer inflation running 3.1–3.2%, a weak won and household debt. A market whose marginal buyer was running on margin debt does not enjoy a rate turn.
Tariffs stepped up. New US Section 301 tariffs took effect at 00:01 ET on July 24, applying additional duties of 10–12.5% across some sixty economies. Korea moved from 10% to 12.5%, the top of the range, level with Japan and 2.5 points above the EU and Taiwan. Semiconductors are exempt under the bilateral most-favoured-nation understanding, and autos and steel sit under separate Section 232 measures — so this is a secondary factor for the semiconductor complex specifically, but it is not nothing for the rest of the index.
There is a fourth item I will flag without overclaiming. China’s CXMT listed on Shanghai’s STAR Market on July 27, opening 472% above its issue price at a valuation near $489 billion, the largest STAR IPO on record. Its DRAM share reached 8% in the first quarter of 2026 from 3% a year earlier. Bloomberg reported on July 24 that some Asian hedge funds had been selling Samsung and SK hynix to fund CXMT allocations — which is a rotation, not a verdict on Korean competitiveness. The listing came after the selloff, so anyone dating the decline to CXMT has the calendar backwards. On the competitive question itself, Samsung Securities’ Lee Jong-wook argues CXMT’s HBM ambitions target Chinese customers Korean suppliers cannot serve and are “not a zero-sum game,” while KB’s Kim Dong-won points to unproven cost position, HBM3E delays and EUV tool constraints as the binding limits.
The case against my read of the KOSPI selloff
I put the arguments that would make me wrong at equal weight. They are, in fact, the majority view.
Valuation. Citi set a KOSPI objective of 10,000 on July 20, citing a 5.8x forward P/E, 2.3x price-to-book and a projected 248% rise in 2026 net income, and characterising the selling as rebalancing and profit-taking rather than fundamental damage. Morgan Stanley maintained 9,000 on July 22, noting that roughly 70% of July’s market-value decline was semiconductors while the index fell 18%, and arguing this is not a bear market. JPMorgan raised its twelve-month objective to 12,500 on June 25, calling Korea “one of the clearest equity-market plays on the global AI cycle.”
Domestic strategists agree. In a Herald Business survey of seven Korean research heads published July 22, Meritz’s Lee Jin-woo gave a 9,500–10,900 band, Yuanta’s Choi Hyun-jae an upper bound of 10,000, Hana’s Hwang Seung-taek 8,000–9,500 and LS’s Shin Joong-ho 6,300–8,500. All seven named semiconductors and AI as their top sector.
The shortage argument is still live. SK Securities’ Han Dong-hee wrote on July 14 that while slowing memory price growth has historically signalled a peak, “inventory accumulation is not even at a stage worth discussing.” Meritz’s Kim Sun-woo models second-half DRAM demand fulfilment at 75–80%, falling to 60% in 2027. KB Securities research head Kim Dong-won said next year “will be the tightest supply in the 70-year history of semiconductors.”
And the selling inventory has shrunk. Margin debt is already down 15% from the peak, and securities lending balances fell from ₩195.3 trillion on June 15 to ₩152.77 trillion on July 13 — more than ₩42 trillion, roughly $29 billion, out of the system. IBK Investment’s Byun Jun-ho points to 20- and 60-day disparity ratios of 83–84 as an empirical floor outside 2008 and the pandemic, putting a short-term bottom near 6,500.
The bear case against the bull case also exists. Morgan Stanley has flagged a possible fourth-quarter peak in memory prices. BNK Investment’s Lee Min-hee holds SK hynix at an objective of ₩1.85 million, writing that “competitive infrastructure investment by hyperscalers is no longer valid.” And Korea failed even to make MSCI’s watchlist for developed-market reclassification on June 23; the next review is June 2027.
Three questions I am waiting on
This time I write my checkpoints as questions, because the answers either sustain my diagnosis or retire it.
One — does the next rally bring margin debt with it? If the rebound comes with margin balances rising again, I do not trust it; the same structure is simply rebuilding. If the index recovers while balances stay stable below ₩30 trillion, then something real is pushing rather than positioning. The deposit rules taking effect July 31 are the first test.
Two — do hyperscalers commit to 2027 capital spending? If the cause of this episode is next year’s spending durability rather than this quarter’s earnings, the answer comes from there. I am watching whether US big tech guidance revises 2027 capex direction upward. If it does, the 20-point discount has room to narrow.
Three — do non-semiconductor earnings turn? KOSPI 200 non-semiconductor operating profit is estimated to fall 14% this year. If that bottoms and reverses, the index stops behaving like a derivative of two stocks. I think this question answers last and matters most — it is where you would see a country that sells AI becoming a country that uses it.
If all three point the same way, I change my diagnosis. Right now only the first is producing answers; the other two are still open.
So what am I doing
I did not buy the index into this decline. The reasons are all above, but there is one more. When I was looking at 9,000 in June, the number I failed to count was margin debt — and I judged the index without it. That is the mistake this work surfaced, and I would rather not repeat it on the way back up. Three weeks earlier I had read the same two-chip concentration and kept averaging down inside my own book — the variable I had not counted then was the leverage stacked on top of those two names.
Honestly, I have not settled on which ruler to use between Citi’s 5.8x and the exchange’s 1.1x decade average. Earnings have never grown at this rate, so there is no past to compare against. Rather than judging on valuation, I have decided to watch the speed at which positioning normalises. Margin balances and the leveraged-product share of turnover are my two gauges.
To close on the question this started with: the AI build-out is early, infrastructure demand is real, and governments are spending. All of that is true. What is also true is that Korea’s market was not the original of that cycle but its most leveraged expression — which is why it rose the most and gave back the most. The line Bloomberg quoted in July was exact. We are all Korean investors now. That is a compliment and a warning in the same sentence. How much of that you carry is a question only you can size.
Material behind this: The Korea Herald on margin loan balances, Reuters on Korea’s margin loan risks, CSIS on the boom and the bubble beneath it, CNBC on the KOSPI entering bear territory, TrendForce on third-quarter memory pricing, Focus Taiwan on the TAIEX record point drop, and TSMC’s Q2 2026 release with guidance. Korean-language figures — margin balances, investor flows, sell-side objectives and the FnGuide earnings split — are cited by institution, analyst and date; those renderings are mine, not English-language originals. Won conversions use roughly ₩1,455 per dollar and are also mine.