Daewon Kang Up Earnings: Gross Profit Rose Five Years Straight
Daewon Kang Up stock closed at about 3.57 US dollars on September 23, 2026.
- Never · gross profit fell in any of the last five reported years. It went from 63.41 billion won to 160.81 billion won, or 2.54 times.
- Twice · operating profit changed direction across those same five years, and the 2024 turn took it down to 22.56 billion won from 59.17 billion.
- Once · I had to build the line between them myself. Gross profit minus operating profit gives selling and administrative expense, and in 2024 that figure rose 3.04 times as fast as gross profit did.
One line on this company’s income statement has not fallen in five years. That is unusual enough on its own, and it is not the line most people look at.
Daewon Kang Up makes suspension springs and automotive seating. It is listed in Seoul on the KOSPI, Korea’s main board, which functions roughly the way the S&P 500 index does as the country’s headline equity market. The company reported 1,599.07 billion won of revenue in 2025, about 1.18 billion US dollars at the September 23, 2026 rate. Against that, the entire company is priced at 300.7 billion won, roughly 221 million dollars. Revenue is 5.32 times what the market pays for the whole business.
Contents
One line on the Daewon Kang Up stock income statement has never fallen
Here are five years of the three lines that matter for what follows. The first two come from filed statements. The third is mine.
| Item (billion won) | 2021 | 2022 | 2023 | 2024 | 2025 |
|---|---|---|---|---|---|
| Revenue | 862.22 | 1,024.45 | 1,106.76 | 1,367.59 | 1,599.07 |
| Gross profit | 63.41 | 87.51 | 129.94 | 147.85 | 160.81 |
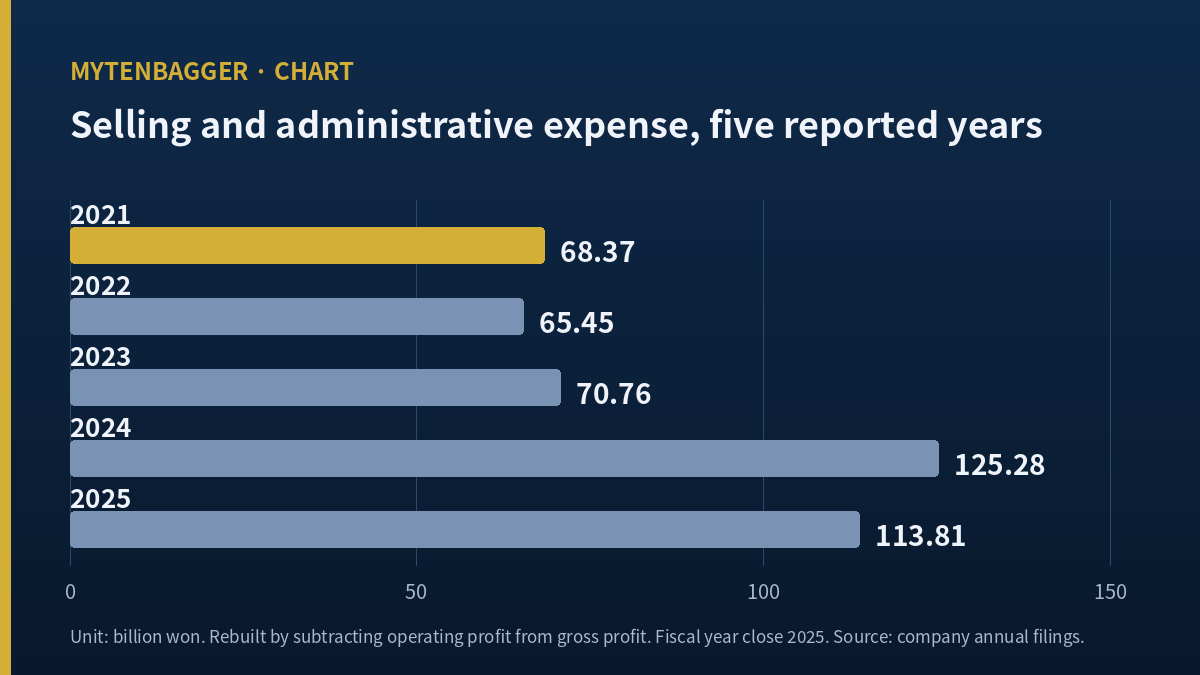
| Selling and admin (rebuilt) | 68.37 | 65.45 | 70.76 | 125.28 | 113.81 |
| Operating profit | -4.96 | 22.06 | 59.17 | 22.56 | 47.01 |
Sources: Hankyung annual financial summary for revenue and operating profit, Investing.com annual statements for gross profit. The third row I built myself: gross profit minus operating profit. As of the 2025 fiscal year close.
Gross profit rose in every one of the four year-over-year steps. Operating profit rose, rose, fell, then rose. The revenue line above both of them rose four times in a row as well, ending 85.46% above where it started.
The other Daewon Kang Up stock profit line changed direction twice
Two of those four steps are worth separating. In 2023 operating profit reached 59.17 billion won, which is 5.346% of that year’s revenue and the best of the five readings. In 2024 it fell to 22.56 billion won, or 1.650% of revenue. In 2025 it recovered to 47.01 billion won, 2.940% of revenue, still below the 2023 figure while revenue was 44.48% higher than in 2023.
Gross profit as a share of revenue tells a much calmer story over the same span: 7.354%, 8.542%, 11.740%, 10.811%, 10.057%. It peaked in the same year and has eased since, but gently. Measured against its own peak, that share has given up 14.34% of itself. Operating profit as a share of revenue has given up 45.02% of its peak. The lower line lost more than three times as much of itself as the upper one did.
What sits between them, and why Daewon Kang Up stock owners cannot see it directly
The distance between gross profit and operating profit is selling and administrative expense. The republished statements I could reach do not print that line for this company. So I made it by subtraction, and I am flagging that openly, because a rebuilt figure carries whatever error either input carries.
Read down that rebuilt row and the movement is different from anything above it. It falls in 2022. It rises modestly in 2023. Then in 2024 it goes from 70.76 billion won to 125.28 billion won.
The middle line taught me my own reflex
The middle line is the one I have skipped for years. When a company I follow posts weaker operating profit on stronger revenue, my first move has always been the cost of sales side, because that is where an auto parts supplier lives: steel, labor, utilization of a plant. I open the gross number, see whether it held, and stop there. It held here. It held for five straight years. Writing this, I realized that my reflex would have closed the file at exactly the point where the answer began. What I want to do differently is simple enough to state: when the top line and the bottom line disagree, build the line in between before deciding which of the two is lying.
2024: the year overhead outran gross profit three to one
Set the two 2024 changes side by side. Gross profit gained 17.91 billion won on the prior year, a rise of 13.79%. The rebuilt expense line gained 54.52 billion won, a rise of 77.04%. Divide the second by the first and the answer is 3.0437. Overhead grew a little over three times as fast as the profit it was being subtracted from.
That is the whole of the 2024 operating profit collapse, arithmetically. Gross profit was up. Revenue was up 23.57%. The only place the money could have gone is the line I rebuilt, and it went there.
Scaled against revenue, only one Daewon Kang Up stock reading stands out
A company that grew revenue 85.46% in four years should spend more in absolute terms. So the honest test is not the size of the expense line but its share of the revenue it supports. Dividing my rebuilt row by revenue gives 7.929% for 2021, 6.389% for 2022, 6.394% for 2023, 9.161% for 2024, and 7.117% for 2025.
Four of those five readings fall inside a 1.54 point spread. The fifth, 2024, sits 2.767 points above the year before it and 2.044 points above the year after. Growth alone does not produce that. If the 2024 spending had held the 2023 share of 6.394%, the expense line would have been 87.44 billion won against the 125.28 billion it reached, and operating profit that year would have landed near 60.4 billion won, which is roughly where 2023 finished. That second figure is my own arithmetic on a hypothetical and belongs to me alone.
Read it the other way and the point survives. Between 2023 and 2025 the company added 492.32 billion won of revenue and 30.88 billion won of gross profit. Over the same two years the rebuilt expense line added 43.04 billion won. More of the incremental gross profit went into the line below it than came out the other side.
The five-year multiples all start from a loss year
Every growth figure I have quoted uses 2021 as its first reading, and 2021 is the year this company reported an operating loss of 4.96 billion won on 862.22 billion won of revenue. A gross profit line that has grown 2.54 times since then looks more impressive than the same line measured from 2022, where it becomes 1.84 times. I am leaving 2021 in because it is the fifth reading I have and dropping it would be a choice made to flatter the series, but the reader should discount the multiples accordingly.
One thing that does not need discounting is the denominator underneath every per-share figure here. Dividing each reported annual net profit by 62,000,000 shares reproduces the earnings per share those republished statements print for 2021, 2022 and 2023 to within about a tenth of a won each time. The share total has not moved across the whole span, so nothing in the per-share arithmetic is being distorted by new shares or by retirements.
I looked at a Korean furniture maker not long ago whose profitability limit sat at the revenue line itself and not in its overhead. This company is the mirror image of that one. Its gross line has been steady and improving; its limit showed up entirely below that point, in a single year, and then partly reversed.
2025 took some of it back, and Daewon Kang Up stock has held near that level since
In 2025 the rebuilt expense line fell 11.48 billion won, down 9.16%, while gross profit added 12.97 billion won, up 8.77%. Both moved in the direction that helps. Operating profit more than doubled, to 47.01 billion won from 22.56 billion.
Two things keep me from calling that a return to normal. The 2025 expense figure is still 60.83% above the 2023 figure, so more than half the 2024 step is still in the numbers. And the 2025 operating profit share of revenue, 2.940%, is closer to the 2022 reading of 2.153% than to the 2023 reading of 5.346%. Whatever 2023 was, the company has not gone back to it on this line.
The first quarter of 2026 is the only newer reading I have
The company reported first quarter 2026 revenue of 432.81 billion won on May 14, 2026, up 13.3% on the same quarter a year earlier, with operating profit of 23.3 billion won and net profit of 35.0 billion won. A half-year report followed on August 19, 2026, but I could not open the original filing, so I have no second quarter gross profit and therefore no newer reading of that row. That is a real gap and I am leaving it marked as one.
Within the same Korean auto parts group I have previously traced a supplier still carrying borrowings from a 2022 acquisition. That piece followed money leaving the balance sheet. This one follows money leaving the income statement, one line lower than where I usually stop.
One more caution belongs next to every annual figure above. The quarterly earnings per share this company reported through 2025 read 194.00 won, 111.00 won, negative 81.00 won, and 362.10 won, with 474.40 won following in the first quarter of 2026. The third quarter of 2025 was a loss quarter inside a year I have been describing as the strongest of the five. Annual readings hide that, and my rebuilt expense row is annual only, so it cannot show me when inside a year the overhead landed.
Those four 2025 quarters sum to 586.10 won. Dividing the reported 2025 net profit of 36.42 billion won by 62,000,000 shares gives 587.42 won. The two close to within 1.32 won, which is the kind of agreement I want before trusting a series I assembled from more than one source. It does not make the annual row right. It makes the inputs consistent with each other.
Where Daewon Kang Up stock sits for a reader pricing in dollars
For a reader pricing this in dollars, the picture is a large revenue line under a small valuation. 2025 revenue of 1,599.07 billion won is about 1.18 billion dollars. The market value of the whole company, 300.7 billion won, is about 221 million dollars. One aggregator puts price to sales at 0.18 times; dividing the two figures above myself gives 0.188.
The twelve-month trading range on this listing runs from 3,140 won to 6,200 won, so the September 23 close sits 55.88% of the way up that span, and foreign investors hold 2.77% of the shares outstanding.
The dividend was 110 won a share for the 2025 fiscal year, about 2.28% against the current price, with a payout share of 18.7% and at least four straight years of payment, per one Korean aggregator’s overview page. Balance sheet detail sits in the group statements as republished by Valueline, which is also where I took the shares outstanding of 62,000,000 that every per-share figure here divides by.
On the ownership side, the largest holder is Hyundai GF Holdings, which Korean disclosure coverage shows has been adding through open-market purchases. I treat that as background. It supports none of what I claim below.
The closest reference name I can give an English reader is Lear Corporation, listed in New York. I picked it on one structure only: of the two things this Korean company makes, I wanted the less prominent one, since springs are the larger part of the business and seating is the smaller. Choosing the smaller side borrows a category name and stops short of inviting a comparison. I did not open Lear’s filings for this piece, and the only thing I know about it here is its name and what it builds, which is why no figure of Lear’s appears anywhere above or below this sentence.
What I did not open and what I left out
The Korean exchange’s original filing viewer refused my requests, so every statement figure above comes from a republished statement set and none from the filing itself. Two aggregators of Korean financial statements were also closed to me.
Forward numbers do not exist that I can find. One international data service leaves the estimate column empty for every quarter it lists for this company, going back to 2024. I widened the search past the usual twelve months, tried the company’s name in six written forms, and reached for two Korean consensus aggregators that were blocked. Nothing forward carries a named author.
Backward numbers exist. A Kyobo Securities analyst named Nam Ju-shin published on March 4, 2024 with a buy opinion and wrote a single per-share value into it, and that document contains two forecast years. Since the day that figure was attached, this company has reported results ten times. I did not calculate the distance between that value and where the shares trade now, and I did not score those two forecast years against what the company went on to report, because this piece is about the movement of two profit lines and not about who was right. Neither of those forecast figures appears anywhere in this article.
I also left out 2024 net profit. One source records it at 23.62 billion won and another at 28.66 billion won, and I could not establish which is the owners share and which is the group total. It is in neither my argument nor my counter-case.
Eight things that cut against Daewon Kang Up stock as I read it
- The expense line belongs to me and to no filing. Every figure in that row is a subtraction I performed. If either input is restated, or if the two sources define gross profit differently, my row moves with them.
- Two sources, two statement sets. Revenue and operating profit came from one aggregator and gross profit from another. They agree on revenue and operating profit to the decimal, which is why I accepted the pairing, but I did not verify them against the filing.
- A one-year jump can be an accounting event. A 77.04% rise in a single year is the kind of move that a reclassification, the first full inclusion of a newly acquired unit, or a one-off provision can produce. I have no note explaining it and I did not find one.
- Five annual readings is a short series. One of the five, 2021, is a loss year, which drags every growth multiple I quoted upward from a weak starting point.
- No second quarter reading. The newest reading of that row I have is a full year old. The company has reported twice since.
- Nobody forward-looking disagrees with me, and that is not comfort. An absence of estimates is an absence of scrutiny. The risk stays where it was.
- Per-share figures diverge across services. Two aggregators print different earnings per share for this company and earnings multiples roughly a third apart from each other. I used neither, because I could not establish which span of quarters each one covers.
- Four sources printed four closing prices. Two showed 4,850 won, one 4,895, one 4,830. I took the value where the market capitalization column divided back to the displayed price and where a labeled session close and its change of 170 won closed arithmetically against the prior 5,020.
Three ways the next two readings could go
I am not assigning odds to these. I have one rebuilt row, five annual points, and no forward model from anyone, and putting a percentage next to a guess would dress it up as something firmer than it is.
The path the last reading points at. The expense line keeps easing toward its 2023 share of revenue while gross profit holds its recent share. On the 2025 revenue figure, returning to a 6.4% expense share would put operating profit somewhere near 58 billion won without a single won of extra sales. That is the version where 2024 was a one-year event the company has already begun to unwind, and the 2025 direction is the first evidence for it.
The path where 2024 was a new floor. The step holds near its current share, gross profit keeps growing at the single-digit pace of 2025, and operating profit stays in the low forties of billions of won while revenue climbs past 1.7 trillion. In that version the company keeps selling more and keeps handing a rising share of the result to the line I had to rebuild, and the price to sales figure of 0.18 times is the market saying exactly that.
The path I cannot model. The 2024 step turns out to be a presentation change, a newly included unit, or a provision, in which case the five-year row I built is comparing things that are not comparable and the whole reading is void. I have no note either way, and the fact that I cannot rule this out is the single biggest reason I am not acting on any of it.
Five conditions that would break what I wrote
- The half-year statements show gross profit falling. The whole premise here is an upper line that has never gone down. One reading in the other direction and the piece is about something else.
- The rebuilt expense line returns near 70 billion won for a full year. That would mean 2024 was a discrete event and not a new level, and my reluctance would lose most of its basis.
- A filing explains the 2024 step as a reclassification. If the jump is presentational, the arithmetic survives and the reading does not.
- A named analyst publishes a 2026 or 2027 model. I would then have something to disagree with, which I currently do not, and the absence I described would close.
- Revenue stops rising. Everything above assumes a growing top line under a wobbling operating line. Remove the growth and the question changes from where the money goes to whether there is money.
The fastest of these to answer is the third, because a filing either says it or does not. The first and second both wait on the Q3 report, whose statutory filing date is November 16, 2026. The fourth and fifth have no date at all. So I will read the third first, and let what it says decide how much weight the other four carry.
Why I am watching Daewon Kang Up stock and not buying it
I hold none of this and I placed no order. At 300.7 billion won the company sits outside the hundred largest listings in Seoul, which is territory I keep on watch by default. What kept me here past that default was the form those two lines took, and what keeps me from acting on it is that the line explaining the gap is one I built and not one I read.
So the date I have written down is November 16, 2026, the statutory date for the third quarter report. If gross profit is still rising and the expense line has kept coming down, the 2024 step reads as an episode and not a level. And I will note that the date may pass without settling it: the report will give me a quarterly figure, and a quarterly figure is not a full year of the row I care about. How would you read the middle line?
Prices and multiples here use the September 23, 2026 close. Dollar figures are approximate, converted at about 1,358.4 won per dollar on that same date, per Money Today’s report of the Seoul market close.
Related reading
- IS Dongseo Q2 Results: Why Standalone Revenue Turned Negative
- POSCO Steelion Operating Leverage: Profit Moved 5.85x Revenue
- Namyang Dairy Q2 Results: Sales Rose as Gross Profit Fell