Korea Airport Service Q2 Results: Profit Fell Faster Than Sales
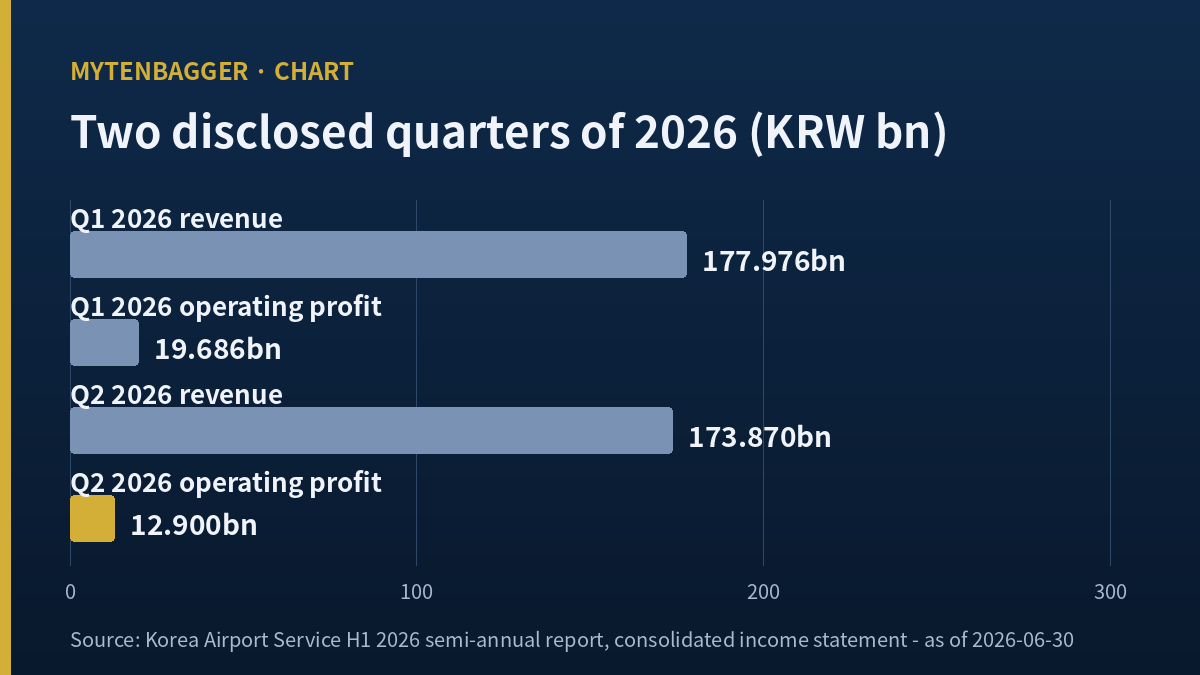
- Both quarters of 2026 are disclosed, and they are nearly the same size on the top line: KRW 177.976bn in the first, KRW 173.87bn in the second.
- Yet the operating profit lines are not close at all: KRW 19.686bn against KRW 12.9bn, a margin of 11.0610 percent against 7.4193 percent.
- And the money lost on the profit line is larger than the money lost on the revenue line, by a factor of 1.6527.
The company gave back more operating profit in its second quarter than it gave back in revenue. That is the sentence I started from, and it is arithmetic before it is an opinion: revenue fell by KRW 4.106bn between the first and second quarters of 2026, and operating profit fell by KRW 6.786bn over the same step. I am watching Korea Airport Service stock without a position, and this is the line that keeps me watching instead of buying.
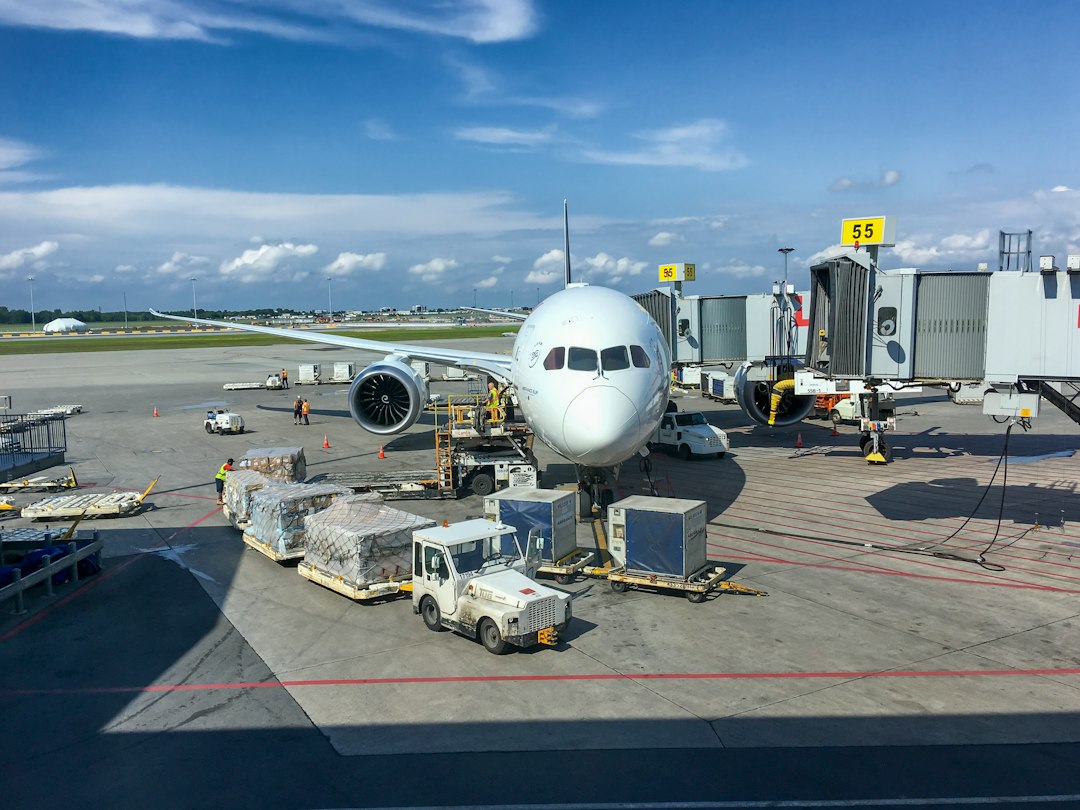
Korea Airport Service (KOSPI: 005430) is a ground handler. It was founded on February 20, 1968, and it works at eleven airports inside South Korea, including Incheon and Gimpo, doing aircraft marshaling and towing, cargo handling, refueling of aircraft, and maintenance support. Korean Air owns 59.54 percent of it. Korean Air is also its largest customer. That single fact sits underneath every number below.
KOSPI is South Korea’s main stock exchange index, roughly what the S&P 500 is to a US reader. At the September 18, 2026 close the company was worth about USD 182.66m, which puts it far outside the country’s hundred largest listings.
Contents
What the second quarter took away
The arithmetic of a KRW 4.106bn decline
Both figures are disclosed. The first quarter came through the May 15, 2026 quarterly filing and was reported in the Korean press as revenue of KRW 177.976bn, operating profit of KRW 19.686bn, and net income of KRW 15.912bn, up 13.46, 35.51 and 39.02 percent from the year before. The second quarter came through a provisional operating results filing on August 10, 2026, with revenue of KRW 173.87bn, operating profit of KRW 12.9bn, and net income of KRW 10.3bn, up 8.5, 12.7 and 9.1 percent from the year before.
So both quarters grew against their own prior-year comparisons. Nothing here is a decline in the ordinary sense. What I am looking at is the step between two consecutive quarters of the same year, and that step is uneven.
Revenue fell KRW 4.106bn, which is 2.3071 percent. Operating profit fell KRW 6.786bn, which is 34.4712 percent. In dollars at the September 18, 2026 rate, the revenue step is roughly USD 2.97m and the profit step is roughly USD 4.91m. I keep writing both, because the percentages make the two numbers look like they belong to different scales, and the won amounts show that they do not.
When the profit a company gives up is larger than the revenue it gives up, cost has moved on its own.
The implication is mechanical. If revenue drops KRW 4.106bn and operating profit drops KRW 6.786bn, then costs rose by about KRW 2.68bn between the two quarters even as the top line shrank. I cannot tell you what rose, because the provisional filing does not break costs out and I did not open the half-year report’s notes. I can tell you the size of the thing I could not open.
One more line is worth putting next to those two. Net income fell from KRW 15.912bn to KRW 10.3bn between the quarters, which is 35.2690 percent. Divide net income by operating profit in each quarter and you get 80.8289 percent in the first and 79.8450 percent in the second, a difference of under one percentage point. In other words, almost nothing happened below the operating line. No unusual financial cost, no tax swing large enough to matter, no one-off gain propping up either quarter. Whatever moved, moved in the space between revenue and operating profit, which is exactly the space this piece is about. I find that narrowing useful, because it lets me stop looking at three lines and look at one.
The two quarters behind Korea Airport Service stock did not cost the same
There is a sequential detail underneath this that the annual table hides. The 2025 quarterly revenue series climbed through the year, at KRW 156.87bn, KRW 160.30bn, KRW 166.97bn and KRW 179.06bn. The fourth quarter of 2025 is therefore the largest single revenue quarter in the series I have. Both 2026 quarters sit below it: KRW 177.976bn and then KRW 173.87bn. Measured sequentially instead of against the prior year, the top line has stepped down twice in a row from that peak, even while every year-on-year comparison stayed positive. Those are two true statements about the same six months, and which one a reader finds more useful depends entirely on the question being asked.
Margins say it more plainly. The first quarter ran an operating margin of 11.0610 percent. The second quarter ran 7.4193 percent. The distance between them is 3.6417 percentage points, on revenue lines that differ by 2.3071 percent.
I want to be careful about what that does and does not mean. It does not mean the business deteriorated. Both quarters beat their own year-ago comparisons, and the half as a whole is the strongest half this company has printed in the four years I looked at. It means the two quarters are not interchangeable, and that anyone annualizing the first one would have produced a number the second one immediately broke.
Four years of margin, and where this half sits inside them
| Year | Revenue (KRW bn) | Operating profit (KRW bn) | Operating margin |
|---|---|---|---|
| 2022 | 400.5 | 2.6 | 0.6492% |
| 2023 | 544.7 | 34.0 | 6.2420% |
| 2024 | 626.5 | 45.0 | 7.1828% |
| 2025 | 663.2 | 47.0 | 7.0869% |
Sources: Chickstock company page and Alphasquare summary for Korea Airport Service (005430). Margins are mine, produced by dividing the second column into the third. Figures are rounded to the nearest KRW 0.1bn as printed.
Two things stand out. The first is the slope from 2022 to 2025: revenue multiplied by 1.6559 while operating profit multiplied by 18.0769. That is what a recovery off a near-zero base looks like, and it is the reason any growth rate quoted from 2022 is close to meaningless.
The second is that 2025 was slightly worse than 2024 on margin, 7.0869 percent against 7.1828 percent, even though revenue grew. That is the first hint that the limit in this business is a real thing and not a story.
I have made that exact mistake in a different sector. When I read four brokerages writing nearly the same figure on a short-haul carrier, what struck me afterwards was how a single strong quarter becomes a full-year assumption without anyone deciding to make it one. I am trying not to do that here.
The parent sets the weather for all four of those years. I worked through the merger arithmetic sitting under Korean Air’s own share price earlier this year, and the thing I carried out of it was how much of this subsidiary’s demand is decided one level up.
Against those four annual numbers, the first half of 2026 at 9.2614 percent is higher than any full year in the table. The first quarter alone, at 11.0610 percent, is higher still. The second quarter, at 7.4193 percent, lands back in the 2024 and 2025 range. I read the half as good and the trajectory inside it as unresolved.
The gap widened, and I can only say so with numbers I made myself
The obvious next question is whether the first quarter is simply the stronger quarter every year. It is, as far as I can see. But the size of the difference changed.
Quarterly revenue for 2025 was KRW 156.87bn, KRW 160.30bn, KRW 166.97bn and KRW 179.06bn. Those four add to KRW 663.20bn, which matches the reported full-year revenue exactly, so I trust the series. Quarterly operating profit for 2025 is not published the same way. I produced it by taking the 2026 figures and dividing out the disclosed year-on-year growth rates: KRW 19.686bn divided by 1.3551 gives about KRW 14.527bn for the first quarter of 2025, and KRW 12.9bn divided by 1.127 gives about KRW 11.446bn for the second.
On those derived figures, the 2025 margins were about 9.2608 percent and 7.1406 percent, a distance of 2.1202 percentage points. The 2026 distance is 3.6417 percentage points. The gap between the two quarters widened by a factor of about 1.7176.
Buying equipment for a network somebody else controls is a timing problem I have looked at before, in a shipping company that bought capacity into a delivery wave. The lesson there was that the spending and the returns sit in different years, and the gap between them is where the reading goes wrong.
Every number in that last paragraph is mine, built out of growth rates that were themselves rounded to one decimal place. A growth rate printed as 12.7 percent could be anything from 12.65 to 12.75, and the operating profit I derived from it moves by roughly KRW 0.06bn across that range. That is small enough not to change the direction and large enough that I will not print those derived figures without saying where they came from.
A rounded percentage almost became a disclosed one
Here is where I stopped while writing this. I had the derived 2025 quarterly margins in a table next to the 2026 ones, formatted identically, four decimal places each. Looking at that table, nothing on its face said that two of the four columns were company figures and two were mine. I very nearly left it that way, because it looked cleaner.
What I did instead was take the derived pair out of the table and move them into prose, where I have to write a sentence about their origin in order to use them at all. The rule I am keeping: when a derived value would sit in the same visual row as a disclosed value, I move the derived value into a sentence instead of fixing the formatting. Formatting can be fixed. A reader’s assumption about what a table is cannot.
No brokerage publishes a forward number on Korea Airport Service stock
I looked for sell-side estimates and did not find current ones. The most recent named research I could locate was from the Korea IR Council’s corporate research center, analyst Kim Seon-ho, dated July 29, 2024, and reported in the Korean business press. Before that, a broadcast research note from August 11, 2017. Neither carries a 2026 or a 2027 estimate. I am recording the coverage gap instead of filling it, and I am not printing any figure either of those two pieces attached to the company, because both dates are far enough back that the figures would mislead more than they inform.
What I did take from the 2024 piece is an argument and no number at all. Kim’s caution was that ground handlers work under a margin cap, because airlines buy this service for reliability and cost control before they buy it for anything else. Two years later, the four annual margins in the table above do not contradict him.
This matters for how I read the second quarter. If the structural cap sits around the high single digits, then 11.0610 percent in a single quarter is the anomaly and 7.4193 percent is the return, and the interesting question stops being why the second quarter was weak and becomes why the first quarter was strong. I do not know the answer. I have put it in my breakpoints.
A Singapore handler that reads Korea Airport Service stock back to me
For a global comparison I went to SATS Ltd, listed in Singapore as SGX: S58, which does ground handling, air cargo handling and in-flight catering. I chose it on one criterion, and it is not a business-similarity criterion: its largest shareholder is not an airline. Temasek Holdings, Singapore’s state investment arm, holds about 40 percent of SATS. Korean Air holds 59.54 percent of the company I am writing about, and Korean Air is simultaneously its biggest customer.
I have taken no financial figure from SATS. No revenue figure, no margin figure, no multiple of any kind. What I took is the size of its map. SATS bought Worldwide Flight Services in 2022 and went from operating in roughly fourteen countries to operating more than 225 stations across 27 countries. That route out exists for a handler whose owner is not the airline it serves.
Reading that back against my own company, I notice something I had not framed properly. I had been treating the eleven-airport domestic footprint as a fact about size. It is better read as a fact about direction: this company grows when its parent’s network grows, and the parent decides that. The peer did not give me a valuation. It gave me a sentence I had been writing loosely and made me write it tightly.
Everything I hold against my own reading of Korea Airport Service stock
- Both 2026 quarters grew year on year. Reading a sequential step as a problem is a choice I made, and a reader could reasonably refuse it.
- The first half of 2026 is the best half in the four years I examined. My headline is about the weaker of two good quarters.
- The second-quarter figure is provisional. Provisional numbers get revised in the confirmed filing.
- I did not open the half-year report’s cost notes, so I cannot name the roughly KRW 2.68bn of cost that moved.
- Ground handling has a seasonal rhythm I have not measured across enough years to model. Two years of quarterly comparison is not a season.
- My 2025 quarterly operating profits are derived from rounded growth rates. If the underlying rates round differently, my widening factor of 1.7176 moves.
- The Korea IR Council note is two years old. Using its argument while refusing its numbers is a position I am taking and it is not a rule I can point to.
- No current forward estimate exists, so I have no external check on whether my reading of the second quarter is consensus or contrarian.
- The company’s largest customer is its controlling shareholder, which means pricing is negotiated across a table where one side owns the other.
- Korean Air and Asiana Airlines are scheduled to merge with effect from December 17, 2026. The ground handling market’s structure after that date has not been published.
- Whether that merger leads to a combination of ground handling subsidiaries is a separate decision, and I found nothing announcing one.
- Roughly 91 percent of revenue is described as aviation support services, which means this is close to a single-line business.
- A US asset manager reported a new 5.01 percent holding on July 29, 2026, bought on July 22, 2026, with the purpose stated as simple investment. I cannot build anything on a stated purpose.
- The second-quarter operating profit is printed only to the nearest KRW 0.1bn in the release I read, so my margin of 7.4193 percent carries that rounding inside it.
- I have not checked whether the fourth quarter was also the largest revenue quarter in the years before 2025. One year of a pattern is not a pattern.
- The half-year report was filed on August 14, 2026, and I worked from the provisional release plus press coverage instead of opening it. That is a choice I made about time, and not a limit on what was available.
- Only two filings reached the market in the last sixty days. That is a thin information flow for a company whose quarters apparently differ this much.
- The stock trades thinly enough that a single session’s close is a weak anchor for anything.
- The statutory deadline for the third-quarter report is November 16, 2026. Until then every figure in this piece describes a period that ended on June 30, 2026.
- I have no position and therefore no cost of being wrong. That makes it cheap for me to hold this view, and I should weight it accordingly.
Three paths, four breakpoints, and where Korea Airport Service stock leaves me
I put rough weights on three paths, and I want to be honest that these are my personal markers and carry no mathematical claim.
About 43 percent, the seasonal reading. The third quarter comes in with a margin somewhere between the 2024 and 2025 annual levels, the first quarter turns out to have been the seasonal peak, and the full year prints a margin modestly above 2025. In that world nothing happened in the second quarter except the time of year.
About 36 percent, the cost reading. The third quarter prints a margin below 7 percent, and the roughly KRW 2.68bn of cost that appeared between the first and second quarters turns out to be a level instead of an event. That is the path where the interesting number stops being revenue growth and starts being the cost line.
About 21 percent, the merger reading. Something about the ground handling market changes around December 17, 2026, in a way that makes the 2026 margin series a poor guide to 2027 in either direction. I cannot split that 21 percent into better and worse, because the published record does not let me.
Four things break my reading, and I have written them so that the first three are answered by one document:
- The third-quarter operating margin. Below 7 percent and the cost reading gains; above 9 percent and the seasonal reading does.
- The cost breakdown in the third-quarter report. If labor costs explain the step, the cap argument gets stronger.
- Whether the third quarter’s revenue holds the roughly 10.9329 percent half-year growth rate. Margin compression alongside slowing revenue is a different animal from margin compression alongside growth.
- Any published statement about ground handling arrangements after December 17, 2026.
I am not long this. I have no order resting. Watching is not a conclusion, and I would rather say that plainly than dress it up as patience.
The order in which I will open this again
Instead of ranking what I am most and least sure of, I am writing down the sequence I will use when I come back to this in November, because the sequence is what I actually learned this time. First, the single-quarter operating margin, computed by me from the quarter’s own two lines. Second, the cost note, if there is one. Third, the year-on-year revenue rate, to see whether the base of that first division is still growing. Fourth, and only fourth, anything about the merger. I did this in the wrong order once while drafting and spent an hour reading merger coverage before I had finished dividing two numbers.
One last note on a word. I never attached the word turnaround to this company, and I want to say why, since a business going from a 0.6492 percent margin to a 7.0869 percent margin in three years invites it. The recovery already happened, and it happened to the airport before it happened to the company. What I am reading now is what a handler looks like once its recovery is finished, which is a much quieter question and the one I would rather be early on.
How do you read the step between those two quarters?
The Korean-side numbers in this piece came from Korean sources. Where a figure is a Korean press report and not a filing, I have said so above.
Prices and the market capitalization reflect the September 18, 2026 close. USD conversions are approximate, at roughly KRW 1,383.3 per dollar on the same date. Quarterly operating profit figures for 2025 are derived by me from disclosed growth rates and are labeled as such wherever they appear.
Sources: the August 10, 2026 provisional operating results filing · annual income statement history for 005430 · quarterly revenue history · Korean press report of the first-quarter 2026 result · Korean press summary of the Korea IR Council note by analyst Kim Seon-ho · ch-aviation on the December 17, 2026 merger date · Journal Aviation on the merger agreement · SATS Ltd company overview
Related reading
- LG Display Q2 Results: A Fifth Second-Quarter Operating Loss
- Korea’s BYC Earns Two Thirds of Its Profit From Rent