Kyung Nong Earnings Peak by June and Shrink by December
The short version
Kyung Nong earnings are a spring story. In 2023, 2024 and 2025 the company made more operating profit between January and June than it kept for the full year. The July to December stretch then lost between KRW 15.3bn and 19.4bn each time. In 2026 the first six months delivered KRW 45.9bn of operating profit, down 4.6% on a year earlier, while revenue rose 9.7%. If the second stretch of the year loses what it lost in 2024 or 2025, full-year operating profit ends near KRW 26.5bn, about 7% below 2025. I do not own the stock, and I am watching for one number: the July to September loss in the report due November 16. I found no named broker with a 2026 estimate on this company. Everything below is built from the company’s own quarterly reports.
Kyung Nong earnings look strong or weak depending entirely on which months you read. Between January and June 2026 the company reported KRW 45.9bn (about USD 33.6m) of operating profit. For all of 2025 it reported KRW 28.7bn. The spring number is bigger than the full-year number, and that has been true in three straight years.
Kyung Nong is a Korean maker of crop protection products (herbicides, insecticides, fungicides) listed on KOSPI, the main board of the Korea Exchange. At the September 28, 2026 close of KRW 9,000 the whole company was worth about KRW 175.7bn, or roughly USD 128.7m. It is a small name with little outside coverage, and I came to it while looking at Korean agricultural suppliers.
A little background for readers new to the name. The company has been listed in Seoul since 1977, according to the dividend lookup site DividendKing, and it belongs to a small Korean business group. It also controls Jobi, a separately listed fertilizer maker, so the group-level figures below include fertilizer as well as crop protection chemicals. Around 8% of its issued shares sit in the company’s own treasury by my estimate, and it retired about 2.17 million treasury shares once before, in April 2021, as Korean outlet Etoday reported. If a further retirement happens, the market value I quote here moves with it, because it is computed on issued shares.
My stance is simple: I am not buying, and I am watching. The reason is not that the spring was bad. The spring was fine. The reason is that the second part of every year takes a large bite out of it, and in 2026 the spring profit came in slightly smaller while sales grew.
Contents
Kyung Nong earnings are made between January and June
Before any table, the pattern in one line: this business earns its year in the planting season and then pays some of it back.
Three years, one pattern
I took the quarterly operating profit figures from Kyung Nong’s filings on DART, Korea’s disclosure system, pulled through the luxrix indicator server. The fourth quarter is the full year minus the nine-month total, since Korean companies do not file a stand-alone December quarter.
Here is what the January to June total looked like against the full year. In 2023, KRW 40.6bn in the first six months against KRW 25.2bn for the year, so the spring was 160.9% of the annual figure. In 2024, KRW 46.0bn against KRW 26.7bn, or 172.2%. In 2025, KRW 48.1bn against KRW 28.7bn, or 167.6%. By my arithmetic the second stretch of the year erased between 38% and 42% of what the spring had produced.
That is not a one-off write-down in one year. It repeats. Sales between July and December ran at KRW 80.3bn to 88.2bn a year, roughly a quarter of annual revenue, and the operating loss on those sales was between 18% and 24% of them. The costs of running a manufacturer and a national sales network do not stop when farmers stop spraying.
One more year belongs in the picture, because it set the bar that the later years have not reached. In 2022 the company made KRW 41.0bn of operating profit on KRW 361.6bn of revenue, or 11.33% of sales. The next three years produced KRW 25.2bn, 26.7bn and 28.7bn, on revenue that never got back to the 2022 level. So the recovery since 2023 has been real but slow, about KRW 1.5bn to 2.0bn a year. A full year at KRW 26.5bn in 2026 would give back most of the last two years of that climb in one go. That is why the size of the July to December loss matters so much more to me than the spring headline.
A December loss I first misread
A December loss was the first thing I noticed in this company’s numbers, and my first reaction was wrong. I saw KRW -15.0bn of operating profit for October to December 2025 and assumed an impairment or an inventory write-down had hit at year end. Then I lined up the same months for 2023 and 2024 and found KRW -11.4bn and KRW -17.7bn. A one-time charge does not show up three years in a row at a similar size. I had been reading a seasonal cost floor as an accident. It took me a while to admit that the loss is part of the business model, and that the real question is how big it gets.
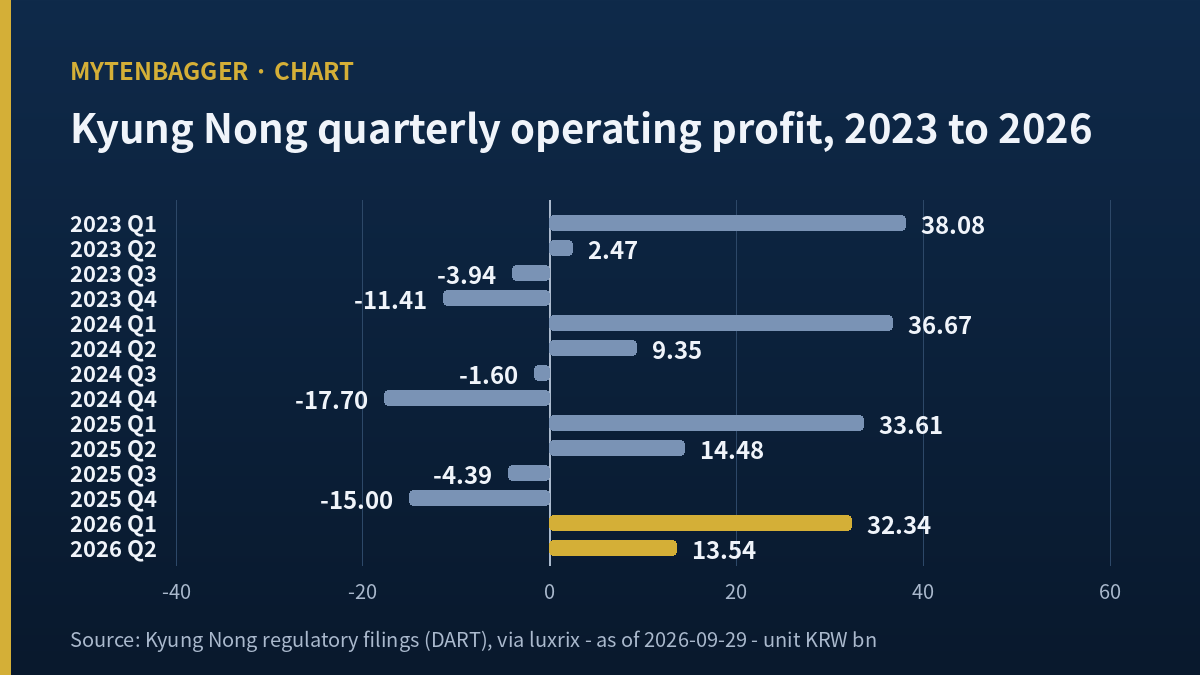
Kyung Nong earnings by quarter, 2023 to 2026
The table puts the four quarters side by side. Figures are group-level operating profit in KRW billions.
| Year | Jan to Mar | Apr to Jun | Jul to Sep | Oct to Dec | Full year |
|---|---|---|---|---|---|
| 2023 | 38.08 | 2.47 | -3.94 | -11.41 | 25.21 |
| 2024 | 36.67 | 9.35 | -1.60 | -17.70 | 26.72 |
| 2025 | 33.61 | 14.48 | -4.39 | -15.00 | 28.70 |
| 2026 | 32.34 | 13.54 | not yet reported | not yet reported | not yet reported |
Source: Kyung Nong quarterly and annual reports on DART (group level), via the luxrix indicator server. October to December is the full year minus the nine-month total. KRW billions.
Two things stand out when I read across the rows. The January to March quarter has shrunk three years in a row, from KRW 38.08bn to 32.34bn, even as it stays the biggest block of profit. And April to June has moved the other way, from KRW 2.47bn in 2023 to 14.48bn in 2025, with 2026 at 13.54bn. The spring has spread out over two quarters.
The loss side is less tidy. July to September swings between a small loss and a modest one. October to December carries most of the damage every year, and 2024 was the worst of the three at KRW -17.70bn.
Revenue follows the same curve, only less violently. Here is group revenue by quarter, in KRW billions, for the years in the table above.
| Year | Jan to Mar | Apr to Jun | Jul to Sep | Oct to Dec |
|---|---|---|---|---|
| 2023 | 159.25 | 103.50 | 42.59 | 42.07 |
| 2024 | 136.72 | 108.19 | 42.83 | 37.44 |
| 2025 | 136.71 | 114.29 | 45.47 | 42.77 |
| 2026 | 153.47 | 121.95 | not yet reported | not yet reported |
Source: same as above. KRW billions, group level.
Set the two tables next to each other and the cost structure becomes visible. July to September sales have sat between KRW 42.6bn and 45.5bn for three years, and the operating result on those sales has stayed between a loss of KRW 1.6bn and a loss of KRW 4.39bn. October to December sales have sat between KRW 37.4bn and 42.8bn, and the loss there has been much deeper, KRW 11.4bn to 17.7bn. Similar sales, very different losses. My guess is that year-end items (bonuses, inventory adjustments, returns from distributors) pile into the last quarter, but I have not seen a breakdown that proves it, so I hold that as a guess.
Kyung Nong earnings in 2026: more sales, slightly less profit
The first six months of 2026 are where my caution starts. Revenue for January to June was KRW 275.4bn, up 9.7% from KRW 251.0bn a year earlier. Operating profit was KRW 45.9bn, down 4.6% from KRW 48.1bn. So operating profit as a share of sales fell from 19.16% to 16.66%.
Both quarters show it. January to March revenue grew 12.3% to KRW 153.5bn, a figure Chickstock also lists in its Kyung Nong earnings page, yet operating profit in that quarter slipped by nearly 4%. April to June revenue grew 6.7% while operating profit slipped 6.5%. Growth in sales did not carry through to profit in either quarter.
There is a detail inside those two quarters that I keep coming back to. Sales growth slowed from 12.3% in January to March to 6.7% in April to June. If that slowing continues, July to September will not bring much extra revenue to soften the usual loss. The spring, in other words, did its growing early, and the part of the year that decides the full-year number may not get the same lift.
I do not have the cost breakdown for 2026 in a form I trust, so I will not pretend to know which line moved. The best outside hint I found is older. When the Korea IR Council, a body that commissions coverage of smaller listed companies, looked at 2025 in June of that year, it expected revenue of KRW 331.8bn and operating profit of KRW 25.6bn, and it warned that raw material prices and wage increases would press on costs even as selling prices rose. That comes from Korean press coverage by Pinpoint News on June 14, 2025, which I am paraphrasing from Korean. The company beat that forecast for 2025. The cost warning, though, fits what I see in the first six months of 2026.
Two other Korean agricultural names I have written up help place this one. NH Nongwoo Bio sells vegetable seeds, a different product with its own spending pattern. KG Chemical sells fertilizer among other things. Kyung Nong sits closest to the farmer’s spraying season, which is why its year tilts so hard toward the spring.
How lopsided is this year? A US comparison
I wanted to know whether this degree of seasonality is simply what crop protection looks like everywhere. So I picked one US-listed company in the same product family and compared a single measure: the share of annual revenue that came from the biggest quarter.
The company is American Vanguard (NYSE: AVD), a crop protection and specialty chemicals supplier. Its 2025 quarterly revenue, as shown on Stock Analysis, was USD 115.8m, 129.31m, 119.31m and 150.69m, for USD 515.11m in total. The biggest quarter, October to December, was 29.25% of the year.
For Kyung Nong in 2025 the biggest quarter was January to March at KRW 136.7bn, which is 40.30% of annual revenue of KRW 339.2bn. In 2023 the same share was 45.84%, in 2024 it was 42.04%. I am setting only this one measure next to AVD. The two firms sell into different farm seasons, different crop mixes and different distribution systems, and I am not comparing their profitability or their valuations at all.
What the comparison tells me is limited but useful. A US supplier that serves more climates and export markets spreads its sales across the year. Kyung Nong sells into one domestic season, and its busiest quarter carries between two-fifths and close to 46% of the year. That concentration is what turns every slow month into a loss.
Three paths for full-year 2026 Kyung Nong earnings
Because the spring is already reported, the full-year result depends almost entirely on how much the rest of 2026 loses. I laid out three paths using only the losses the company itself has reported. The probabilities are my own judgment.
- Same loss as 2024 or 2025 (about 50%). July to December loses about KRW 19.3bn to 19.4bn. Full-year operating profit comes to roughly KRW 26.5bn, between 7% and 8% below 2025. This is my central case because the two most recent years agree with each other.
- A smaller loss, like 2023 (about 30%). The second stretch loses about KRW 15.3bn. Full-year operating profit would be about KRW 30.5bn, 6.4% above 2025. That needs the July to December sales gain to hold without costs following it.
- A bigger loss than any of the three years (about 20%). If the cost pressure that trimmed the spring shows up again in the slow months, the loss could exceed KRW 19.4bn and the full year would fall below KRW 26.5bn. I have no figure for how far below, and I will not invent one.
It helps to put the central path in plain operating terms. KRW 26.5bn of operating profit on about KRW 372bn of revenue, which is what the full year gives if the 9.7% sales growth of the spring holds for all twelve months, would mean operating profit of roughly 7.1% of sales. In 2025 the same figure was 8.46%, and in 2023 it was 7.26%. So even my central case is not a collapse. It is a year that looks a lot like 2023, the weakest of the three, arrived at with higher sales.
The first test comes early. The July to September quarter has lost between KRW 1.6bn and 4.39bn in each of the three years. A loss well outside that band in the report due November 16, 2026 (Mon) would tell me which path is in play before the December months are even counted.
The case that I am being too careful
I owe the other side a fair hearing, so here are the three strongest points against my caution.
- Sales are growing faster than they have in years. January to June revenue rose 9.7% in 2026. Over the full years 2023 to 2025 annual revenue moved within a band of KRW 325.2bn to 347.4bn. If the extra sales continue after June, July to December could lose less, which is the second path above.
- The company beat the only outside forecast I found. The Korea IR Council expected KRW 25.6bn of operating profit for 2025 and the company delivered KRW 28.7bn, KRW 3.1bn more. Outsiders have underestimated this business before.
- The price is low against what it earns. At KRW 175.7bn in market value, the company trades at about 6.1 times its 2025 operating profit by my arithmetic. Even my central path of roughly KRW 26.5bn for 2026 keeps that multiple under 7. A cheap stock can stay cheap, but it rarely needs a great year to justify its price.
There is also a less obvious point in the quarterly table that works in the company’s favor. The April to June quarter has grown from KRW 2.47bn of operating profit in 2023 to 13.54bn in 2026. If the planting season is genuinely stretching into the second quarter (more crops, more spraying rounds, or new products with a later use period), the spring as a whole becomes less fragile, and a single bad March matters less. I cannot prove that from the filings alone. It is the one trend in the table that could make the whole pattern gentler over time.
None of those three points changes the pattern in the table. They change how much the pattern should worry me, and I take the third one seriously.
What would change my mind on Kyung Nong earnings
I am keeping this short, with three conditions.
- A July to September 2026 operating result better than the KRW -1.60bn of 2024 would make me lean toward the smaller-loss path.
- A full-year 2026 operating profit above the KRW 28.7bn of 2025, despite the weaker spring, would show that the slow months can lose less, and that would change my view of the whole business model.
- A January to March 2027 quarter that stops the three-year slide in first-quarter profit would tell me the cost pressure has eased at its source.
The first condition is the one I will see first, on or before November 16. If July to September comes in worse than the KRW -4.39bn of 2025, I will stop giving the second path much weight and treat the central case as the optimistic one.
I should also say what would make me a buyer, since watching is not the same as ruling it out. I would want two things together: a July to December loss that comes in smaller than the KRW 19.4bn of 2025, and a first quarter of 2027 that grows profit along with sales. Either one alone could be luck in the weather or in distributor ordering. Both together would suggest that the cost pressure visible in the 2026 spring was temporary, and at roughly six times operating profit the price would not demand much more than that.
For now, the spring profit is already reported and it is smaller than last year’s. What this company earns for 2026 will be decided by months when very little is sprayed, and I would rather wait to see those months than guess them.
Prices reflect the September 28, 2026 close of KRW 9,000, as shown by both Hankyung Korea Market and Kokstock. Dollar figures are approximate, at roughly KRW 1,365 per dollar, the Seoul closing rate on the same date reported by Money Today. Ratios and multiples are my own and rounded.
Related reading