Samyang Holdings Balance Sheet: Equity Fell in 2025, Assets Held
- Flat.
- Total assets, down 0.3487 percent across 2025.
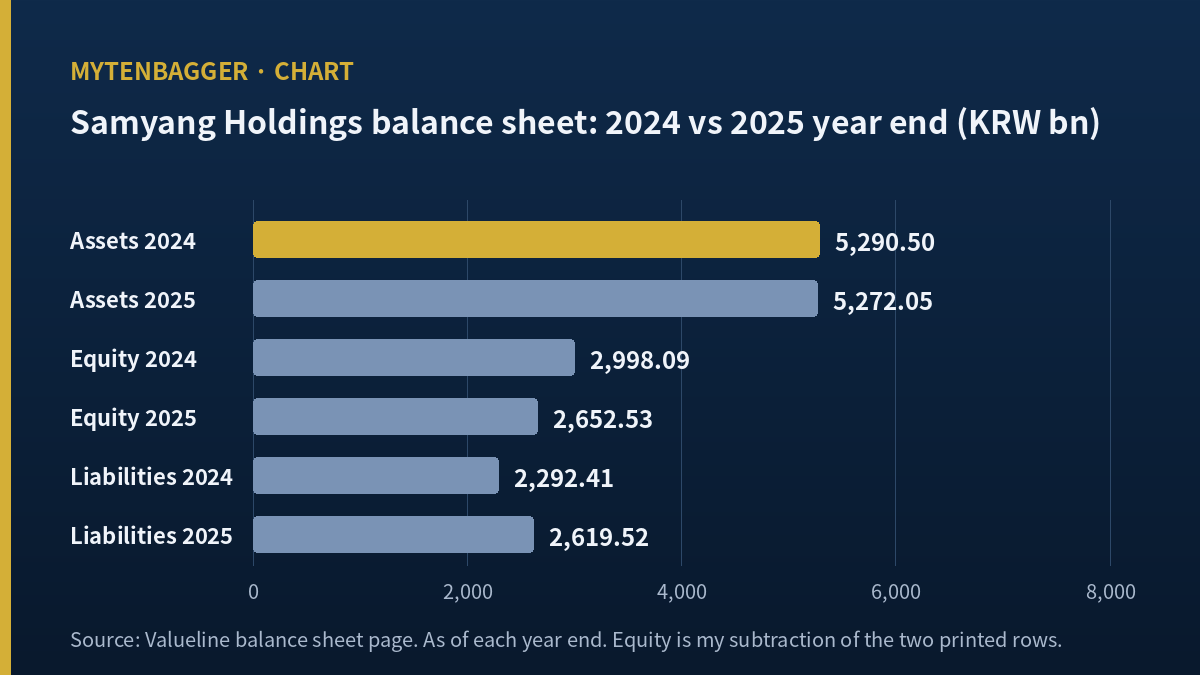
- Underneath that flat total, equity fell KRW 345.56 billion and liabilities rose KRW 327.11 billion, which is why I am watching Samyang Holdings stock and holding no position in it.
Minus 345.56 plus 327.11 equals minus 18.45. Those three numbers, in billions of Korean won, are the whole of what happened to this company’s balance sheet between December 31, 2024 and December 31, 2025.
The last of the three is the only one a screen shows me without arithmetic. Total assets went from KRW 5,290.50 billion to KRW 5,272.05 billion. That is a change of 0.3487 percent, roughly 13.4 million US dollars at the September 21, 2026 close of KRW 1,381.0 per dollar. On any list of Korean mid-caps ordered by balance sheet movement, this company would look like it did nothing at all last year.
It did two large things. They happened to be close to the same size and in opposite directions.
Contents
Two Large Moves That Hid One Another
| Consolidated, KRW bn | Dec 2024 | Dec 2025 | Change | Percent |
|---|---|---|---|---|
| Total assets | 5,290.50 | 5,272.05 | -18.45 | -0.3487 |
| Total liabilities | 2,292.41 | 2,619.52 | +327.11 | +14.2693 |
| Total equity (my subtraction) | 2,998.09 | 2,652.53 | -345.56 | -11.5260 |
| Property, plant and equipment | 1,754.13 | 1,635.11 | -119.02 | -6.7851 |
Source: Valueline balance sheet page, Korean-language data service. As of each year end. The equity row is my own subtraction of the two printed rows above it.
I want to be exact about what I did there. The service prints total assets and total liabilities. It does not print total equity on the page I opened. I subtracted. The arithmetic closes: minus 345.56 plus 327.11 is minus 18.45, which is the printed change in total assets to the second decimal place. When a subtraction of mine reproduces a number the source prints on its own, I treat the subtraction as sound.
In dollars, at the rate above, the equity move is roughly 250.2 million and the liability move is roughly 236.9 million. The net of the two is roughly 13.4 million. Anyone who watches this name through a percent change in total assets saw the third figure and none of the first two.
There is a second way to feel the size of these moves. The same balance sheet expanded by KRW 595.10 billion in the first six months of 2026, a move thirty-two times the size of the full-year 2025 change in the total. A reader who only tracks the headline total would conclude that nothing happened in 2025 and that everything happened in the first half of 2026. On the evidence in front of me the opposite is closer to true: 2025 is the year with two large offsetting moves inside it, and the first half of 2026 is, so far, one directional expansion I have chosen not to open here.

What Samyang Holdings Stock Carried Out of 2024
Samyang Holdings is the operating holding company of the Samyang Group, a Korean industrial family that sells food ingredients and chemicals. Its shares trade on KOSPI, the main Korean index. Two of its subsidiaries, Samyang Corp and Samyang Packaging, are separately listed on the same exchange.
Through 2024 the group also held a pharmaceutical and biotechnology business. On October 21, 2025 an extraordinary shareholder meeting approved a spin-off plan. The new entity, Samyang Biopharm, started on November 1, 2025 and relisted on the Korea Exchange on November 24, 2025. Under Korean spin-off rules of this type, existing holders received shares in both companies at a set split, and this one was struck on book net asset value, according to Korean trade press reporting on the plan.
So the December 2025 balance sheet is the first one without that business in it. And the total barely moved.
Where I first went wrong
My first read was that the spin-off explained the flat total: assets left with the new company, and assets elsewhere grew to fill the gap. That read does not survive the numbers. Current assets fell KRW 105.95 billion, or 5.6776 percent. Non-current assets rose KRW 87.50 billion, or 2.5552 percent. Both moves are an order smaller than either of the two large ones. Nothing on the asset side of this balance sheet is doing the work.
Where the Equity Went
Equity fell KRW 345.56 billion in a single year, which is 11.5260 percent of where it started. I know one large item that pushed on it. The group reported a consolidated net loss for 2025. I am not opening the composition of that loss in this journal entry, because the loss sits mostly at a listed subsidiary and belongs to a different entry, but its existence is enough to explain the direction.
What I cannot settle from the two printed rows alone is how much of the equity drop came from the loss and how much from the spin-off carrying net assets out of the group. Book net asset value is exactly the basis on which the split was struck, so some of the fall is simply the new company leaving and taking net assets with it. I do not know the split between the two causes. I am writing that down as an open item and declining to guess at it.
Three changes to the share count, all on the equity side
Before the spin-off there were two smaller equity events, and both are dated. Over a claim window that ran from April 1 to July 31, 2025, the entire preferred class, 150,894 shares, converted into common stock one for one. The conversion followed the preferred line being flagged by the exchange for having too few shares listed. Then on August 21, 2025 the company retired 280,000 common shares out of its treasury holding, the first such retirement in its history, funded within distributable profit so that stated capital was untouched.
The Korean report I used for those dates prints the treasury position as 12.73 percent of shares before the retirement and 9.8 percent after, with 848,811 shares remaining. It also prints the pre-retirement treasury block as 1,128,726 shares. Those two printed figures do not close: 1,128,726 less 280,000 is 848,726, which is 85 shares away from the 848,811 the same report gives. I am not able to tell which of the two is the typo, so I use neither as a hard input and I note the gap here.
None of this is large against a KRW 345.56 billion equity move. I am recording it because it is the second reason the per-share figures on my services will not reconcile, and because it tells me the board was already acting on the equity line before the spin-off went through.
The Liability Side of Samyang Holdings Stock Did the Offsetting
| Consolidated, KRW bn | Dec 2024 | Dec 2025 | Percent |
|---|---|---|---|
| Current liabilities | 988.83 | 1,437.37 | +45.3610 |
| Non-current liabilities | 1,303.58 | 1,182.14 | -9.3159 |
| Short-term debt | 260.97 | 224.10 | -14.1281 |
| Cash and equivalents | 300.83 | 288.13 | -4.2216 |
Source: Valueline balance sheet page. As of each year end. Percent changes are mine, taken from the printed absolute figures.
This is the part I did not expect. Current liabilities rose KRW 448.54 billion, or 45.3610 percent, which is roughly 324.8 million dollars. Non-current liabilities fell KRW 121.44 billion. So the whole of the liability increase, and more, arrived in the line that comes due within a year.
And it did not arrive as short-term debt. That line fell 14.1281 percent over the same year. Whatever swelled current liabilities by nearly half, it was not bank money carrying that name on the face of the statement.
I checked the obvious alternative, which is that the group simply drew down cash to pay for something. Cash fell only 4.2216 percent. The cash line is too small and moved too little to be part of this story.
I have read a Korean holding company this way once before and been able to close it. With Hanjin KAL the operating line and the holding gains could be separated because both were printed. Here one of the two inputs is missing, and the honest answer is that I stopped.
What I could not open
The page I used prints the totals and a handful of components. It does not break current liabilities into trade payables, accruals, current portion of long-term debt, and the rest. A KRW 448.54 billion move inside one heading, with no component I can see accounting for it, is the single largest thing I do not understand about this company. It is the first item on my breakpoint list below.
Property, Plant and Equipment Fell Too
Fixed assets came down KRW 119.02 billion, or 6.7851 percent, roughly 86.2 million dollars. In a year when a business unit left the group, that is the one asset line where I would expect the departure to show, and it is the one asset line that moved by a visible amount.
I am not claiming the whole 119.02 billion is the spin-off. Plant depreciates, and a group this size retires equipment every year without anyone writing a headline about it. What I will say is that the direction and the rough size are consistent with a unit leaving, and that this is the only place on the asset side where I can point and say the departure might be visible.
Two further things moved down on the asset side and neither is large. Inventories fell 4.4250 percent. Trade receivables fell 8.4274 percent. A company that had lost a fifth of its trading volume would not print numbers like those, which is one reason I think the business that left was small in revenue even though it mattered elsewhere.
The absolute figures behind those two percentages are small. Inventories went from KRW 523.39 billion to KRW 500.23 billion. Trade receivables went from KRW 355.15 billion to KRW 325.22 billion. Put together, the working capital that carries a trading business fell by less than KRW 55 billion across a year in which the group’s composition changed. If a fifth of the earnings power had walked out of a working-capital-heavy business, I would expect a larger print than that, and I do not get one.
Two entries where I did get the equity side to close are SM Entertainment, where equity rose while the share count came down, and BNK Financial, where I could trace six points of a book discount to a cause. Both had the component detail this one is missing.
How the First Half of 2026 Reset Samyang Holdings Stock
The June 2026 balance sheet moves again, and this time the total does not stay still. Total assets went to KRW 5,867.15 billion, up KRW 595.10 billion or 11.2878 percent in six months. Total liabilities went to KRW 3,147.50 billion, up 20.1556 percent. Equity, by my subtraction again, went to KRW 2,719.65 billion, up 2.5305 percent.
Inside that six-month expansion there is a pattern I am deliberately setting aside. I wrote about a company with a very similar asset-side pattern in my previous entry, and my rule is that I do not run the same structure through two pieces back to back even when the material is sitting there. So the June figures appear here as one paragraph of context and nothing more. I will come back to them when the Q3 filing gives me the components.
What I take from the half is narrow. Equity stopped falling. After a year in which it dropped 11.5260 percent, it added 2.5305 percent in six months. That is the first thing on this balance sheet that has moved in the direction a holder would want since the year the business left.
Why I Am Not Buying Samyang Holdings Stock Yet
I hold none of this and I have placed no order. My default for a name this far down the exchange by market value is to watch, and nothing here overturned the default. What I found is one clean arithmetic fact and two open items, which is not a position.
There is also no named sell-side estimate to argue with. I searched the Korean consensus listing that aggregates broker reports and found no entry for this code. Zero houses have published a figure. I am printing no valuation in this piece because there is none to print.
The place where a valuation would sit is occupied by something else. Value Partners Asset Management, a Korean fund manager, sent the company a shareholder letter asking for further treasury share purchases and the retirement of the entire treasury holding, arguing that if the purpose of the spin-off was shareholder value then the full retirement should follow. The company answered that it would consider the matter in future, citing regulatory discussion around treasury shares. A Korean financial outlet reported both positions. In the same report, industry voices argued that against an average price-to-book of 0.56 for Korean holding companies, this company’s roughly 0.3 is not obviously cheap.
One more thing sits on the equity side and I want it on the record even though I did not use it. Two of this group’s subsidiaries are themselves listed on the same exchange, which means part of the equity in my first table is owned by people who are not holders of the parent. Every conclusion in this entry is about the consolidated total and says nothing about the slice that belongs to the parent’s own holders. I have read other Korean groups where that distinction carried the whole argument. Here I could not get the split from the page I opened, so I left the question standing and did not put an estimate on it.
For a peer I looked at Solvay S.A., listed in Brussels, a European chemicals group that separated itself into two listed companies. I am naming it and declining to put it in a table with this one, and I have not checked what its shares did afterwards. The point of naming it is only that separating a listed chemicals business into two is a thing that happens, and that the year of a split is not a year whose figures line up with the years around it.
Nineteen Readings That Work Against Samyang Holdings Stock
- The equity row in my first table is not printed by the source. It is my subtraction, and if the page omits a line between assets and liabilities, my figure is wrong.
- The arithmetic closing to the second decimal place is a check on internal consistency. It says nothing about whether the source itself is right.
- I used one balance sheet service. I did not open the audited filing.
- Year-end to year-end is two points. Anything that happened in between and reversed is invisible to me.
- The KRW 448.54 billion rise in current liabilities has no component I can name. A benign explanation may exist and I have not found it.
- Short-term debt falling while current liabilities rose is unusual enough that I may be misreading what the service puts in each heading.
- I assumed the two headings are defined the same way in both years. A definition change would produce exactly this pattern.
- The fall in property, plant and equipment is consistent with the spin-off, but consistent is not the same as caused.
- Ordinary depreciation on a group this size could account for a meaningful part of the 6.7851 percent.
- I did not split the equity fall between the 2025 loss and the assets that left with the new company. Without that split my reading of the year is incomplete.
- The split was struck on book net asset value, so a material share of the equity decline may be mechanical.
- If most of it is mechanical, the year reads far better than my framing suggests.
- The June 2026 figures are a half-year point and half-year balance sheets in Korea are subject to review and not to a full audit.
- Equity rising 2.5305 percent in six months is a small move and one period is not a trend.
- No brokerage has a published estimate on this code, so there is no informed party on the other side of my reading.
- Industry commentary puts the average price-to-book for Korean holding companies at 0.56, which would make this company’s level look ordinary instead of depressed.
- The fund manager asking for treasury retirement has an interest in the outcome and its letter is an argument. I do not read it as a finding.
- The company deferred that request, and a deferral can last for years.
- I did not open the parent-only accounts at all, so I do not know what funds the dividend this company pays.
Numbers I Left Out
The income statement
Revenue, operating profit and the five-year profitability line are absent here on purpose. They belong to the other half of how I am reading this company and they are not what a balance sheet question needs.
Per-share figures
Book value per share, price to book and earnings per share all print differently across the services I opened. In a twelve-month window this company converted its entire preferred class into common, retired a block of treasury shares, and completed the spin-off. Until I can say which share count sits under each printed per-share figure, I am not using any of them.
One figure with two values
The market value of the new company at relisting appears as one figure in the report I opened and as a different figure in the headline of a report I could not open. Two values, one of them unverified, so neither is in my reasoning.
What I Am Writing Down About Samyang Holdings Stock Today
Five conditions would move me off watching.
- The Q3 2026 report, due by November 16, 2026 under Korean filing rules, breaks current liabilities into components and shows the KRW 448.54 billion has an ordinary trading explanation. That would close my largest open item.
- The same filing shows the opposite, that the rise sits in something structural. Then the flat 2025 total was hiding a second thing as well as the first.
- The company or its auditor publishes the split of the 2025 equity fall between the loss and the assets carried out by the spin-off. Whichever way that splits, my reading of last year changes.
- Equity gives back the 2.5305 percent it added in the first half. One reversal and the only encouraging line on this balance sheet is gone.
- The treasury retirement the fund manager asked for is executed. Every per-share figure I declined to use would then need building again from a new share count, and I would rather do that once, after the event.
The word “consolidated” is where I lost time on this one. I spent an hour treating the 2024 and 2025 columns as the same measuring device before I registered that a company left the group between them. The correction I am keeping: when two year-end columns sit next to each other, check whether the list of companies inside them is the same list, before comparing anything.
One judgment of mine flipped while writing. Before: a balance sheet that barely moved in a year of upheaval is a sign of stability. After: a balance sheet that barely moved in a year of upheaval is a sign that two things moved and I have only found one of them.
The last number to settle was KRW 448.54 billion. Until I had it, I could not write the sentence about short-term debt falling, because I had no size to set against it.
Prices and balance sheet figures reflect the September 21, 2026 close and the stated year ends. Dollar conversions are approximate, at roughly KRW 1,381.0 per dollar on that date, and percentages are rounded at the fourth decimal place.
Related reading