Ottogi Stock: Three Months Without a Single Analyst Note
I went looking for a broker note on Ottogi stock and came back with a sentence instead. The consensus page of the Korean corporate database I use says no opinion has been published on this company within the last three months. This is a KOSPI-listed food maker with a market value of 1.37 trillion won (roughly 970 million dollars) and annual revenue of 3.67 trillion won (roughly 2.59 billion dollars), and for a full quarter nobody with a research license has written anything down about it. So I changed my plan. Instead of copying somebody else’s estimate, I decided to count what is already public and see where it landed.
Two columns I kept open while writing
| What the screen reports | What actually produced it |
|---|---|
| Payout ratio 52.1 percent | Dividend held at 9,000 won while earnings per share fell from 40,004 to 17,270 won |
| Dividend yield 2.63 percent | The share price is 27.3 percent below its 250-day high |
| Price to book 0.57 | Equity stayed, profit did not |
| Price to earnings 19.77 | The same profit decline, read from the other side |
Per-share earnings figures are my own division of reported controlling net profit by the share count. Everything in the left column comes from a Korean vendor feed dated August 7, 2026.
Contents
What I could not find on Ottogi stock
Let me start with the absence, because it shapes everything below. I could not obtain a single forward estimate for this company. The consensus screen at the Korean corporate database returned a notice that no view had been filed in three months, and the 2026 and 2027 revenue and operating profit projections were empty. The market data service I query for ratios returned null for forward earnings per share, null for forward price to earnings, and null for peer multiple.
One international aggregator did carry a number. It shows a twelve-month valuation of 520,000 won from exactly one contributing institution, and the page does not name the brokerage. I do not build on a figure whose author I cannot identify, so that 520,000 won appears nowhere in my arithmetic. The most recent named-brokerage valuation I could locate anywhere was 600,000 won dated January 15, 2025, which is nineteen months old and sits against a completely different profit base. I left that out as well.
The absence itself is the finding. When no house covers a name, every forward field on every screen is blank, and a blank field does not look like a warning. It looks like nothing at all. I ran into an unfilled cell at CJ CheilJedang too, though that one was in the trailing column and this one is in the forward column. So every figure that follows is either a reported result, a disclosure, or something I produced by dividing one of those by the other. Where I produced it, I say so.
Four years of the same 9,000 won, three years of falling profit
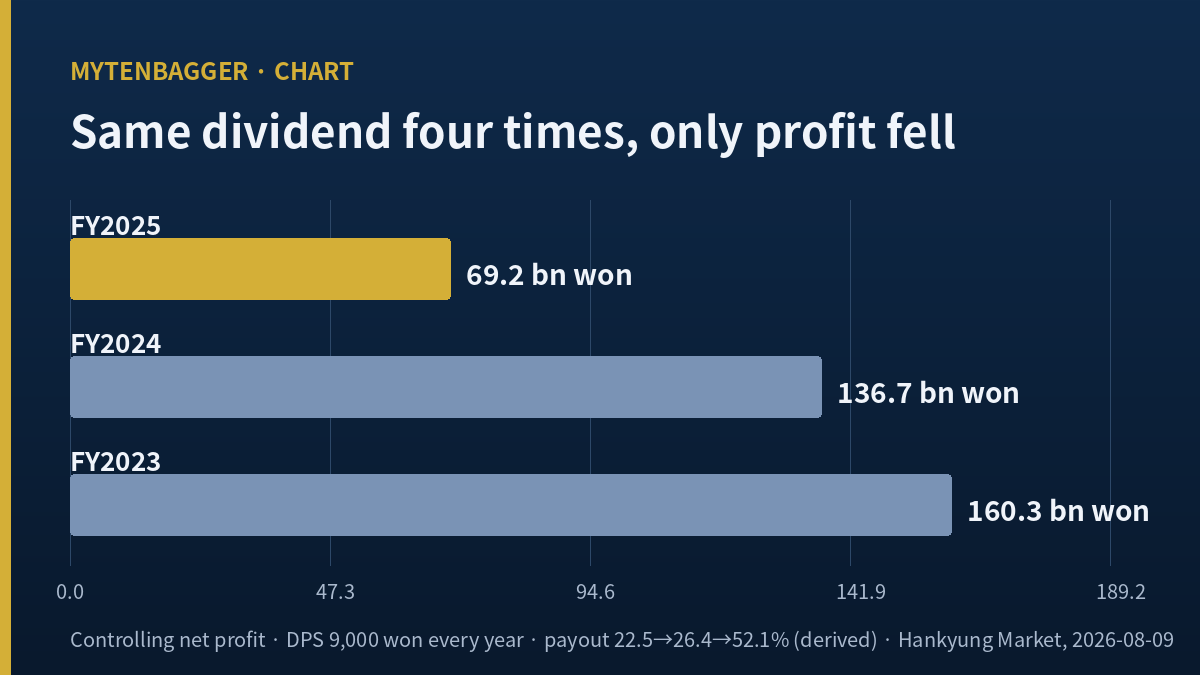
I began with the dividend record. Korean regulatory filings show a dividend of 9,000 won per share for fiscal 2022, 2023, 2024 and 2025. The most recent board decision, announced on February 20, 2026 (Fri), repeated the figure: a total distribution of roughly 31 billion won, a yield on the record-date price of 2.2 percent, a record date of March 27 and a payment date of April 20. The company has never published a payout policy or a distribution target. The amount was simply the same four times.
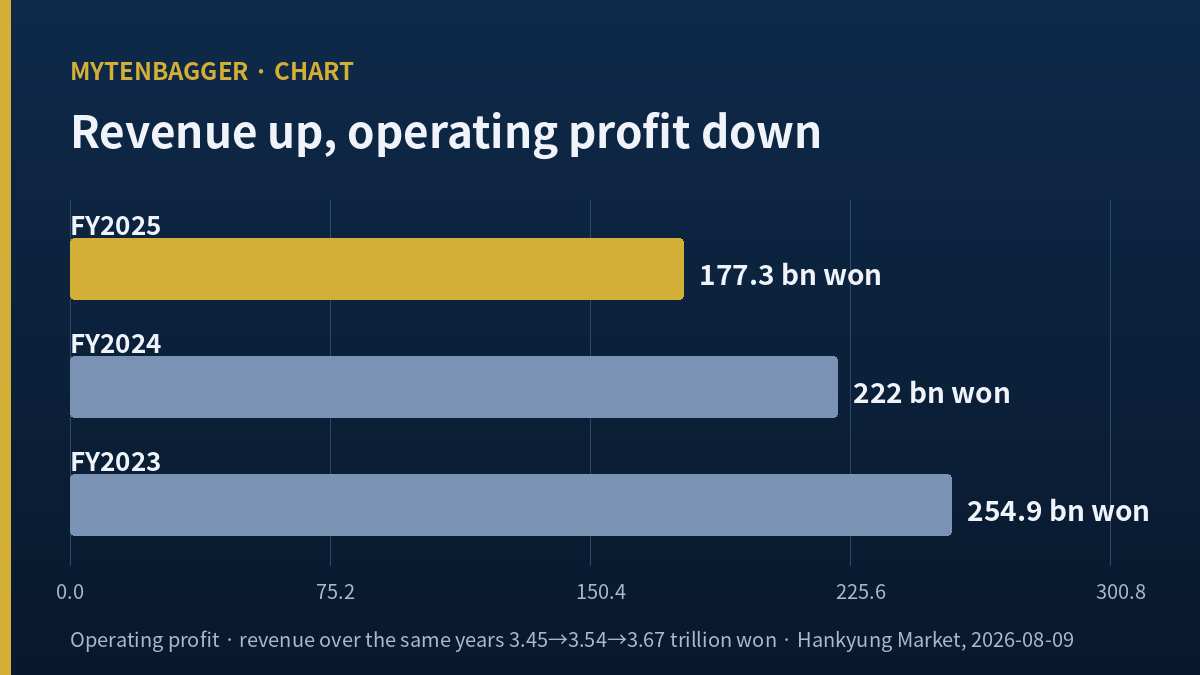
The profit behind it was not. A Korean financial summary service reports consolidated revenue of 3.45 trillion won for 2023, 3.54 trillion for 2024 and 3.67 trillion for 2025, so the top line grew every year. Operating profit went the other way: 254.9 billion won, then 222.0 billion, then 177.3 billion. Controlling net profit fell harder still, from 160.3 billion won to 136.7 billion and then to 69.2 billion won. Three consecutive years of revenue growth sit alongside three consecutive years of profit decline.
Before using that 69.2 billion won I checked which shareholder base it belongs to. Divided by the 4,007,906 shares outstanding it gives 17,270 won per share, and the vendor feed reports earnings per share of 17,273.65 won. The two are 0.02 percent apart, which is close enough for me to treat them as the same basis. Applying the same division to the earlier years produces 34,107 won for 2024 and 40,004 won for 2023.
Now put the unchanged 9,000 won on top of those. The payout ratio comes out at 22.5 percent, then 26.4 percent, then 52.1 percent, all three from my own division. The ratio doubled without the company adding a single won to the dividend. It rose because the earnings being divided into shrank. When I first saw 52.1 percent on a screen I registered it as a generous number, and laying the four years side by side reversed that impression completely.
The company has given its own account of the profit decline. Korean press coverage dated February 9, 2026 (Mon) quotes management citing a weaker won, higher prices for raw and packaging materials, and increased labor and advertising expense. The same coverage notes overseas revenue grew 13.4 percent and its share of the total moved from 10.2 to 11.2 percent. A separate Korean report dated April 28, 2026 (Tue) goes further, putting cost of goods sold at 83.9 percent of revenue and noting that selling and administrative expense rose by roughly 60 billion won over three years. Among the subsidiaries, Ottogi America Holdings posted the largest loss at about 22.7 billion won, and the group recognized an impairment on investment property while its real estate holdings fell by roughly 37.2 billion won from the prior year.
Ottogi stock fell 27 percent and the yield went up
The price moved the same direction as the profit. The figure I am working from is the August 7, 2026 (Fri) close of 341,500 won, roughly 241 dollars. I am writing early on a Sunday, so the last completed trading session is the Friday before. Multiplying that close by 4,007,906 shares gives 1.3687 trillion won, which matches the market capitalization the vendor reports down to the won.
| Item | Value | How I checked it |
|---|---|---|
| Close | 341,500 won | August 7, 2026 (Fri) |
| Market value | 1.3687tn won | Close times share count |
| Price to earnings | 19.77 | Vendor trailing figure |
| Price to book | 0.57 | 341,500 divided by 600,380 |
| Price to sales | 0.37 | Market value divided by revenue |
| Dividend yield | 2.63 percent | 9,000 divided by 341,500 |
| Debt to equity (Korean basis) | 66.61 percent | Vendor feed |
| Interest coverage | 7.71 | Vendor feed |
Over the trailing 250 sessions the intraday high was 470,000 won and the low 290,500 won. The current close is 72.7 percent of that high, which is 27.3 percent below it and 17.6 percent above the low. I computed all three from the close and they agree with the vendor’s own values. By period the shares are down 14.2 percent over twelve months, down 11.53 percent over six, down 4.07 percent over three, and up 7.56 percent over one. Against the moving averages they sit above the twenty-day line at 317,600 won and the sixty-day line at 324,217 won, and below the 120-day line at 347,754 won.
That brings me back to the yield. The February board disclosure recorded a yield of 2.2 percent against the price prevailing at the record date. Against Friday’s close it is 2.63 percent. The dividend in both calculations is the identical 9,000 won. The only thing that changed was the price it is measured against. The improvement in the yield is not something the company did either.
The price to book of 0.57 and the price to earnings of 19.77 sitting in the same table come from the same event. Measured against equity the shares look inexpensive, measured against profit they do not, and the reason the two point opposite ways is that 2025 took a large bite out of earnings while leaving book value largely intact. When profit falls and capital stays, the first multiple compresses and the second expands. I am not going to net those two against each other. They are two outputs of one cause and I record them that way.
The disclosed dividend total is five billion won short of my arithmetic
While rebuilding the payout ratio I hit a mismatch. Nine thousand won multiplied by 4,007,906 shares comes to 36.071 billion won. The disclosure says roughly 31 billion won. That is a gap of more than five billion won, and dividing the gap by 9,000 gives about 563,000 shares.
So I opened the shareholder register. The largest holder, Ham Young-joon together with nineteen related parties, holds 1,998,875 shares or 49.87 percent. Other holders including the employee stock ownership association account for 391 shares, or 0.01 percent. Free float is listed at 1,440,355 shares, or 35.94 percent. Those three add to 85.82 percent, which leaves 14.18 percent carrying no label. Applied to the share count that is 568,285 shares, again my own multiplication.
Then I removed those shares and started over. If 3,439,621 shares receive the dividend, nine thousand won each produces 30.957 billion won. The disclosure said roughly 31 billion. Two independent routes arrived at the same amount, so I treat that 14.18 percent as stock that collects nothing. I have not read a company document that states this in so many words, and that is the limit of what I will claim.
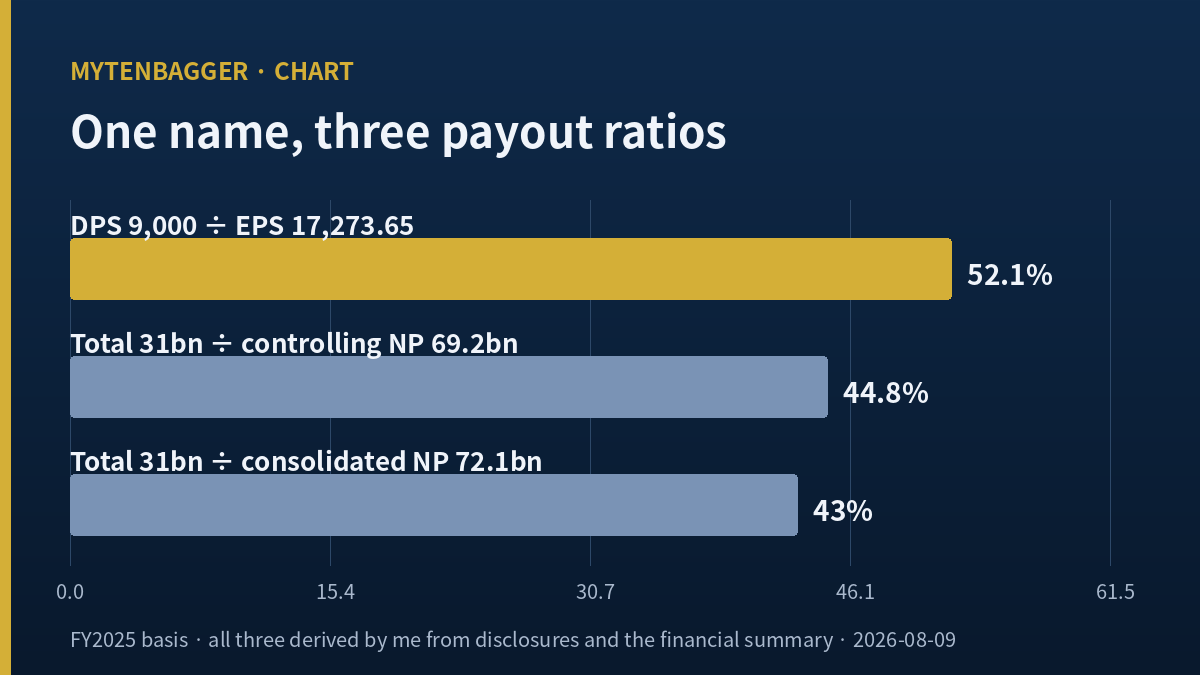
Once that was settled, three different numbers all had a legitimate claim to the name “payout ratio”:
- 52.1 percent, being 9,000 won divided by earnings per share of 17,273.65 won. This is the vendor’s published value and my own division reproduces it.
- 44.8 percent, being the disclosed 31 billion won distribution divided by controlling net profit of 69.2 billion won. My calculation.
- 43.0 percent, being the same 31 billion won divided by consolidated net profit of 72.1 billion won. My calculation. That 72.1 billion is the vendor’s consolidated figure, and the 2.9 billion won difference from the controlling number is the share belonging to minority holders.
None of the three is wrong. But if you say “payout ratio” without saying which base it was computed against, nine percentage points disappear without anybody noticing. For completeness, the same database carries a fourth field showing 35.9 percent, and because I could not establish how that one is derived I did not use it anywhere.
Ottogi stock next to Nongshim, Samyang and one American peer
I pulled two domestic comparisons at the same closing date. Nongshim closed at 405,000 won with a market value of 2.4635 trillion won, fiscal 2025 revenue of 3.5143 trillion won, operating profit of 183.9 billion and net profit of 170.1 billion. Its dividend was 5,000 won from 2022 through 2024 and rose to 6,000 won for fiscal 2025, giving a payout ratio of 21.5 percent and a yield of 1.48 percent. Samyang Foods closed at 1,306,000 won with a market value of 9.8381 trillion won, fiscal 2025 revenue of 2.3518 trillion won, operating profit of 524.2 billion and net profit of 388.7 billion. Its dividend climbed every year, from 1,400 won for 2022 to 2,100, then 3,300, then 4,800, for a payout ratio of 9.3 percent and a yield of 0.37 percent.
Ottogi pays the largest dividend per share of the three. Nine thousand won is 1.5 times what Nongshim pays and 1.88 times what Samyang pays. What the three companies have done with that dividend is the opposite. Samyang raised it in each of four years, Nongshim held it for three years and then raised it once, and Ottogi has repeated the same amount four times. I do not take that to mean the largest payer is the least generous. I take it to mean the three boards are looking at different underlying businesses when they decide.
The first quarter shows what those businesses look like. Korean coverage dated May 20, 2026 (Wed) puts overseas revenue at roughly 11 percent of the total at Ottogi, roughly 40 percent at Nongshim and roughly 82 percent at Samyang. In the same quarter revenue grew 3.7 percent, 4.6 percent and 35 percent respectively, and operating profit grew 3.3 percent, 20.3 percent and 32 percent. Ottogi’s own overseas line was 109.9 billion won, up 9.6 percent, lifting the overseas share to 11.5 percent from 10.9 percent a year earlier. The direction is right and the speed is not comparable.
Outside Korea I found a company with a similar shape. Campbell’s closed the same session at 23.05 dollars with a market value of 6.87 billion dollars, a price to earnings of 11.30 and a forward multiple of 12.05. Trailing revenue of 9.93 billion dollars against net income of 608 million works out to a 6.12 percent net margin by my calculation. The dividend of 1.56 dollars gives a 6.77 percent yield, and against earnings per share of 2.04 dollars that is a 76.5 percent payout, again my calculation. A domestically weighted business, slow growth, a high distribution ratio: all of that overlaps. One thing does not. Twenty analysts cover Campbell’s, and their average valuation of 21.59 dollars sits below the current price. A valuation lower than the market price is still information. On the Ottogi page that field does not exist.
Where I could be wrong about Ottogi stock
That is what my counting produced. Here are four ways it could point the wrong direction. The order carries no weight, it simply follows the order in which I obtained the material.
- The first quarter already turned. Consolidated revenue for the first quarter of 2026 was 955.2 billion won, up 3.7 percent, with operating profit of 59.4 billion up 3.3 percent and net profit of 35.0 billion up 5.5 percent. Several Korean outlets put the operating growth at 3.3 percent and one put it at 3.5 percent, and I used the figure that appeared in more than one place. Management attributed the gain to rice and edible oil products. If 35 billion won repeats for four quarters the annual result comfortably clears 2025 and the 52.1 percent payout ratio deflates on its own, which would make my reading an overinterpretation of a single bad year.
- Part of the 2025 decline may not repeat. A 22.7 billion won loss at the American subsidiary and an impairment on investment property are not annual events. Remove them and earnings per share recovers substantially. I have not verified how those items are classified in the audited statements, though, so I did not run any adjusted calculation that strips them out.
- The balance sheet is not the problem. Debt to equity on the Korean definition is 66.61 percent, interest coverage is 7.71 times, and the equity ratio was 60.50 percent at the end of 2025. A higher payout ratio on its own is not evidence that the dividend is at risk. At current profit the company can keep paying 9,000 won.
- Holding the amount steady may be the point. Not cutting the dividend in a year when profit halved is, from a holder’s side, a decent outcome. I emphasized “did not raise it” and someone could reasonably emphasize “did not cut it” instead. That is an interpretive difference, not a data one, and if I turn out to be wrong this is where it happens.
What a blank consensus field hides
There is an obstacle specific to this company, and it is the one that caught me. On international screening platforms, a stock with no covering analysts does not display a warning. It displays a blank consensus field, a blank forward multiple, and a blank estimate revision history, and blank fields sort neutrally. A name that no house has written about in three months looks, on that kind of screen, exactly like a name with nothing wrong. The Campbell’s comparison above is useful mainly because it shows the opposite case: twenty analysts, a published valuation, and that valuation sitting below the market. You may disagree with those twenty, but you can see them. Here there is nothing to disagree with, and I would rather know that before I size a position than after.
One more difference worth flagging. The debt figure I quoted, 66.61 percent, follows the Korean convention of total liabilities over equity. International screeners more commonly show interest-bearing borrowings over equity, which produces a much smaller number for the same company. I did not convert between the two because I have not confirmed each provider’s formula, and I mention it so the ratio is not compared against a foreign screen without that adjustment in mind.
My position on Ottogi stock and what would change it
I do not own this and I did not place an order this time. The reason is not that the dividend is small. An amount that has not changed is not a decision, it is a postponement. Had the board raised the dividend I would learn what management thinks about the recovery in earnings. Had it cut the dividend I would learn what management is worried about. Four identical years tell me neither, and there is no broker willing to tell me either, since none has published in three months. Nothing has arrived on my screen that I could use as a reason to buy.
Two things would bring me back. The first is the 9,000 won moving at all. Direction does not matter to me here. Up or down, a change is a decision, and decisions come with reasoning attached. The second is the consolidated operating margin clearing the 2024 level of 6.27 percent, which is my own division of that year’s operating profit by that year’s revenue. The 2025 figure was 4.83 percent and the first quarter of 2026 came in at 6.22 percent. One quarter is not enough for me, so I set the bar at two in a row.
Inertia is a word I had not applied to my own process before writing this. When I see a high payout ratio I have rarely stopped to ask how it got high. A ratio lifted by a bigger dividend and a ratio lifted by smaller earnings are entirely different situations, and the screen prints both of them as 52.1 percent. There are names in my own notes that I moved past on exactly that basis. With Orion I was able to count the quarter early because that company files monthly, and here I have no such shortcut. I have to wait.
The condition under which I retract this piece is fixed to a date. Second quarter results are scheduled for August 18, 2026 (Tue). If operating profit growth outpaces revenue growth in that quarter and the American subsidiary’s loss narrows, then my description of a structurally lower profit base with an unchanged dividend sitting on top of it is wrong. In that case I will not edit this article. I will write a new one.
Prices and multiples reflect the August 7, 2026 close as I checked them at the time of writing. This piece publishes on a delay, so live quotes will differ from what is printed here. Korean won is the reference currency throughout and the dollar figures are approximate, converted at roughly 1,416 won per dollar, the Seoul closing rate on that same date as reported by Korean financial press. The 250-day high and low are intraday levels and the percentages I derived from them use the closing price. Ratio and price data come from a Korean vendor feed dated August 7, 2026; the multi-year income statement summary comes from a Korean financial data service; the Campbell’s figures are the values shown on stockanalysis.com for August 7, 2026.
Related reading
- Neowiz Stock: Three Sell-Side Cuts in Ninety Days on One Reason
- LX International Stock and the 2.79m Shares Its Dividend Reveals