Dongwon Industries Cash Flow: How Capex Tracks Operating Cash
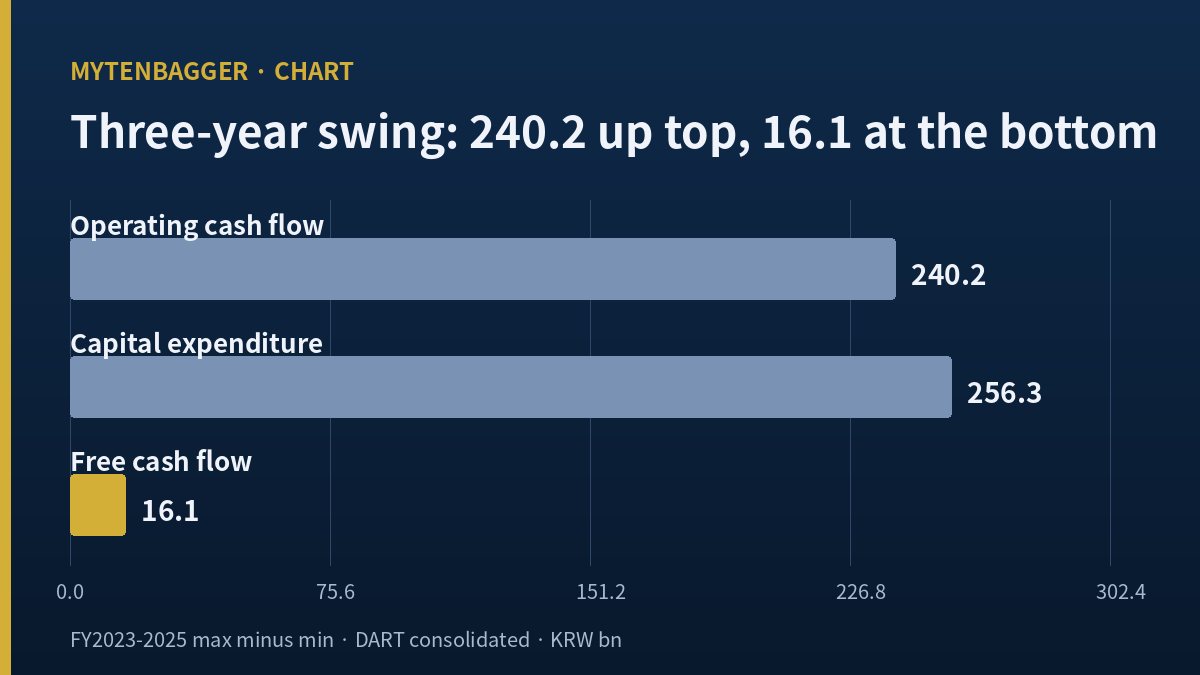
Between fiscal 2023 and fiscal 2025, the operating cash flow of Dongwon Industries moved by KRW 240.2 billion, or roughly USD 169 million. Over those same three years, the cash it had left after capital spending moved by KRW 16.1 billion, about USD 11 million.
One of those numbers is fifteen times the other. That gap is the whole reason I spent a day on this company, and it is why I am writing about Dongwon Industries stock from the cash flow statement instead of the income statement.
Three fiscal years, three ranges
Operating cash flow range: KRW 240.2bn
Capital expenditure range: KRW 256.3bn
Free cash flow range: KRW 16.1bn
The last figure is 6.71% of the first (my calculation).
Contents
What Dongwon Industries stock actually represents
Dongwon Industries trades under 006040 on the KOSPI, the senior board of the Korea Exchange and the market where most large Korean industrial and consumer names list. The junior board, KOSDAQ, is where smaller growth companies sit; this is not one of those.
The company runs deep-sea tuna fishing fleets, owns the American canned tuna brand StarKist, and consolidates a packaging affiliate along with logistics and distribution businesses. Fiscal 2025 consolidated revenue was KRW 9.584 trillion (about USD 6.76 billion), with operating profit of KRW 516.1 billion and net profit of KRW 387.1 billion, per the annual report filed with Korea’s DART system on 18 March 2026.
At the closing price of KRW 37,750 on Monday, 10 August 2026, and 44,140,397 shares outstanding, the market capitalization comes to KRW 1.666 trillion, roughly USD 1.17 billion. That produces a trailing P/E of 4.29, a price-to-book of 0.47, and a price-to-sales of 0.17 on the Kiwoom data screen refreshed that evening.
Those multiples are where most write-ups turn. I am not turning there. I wanted to know where the money goes, and the answer is in the third statement.
The mechanism behind Dongwon Industries stock: capex indexed to cash in
Here are the three fiscal years side by side, in billions of won, all from DART consolidated filings.
| Fiscal year | Operating cash | Capex | Free cash | Capex ÷ OCF |
|---|---|---|---|---|
| 2023 | 661.5 | 577.2 | 84.2 | 87.26% |
| 2024 | 421.3 | 320.9 | 100.4 | 76.17% |
| 2025 | 466.0 | 367.4 | 98.6 | 78.83% |
| Q1 2026 | 169.9 | 159.4 | 10.5 | 93.81% |
In 2023, KRW 661.5 billion came in from operations and KRW 577.2 billion went into fixed assets, leaving KRW 84.2 billion. In 2024, cash in fell by more than KRW 240 billion, and capex fell by more than KRW 256 billion. What was left actually rose, to KRW 100.4 billion. In 2025, KRW 466.0 billion came in, KRW 367.4 billion went out, and KRW 98.6 billion stayed.
The three capex-to-operating-cash ratios come out at 87.26%, 76.17% and 78.83%. They sit inside eleven percentage points of each other. Somewhere between three quarters and four fifths of everything this business generates goes straight back into vessels and plant. That is why the top line of the cash flow statement can swing by a quarter of a trillion won and the bottom line barely notices.
The sentence I built from this: free cash flow at this company is not an output of operating performance. It is the residue of a spending decision. So when I look at this company, the question that comes first is not how much it earned but how much it chose to put back.
The first quarter of 2026 is the clearest single example
Three annual observations could be coincidence, so I pulled the most recent quarter out on its own. Comparing Q1 2026 with Q1 2025, from the quarterly report filed 15 May 2026:
- Revenue KRW 2,319.3bn to KRW 2,530.0bn, up 9.08% (my calculation)
- Operating profit KRW 124.8bn to KRW 146.2bn, up 17.07% (my calculation)
- Operating cash flow KRW 139.6bn to KRW 169.9bn, up 21.72% (my calculation)
- Capex KRW 69.4bn to KRW 159.4bn, up 129.51% (my calculation)
- Free cash flow KRW 70.1bn to KRW 10.5bn, down 85.01% (my calculation)
Revenue up, operating profit up, operating cash up. Three lines all pointing the same way. Then capex more than doubles and the fifth line loses 85% of itself. Ninety-four won of every hundred that came in went back out. I have written before about a Korean operator whose two profit figures pointed opposite ways in a single quarter; the difference is that there the split happened between two lines of one statement, while here it happens between two statements, and across four reporting periods, not one.
Heungkuk Securities analyst Park Jong-ryul recorded that quarter as “revenue of KRW 2.53 trillion, operating profit of KRW 146.2 billion” in a 12 May 2026 note, as relayed by the Korean financial outlet Edaily MarketIn. Those figures match the DART filing exactly, which is a useful confirmation that two independent sources are reading the same numbers. His headline framing was that earnings held up. I was reading a different line in the same filing.
Two screen metrics I had to date before using them
Vendor data screens carry ratios with no period label attached. Copy one across and a reader will assume it is annual. So before writing anything down I tried candidate values above and below the line until a figure reproduced.
Interest coverage of 5.67 is a single quarter
Computed on fiscal 2025 as a whole, operating profit of KRW 516.1bn over interest expense of KRW 119.0bn gives 4.337, which does not match. Computed on Q1 2026, KRW 146.2bn over KRW 25.8bn gives 5.674, matching to three decimal places. Q1 2025 alone would have given 3.512. The same named metric ranges from 3.5 to 5.7 depending on the window, so I dated it and then left it out of my argument.
A free cash flow yield of 0.63% is also one quarter
Q1 free cash flow of KRW 10.5bn over the KRW 1,666.3bn market capitalization gives 0.6307%, which closes. Recomputed on the three-year average free cash flow of KRW 94.4bn, the same yield becomes 5.67%. That happens to be the identical figure as the interest coverage above, and the two have nothing to do with each other. I am flagging the coincidence so I do not confuse myself later.
Why Dongwon Industries stock keeps needing the money
Fleets catch fish, and the price of that fish is set somewhere other than the boardroom. Heungkuk’s May note pointed to “continued weakness in fishing grounds and intensified volatility in fish prices” and judged that momentum would slow through the second and third quarters. Hana Securities analyst Shim Eun-joo, writing on 13 February 2026, traced the weak fourth quarter to lower catch volumes despite firm prices, and noted that StarKist saw margin pressure from delayed price pass-through, with a January increase of roughly 10% on pouch products.
An input that the company does not control, sitting upstream of everything else, is a structure I ran into when I looked at a Korean confectioner whose margin was waiting on a commodity price that had not reached it yet. The difference here is direction. There, the outside price had not yet shown up in the numbers. Here, the outside price swings freely and the bottom line still refuses to move, because something in between is absorbing it.
Dongwon Industries stock, shareholder returns and a promise
When little is left, little goes out. In November 2024 the company filed a corporate value-up plan committing to raise the dividend payout ratio in steps from 20% to 25% to 30%, to deliver a 40% total shareholder return, to widen the free float, and to pay dividends twice a year. The Korean technology and industry outlet Bloter reported on 10 August 2026 that the fiscal 2025 payout ratio came in at 13.8% on a consolidated basis, below the 17.6% of 2023.
The same report contrasted two rounds of buyback cancellations in August 2023 and May 2024 totaling 13.96 million shares, or 27.9% of the count, with a May 2026 cancellation of only 7,167 shares. A separate Korean filing summary, from Digital Today, put that same cancellation at 7,137 shares. Thirty shares apart, and I could not resolve which figure is final from the original filing; at that size it changes nothing, but I would rather record the discrepancy than smooth it over. The company cited the need to reserve capital for food-sector acquisitions. Bloter noted that no specific acquisition candidate or size had been disclosed in more than six months.
The declared dividend for fiscal 2025 was KRW 1,150 per share, up from KRW 1,100 in each of the three prior years, a yield of 3.05% at the 10 August close. This is not a company that pays nothing. But the distance between a stated 30% and a delivered 13.8% points the same direction as the table above.
Dongwon Industries stock next to a multi-trillion-won deal
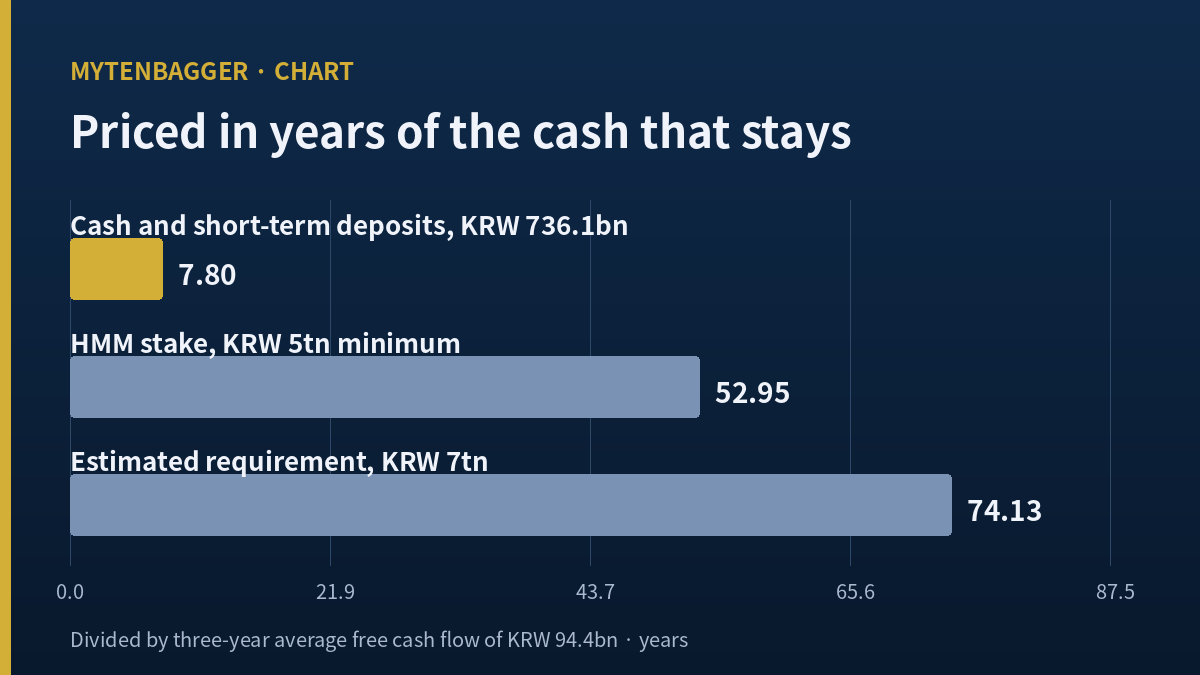
For the past year this name has appeared in shipping coverage more often than in seafood coverage. The Korean outlet TheValueNews reported on 23 January 2026 that the group had formed a task force to pursue HMM, the Korean container line, and that acquiring the state development bank’s 35.42% stake alone would require “more than approximately KRW 7 trillion.” The same article said the company was weighing a transfer of its roughly KRW 2 trillion StarKist stake to an affiliate to raise funds, and put its cash and short-term deposits at KRW 736.1 billion.
Hana Securities wrote in February that with HMM valued around KRW 10 trillion, “a minimum of KRW 5 trillion” would be needed, and that expanding borrowings would raise doubts about delivering the promised 30% payout.
What I did with those figures was arithmetic, not analysis.
Against three-year average free cash flow of KRW 94.4bn (my calculation):
KRW 5 trillion equals 52.95 years of it
KRW 7 trillion equals 74.13 years of it
Cash and short-term deposits of KRW 736.1bn equal 7.80 years of it
Nobody funds an acquisition out of free cash flow. It comes from debt, asset sales and affiliate restructuring. The arithmetic above is not a financing plan; it is a way of making visible how much cash this business manufactures on its own, and how far that quantity sits from the numbers in the headlines. Heungkuk cut its published figure in May, taking KRW 19,000 off a KRW 67,000 valuation to reach KRW 48,000, citing exactly this concern. I quote these published figures as market facts and do not adopt them as my own.
A company of the same size, and what its bottom line does
A KRW 16.1 billion range means nothing in isolation. I needed to know how wide that line normally runs in this industry, so I went looking for a business of comparable scale. Umios Corporation, the Japanese seafood group formerly known as Maruha Nichiro, trades in Tokyo under 1333 and stacks deep-sea fishing, aquaculture, processing and logistics in the same order.
On the figures stockanalysis.com displayed as of 8 July 2026, Umios had trailing revenue of JPY 1.11 trillion. Converted at the 10 August 2026 cross rate of KRW 895.31 per 100 yen, that is roughly KRW 9.94 trillion, within 3.7% of Dongwon’s fiscal 2025 revenue of KRW 9.584 trillion. Two companies of effectively the same size.
| Fiscal year | Operating cash | Capex | Free cash |
|---|---|---|---|
| FY2023 | -24 | 20,359 | -20,383 |
| FY2024 | 53,604 | 16,666 | 36,938 |
| FY2025 | 39,179 | 19,003 | 20,176 |
| FY2026 | 24,804 | 25,342 | -538 |
Millions of yen, on the fiscal-year labels stockanalysis.com uses. The free cash line travels from negative JPY 20.4 billion to positive JPY 36.9 billion, a span of JPY 57.3 billion, which at the same cross rate is somewhere above KRW 500 billion. Same industry, same revenue scale, and one bottom line moves by half a trillion won while the other stays inside sixteen billion.
The comparison has real limits. Four fiscal years against three, different fiscal calendars, and a single-day cross rate applied once. So what I take from the table is not a multiple but a shape. In this business, this line is supposed to move. Dongwon’s does not.
Dongwon Industries stock against its sector and the index
Before deciding whether the cash flow story is being ignored or simply priced, I wanted to know whether this stock has been falling on its own or drifting down with everything around it. Running the trailing year, 11 August 2025 through 10 August 2026, across 243 trading sessions on the vendor’s daily candle data with an equal-weighted sector index that excludes the stock itself:
- Dongwon Industries: -19.60%
- KOSPI: +96.45%
- Food sector, 77 constituents: -10.83%
Against the index that is a shortfall of 116.04 percentage points, which the vendor’s own bands class as a rout. Against the sector it is a shortfall of 8.76 points, which is close to a draw. Decomposed, the sector accounts for 92.4% of the total gap and the stock’s own behavior for the remaining 7.6%. Within the sector it ranks 50th of 77, against a median of -12.54%, beating 27 names. Weighting the same sector by market capitalization instead flips the reading to a 14.49-point shortfall, because the largest food names held up better than the average one; I am quoting the equal-weighted figure as the primary one precisely because a cap-weighted index in a concentrated sector partly measures its own biggest members.
So the answer is that this has mostly been a sector event, not a company event. Beta against the index is 0.245 with a correlation of 0.325, which is another way of saying that whatever moved the KOSPI to a near-doubling over the year did not reach here at all. From a closing peak of KRW 50,000 on Monday, 27 October 2025, the shares fell to KRW 30,050 by Tuesday, 23 June 2026, and have recovered to KRW 37,750, leaving them 24.5% below that peak with a maximum drawdown of 39.9% along the way.
I take two things from this. First, the low multiple is not a puzzle that needs the cash flow statement to explain it; a sector that lost ground while the index nearly doubled explains most of it without my help. Second, and more usefully, the cash flow observation is therefore not the reason this stock is cheap. It is something else, sitting underneath the reason, that will still be there after the sector question resolves. Foreign ownership of 4.39% is low enough that not many people are watching it either way.
Where this breaks: six conditions
- Three observations is a thin sample. Fiscal 2022 has no operating cash flow figure in the DART dataset I pulled, so I could not add a fourth year. Calling three numbers a structure is the weakest move in this piece. A fourth value could blow the range well past KRW 16.1 billion.
- Capex is a project schedule, not a stated policy. I could not find any company document committing to manage this ratio. The three values may simply reflect how the investment calendar happened to fall.
- Q1 2026 already reads 93.81%. That is outside the three prior years. Whether it marks a new level or ordinary quarterly seasonality cannot be settled with one observation.
- Fish prices and catch volumes cut the other way. Heungkuk expects softer momentum through the middle quarters and Hana put the weak fourth quarter down to a smaller catch. If cash in falls far enough, what is left has to follow eventually.
- A completed acquisition voids the table. If HMM proceeds, the consolidation scope and the debt structure both change, and these three lines become a different company’s numbers.
- The share count moved twice in the past six months. A February 2026 filing set the cancellation of treasury shares with a 4 May record date and 20 May relisting, taking the count from 44,147,986 to 44,140,849. Before that came a bonus issue and a comprehensive share exchange. The cancellation is about 0.02% of the total and changes no multiple, but the exchange-issued shares are a different matter. I could not confirm whether Hana’s February EPS estimate of KRW 7,518 was calculated on the pre-change or post-change count, so I kept that estimate out of every calculation in this article.
A shipping headline is how this company first entered my reading, and that is the part I got wrong for a while. I filed it mentally as a deal story and skipped the filings for months. The thing that turned out to be interesting was not the deal at all; it was a line in a statement nobody was quoting.
Dongwon Industries stock: three open questions
A trailing P/E of 4.29 looks inexpensive. Why is that not the story?
Divide the KRW 1,666.3 billion market capitalization by three-year average free cash flow of KRW 94.4 billion and the multiple is 17.65. Counted on earnings it is 4.29; counted on cash it is 17.65. Deciding which is correct is not this article’s job. Recording that the two are four times apart is.
Is heavy capital spending a bad thing?
No. A business running fleets and processing plants that stops spending ends up with aging assets. What I wrote down is an observation, not a verdict: at this company, free cash flow is set almost independently of how operations performed. Anyone reading the earnings headline and inferring what was left over will be off.
What did I leave out, and when does this need updating?
Six values are absent on purpose. The screen’s total equity of KRW 4,207.4 billion reconciles neither with the DART Q1 2026 figure of KRW 3,853.2 billion, nor with book value per share times share count at KRW 3,527.7 billion, nor with the screen’s own 107.13% debt ratio, so I dropped it entirely. The screen’s EBITDA is numerically identical to Q1 operating profit, which would require zero depreciation, so that went too. Three-year revenue CAGR, both vendor payout-ratio paths, and a return-on-equity decomposition are all out for reasons of provenance or repetition. The update date is Friday, 14 August 2026, when the semi-annual report refreshes all three cash flow lines at once. Whether the first quarter’s 93.81% persists into the half-year cumulative is the verdict on everything above. A ratio, not a price, is what will move me.
Prices and multiples reflect the close of Monday, 10 August 2026, at KRW 37,750, as I checked them at the time of writing; this piece may publish several days later, so live quotes will differ. Financial figures come from consolidated DART filings dated 18 March 2026 and 15 May 2026 and from a Kiwoom data screen refreshed on 10 August 2026. Ratios and growth rates not present in the source documents are labeled as my calculation. The Korean won is the unit of record throughout; dollar figures are approximate, converted once at KRW 1,418.4 per dollar, the Seoul market close on 10 August 2026. Yen figures convert at KRW 895.31 per 100 yen on the same date.
Sources consulted: DART electronic disclosure system · Edaily MarketIn on the Heungkuk Securities note · Bloter on value-up plan delivery · TheValueNews on the HMM process · Digital Today on the treasury share cancellation · stockanalysis.com on Umios (TYO:1333) · Financial News on the 10 August currency close
- TheBorn Korea Capex Rose 3.4 Times as Revenue Fell in 2025
- Asia Cement Valuation: Why Low P/E and P/B Point to One Number
- SNT Motiv Capex and Free Cash Flow: Spending Above Every Peer