LG CNS Stock Performance: Behind the KOSPI, Ahead of Its Sector
June 1, 2026: ₩143,700. November 7, 2025: ₩55,400.
Those are two closing prices for LG CNS stock (KRX: 064400), 244 trading sessions apart, and I could not decide what the span between them told me until I stopped looking at the price and started looking at what I was measuring it against. When I did that, I got three answers to the same question, and the tool that gave me all three also told me which one to keep.
Contents
Three verdicts on one year of LG CNS stock
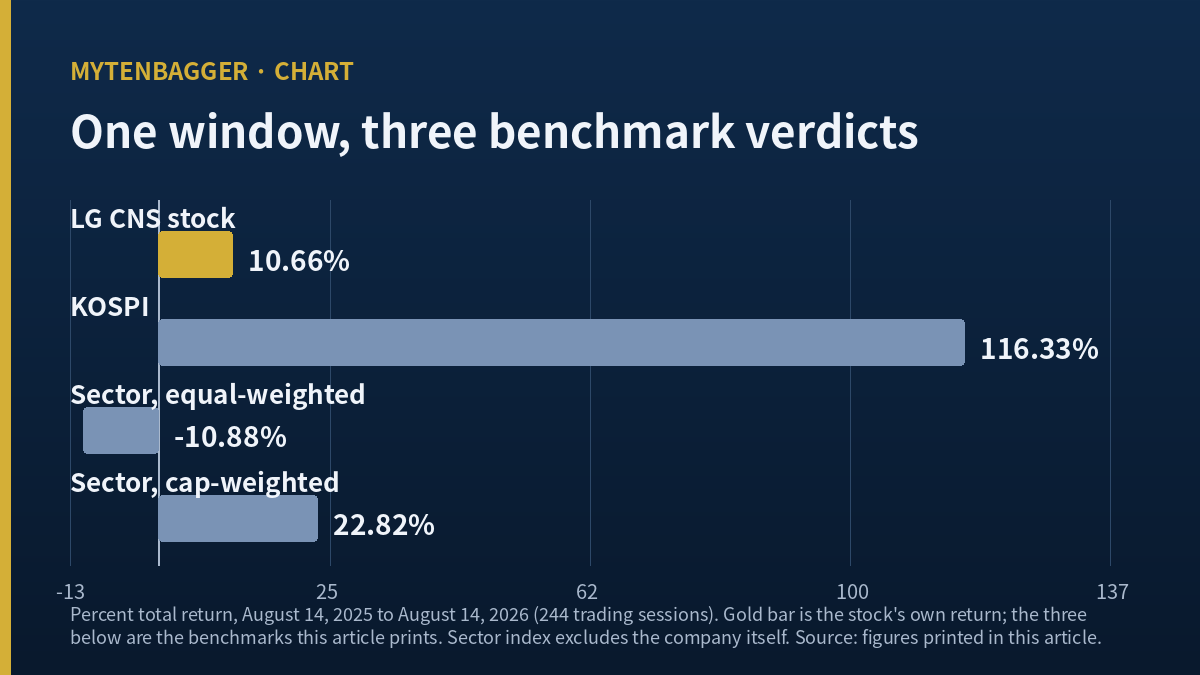
Window: August 14, 2025 to August 14, 2026 · 244 trading sessions · stock +10.66%
Measured against the KOSPI (+116.33%) → behind by 105.66 points
Measured against the IT services sector, equal-weighted, self excluded (−10.88%) → ahead by 21.55 points
Measured against the same sector, capitalization-weighted (+22.82%) → behind by 12.15 points
Anchor I kept: rank 18 of 102 in the sector, top 17.6%, sector median −24.14%, 84 constituents beaten.
Two of those three lines disagree about whether this company had a good year inside its own industry, and the only thing separating them is how the index behind them is weighted. I do not think one of them is a lie. I think a one-line verdict was the wrong thing to ask for.
What follows is the record of how I graded a year, what I threw away, and what would make me redo it.
What the KOSPI did while LG CNS stock rose 10.66 percent
For readers who do not follow Korea daily: the KOSPI is the main board of the Korea Exchange, the larger of the country’s two listed markets, and the KOSDAQ is the smaller growth board. LG CNS trades on the KOSPI. The index had a year that makes any single-stock return look strange.
- June 22, 2026 (Monday): record close of 9,114.55 (Segye Ilbo).
- July 2026: the index fell from 8,476.48 to 6,595.45, a decline of 22.19% in one month (Kiho Ilbo). Korean coverage at the end of July put the month-to-date drop near 29% before a rebound narrowed it (Asia Economy).
- Circuit breakers were triggered four times during the month, and international coverage described the drop as the steepest since the global financial crisis (Fortune, The Korea Herald).
- August 14, 2026 (Friday): close of 6,977.94, a fifth straight advance, with foreign investors net buying ₩3.038 trillion (Business Korea).
So the +116.33% the index posted across my window is real, and it is also why the first of my three verdicts reads the way it does. Being 105.66 points behind an index that nearly doubled is a different statement from being 105.66 points behind an index that went sideways. I say that plainly because a reader who takes the first line out of the box above and nothing else will get the wrong picture.
The sector, on the other hand, went backwards
Across the same 244 sessions, the Korean IT services sector index (equal-weighted, with this company removed so it is not being compared to itself) returned −10.88%. The median constituent returned −24.14%. Against that, +10.66% is a top-quintile outcome, and the tool ranks it 18th of 102 names that traded the full window.
Then I asked the same tool the same question with capitalization weighting, and the sector index returned +22.82%. The verdict word attached to the comparison flipped from a win to a loss. Neither run changed the company’s own +10.66%; only the thing behind it moved.
The sector verdict flips when I change one setting
This is where I stopped and read the method block instead of the output. The tool states, in its own notes, that the percentile ranking is independent of the weighting method and should be used as the anchor when the verdicts disagree. That instruction is why the bottom line of my box is a rank and not a word.
I also checked the condition that would have made the equal-weighted run itself unreliable. The largest constituent of this sector carries 29.24% of its capitalization, and that largest constituent is not this company. So the self-comparison problem, where a heavyweight ends up being graded against an index it dominates, does not apply here. Had it applied, I would have had to throw out the 21.55-point line entirely.
What survives all three runs is the rank. Eighteenth of 102, ahead of 84 names, in an industry whose median member lost roughly a quarter of its value. I will use that. I will not use the word “outperformed,” because in one of the three runs it is false.
I have run into the reverse of this before, in a piece where a company earned money in every quarter its cash did not. There the two measurements were profit and cash, and they produced different orderings of the same years. Here the two measurements are the same return graded against two versions of the same index. Different mechanism, same lesson: the ordering is a property of the ruler as much as of the thing measured.
LG CNS stock held a 2.59x closing range in the same window
A +10.66% year sounds quiet. The path was not.
Highest close ₩143,700 (US$101.30) on June 1, 2026 (Monday)
Lowest close ₩55,400 (US$39.05) on November 7, 2025
Ratio of the two: 2.5939x (my calculation)
Post-peak low ₩58,200 (US$41.03) on July 30, 2026 (Thursday), 59.499% below the peak
August 14, 2026 (Friday) close ₩79,900 (US$56.32), 44.398% below the peak, 37.285% above the post-peak low
The June 1 close came out of a rally in Korean AI-linked names around reporting that the chief executive of Nvidia was visiting Korea and would meet the LG group chairman. On May 29, 2026 (Friday) this company and LG Electronics both hit their daily limit, and on June 1 Korean coverage put the intraday move above 22% (Herald Business). The July 30 low is not a company event. It sits inside the index collapse described above, and I found no company-specific bad news in that stretch.
The low close of ₩55,400 predates the peak, so it plays no part in the drawdown arithmetic, because the tool searches for a trough only after the peak. That is why ₩58,200 is the number in the box. I am printing both because the 2.5939x range is the honest description of what a holder lived through, and the −59.499% is the honest description of the drawdown.
A field note said “closing price” and handed me intraday
My indicator screen reports a 250-session high of ₩153,300 and a low of ₩54,100, with a drawdown of −47.9%. The basis field on that screen reads adjusted_close_250d, and the accompanying note describes it as the split-adjusted closing-price series, newly designated as the authoritative one.
I pulled 260 raw daily bars anyway, because a check in my own procedure says to, and the note turned out to describe something the numbers were not doing. The highest close in the window is ₩143,700, on June 1. The ₩153,300 appears only as an intraday high on June 2, 2026 (Tuesday), a session that opened at ₩144,500, ranged down to ₩121,000, and closed at ₩135,700. The ₩54,100 is likewise an intraday low on November 7, 2025, a day whose close was ₩55,400.
- Drawdown measured on closes: −44.398%
- Drawdown measured on intraday highs: −47.880%
- Gap between them: 3.48 points (my calculation)
I kept the close-based figure. The benchmark tool states in its method block that it uses closing prices and no intraday extremes, and the peak date it returned matches the date I found in the raw bars. That agreement is what let me choose. Without it I would have had two candidate drawdowns and no way to pick, and I would have printed a range.
LG CNS stock’s operating profit moved less than its price did
Against a closing range of 2.5939x, here is what the audited income statement did over the same stretch and a bit more. All figures are consolidated, from the Korean regulatory filing system, in Korean won with a US dollar conversion for scale.
| Fiscal year (ends December) | Revenue | Operating profit | Operating margin |
|---|---|---|---|
| 2023 | ₩5,605.3bn | ₩464.05bn | 8.28% |
| 2024 | ₩5,982.6bn | ₩512.86bn | 8.57% |
| 2025 | ₩6,129.5bn (US$4.321bn) | ₩551.83bn (US$389.0m) | 9.003% |
Operating profit rose 10.520% in 2024 and 7.597% in 2025, for 18.916% across the two years (my calculations). The price range in one of those years was 159 percent wide. I am not claiming that is wrong; equity prices move on expectations and this one moved on an AI narrative. I am pointing at the size of the mismatch, because it is the reason I graded the year three ways instead of one.
The 8.4 percent widely reported for 2025 is the preliminary figure
In January 2026 the company announced full-year 2025 revenue of ₩6,129.5bn and operating profit of ₩555.8bn, up 2.5% and 8.4% (Digital Today, Datanet). The annual report filed on March 16, 2026 (Monday) carries consolidated operating profit of ₩551.83bn.
- Revenue agrees between the two documents.
- Operating profit differs by ₩3.97bn, or 0.7146%.
- As a growth rate: preliminary +8.372%, audited +7.597%. A gap of 0.77 points (my calculations).
Preliminary figures get trued up in audit and I do not treat that as a fault. I am flagging it because the widely circulated 8.4% is the one a reader is likely to meet first, and every 2025 number in this article is the audited one. This is a different problem from the one I wrote about when two houses put a company’s 2026 earnings 2.3 times apart. That was two forward views disagreeing, where I had to choose. This is one closed year written down twice, where the audited copy simply wins.
LG CNS stock and the first half that grew 1.089 percent
On July 31, 2026 (Friday) the company published preliminary second-quarter figures: revenue ₩1,520.83bn (US$1.072bn) and operating profit ₩127.88bn (US$90.1m), the latter down 9.169% from the same quarter a year earlier while revenue rose 4.155%. Korean coverage of the earnings call quoted the chief financial officer tracing the decline to expanded investment in future growth areas and to some affiliate project contracts sliding into the second half, describing it as temporary and not structural (EBN).
Adding that to the audited first quarter gives a first half of ₩222.08bn (US$156.5m) in operating profit, up 1.089% year on year, on revenue up 6.149%. Both of my sums fall inside the rounding the company itself published, which is the check I run before using my own quarterly series for anything.
Four named Korean brokerages carry a full-year 2026 operating profit estimate. Converted to a common unit, they run from ₩582.0bn to ₩645.0bn. Take the first half out of each and what is left for the remaining six months runs from ₩359.92bn (US$253.7m) to ₩422.92bn (US$298.1m), against ₩332.14bn (US$234.1m) actually delivered in the second half of 2025. That is a required increase of 8.36% at the low end and 27.33% at the high end, for a business whose first half grew 1.089%.
Every one of those four estimates was published before July 31, 2026. The latest is dated June 25, 2026 (Thursday). None of them had seen the quarter that fell 9.169%. I develop that arithmetic at length in the Korean-language edition of this piece; here I keep it as one line of context for the price, because a US reader looking at this ticker is looking at a company whose forward numbers on most screens predate its most recent quarter.
One named note postdates the print. LS Securities analyst Sun Yu-jin maintained a buy on August 3, 2026 (Monday) and put the shares at ₩96,000 (US$67.67), up from ₩91,000, reading the margin softness as a matter of when revenue is recognized (Edaily). I could not obtain that note’s estimate table, so I left it out of the range above. The Korean consensus screen, dated August 14, 2026 and drawn from 11 contributing houses, shows a mean of ₩97,727 (US$68.89), with a stated rolling three-month collection window (Naver Finance, WISEreport). A rolling window straddles the July 31 print, so I did not use the mean in any calculation.
Where half of the listing money went
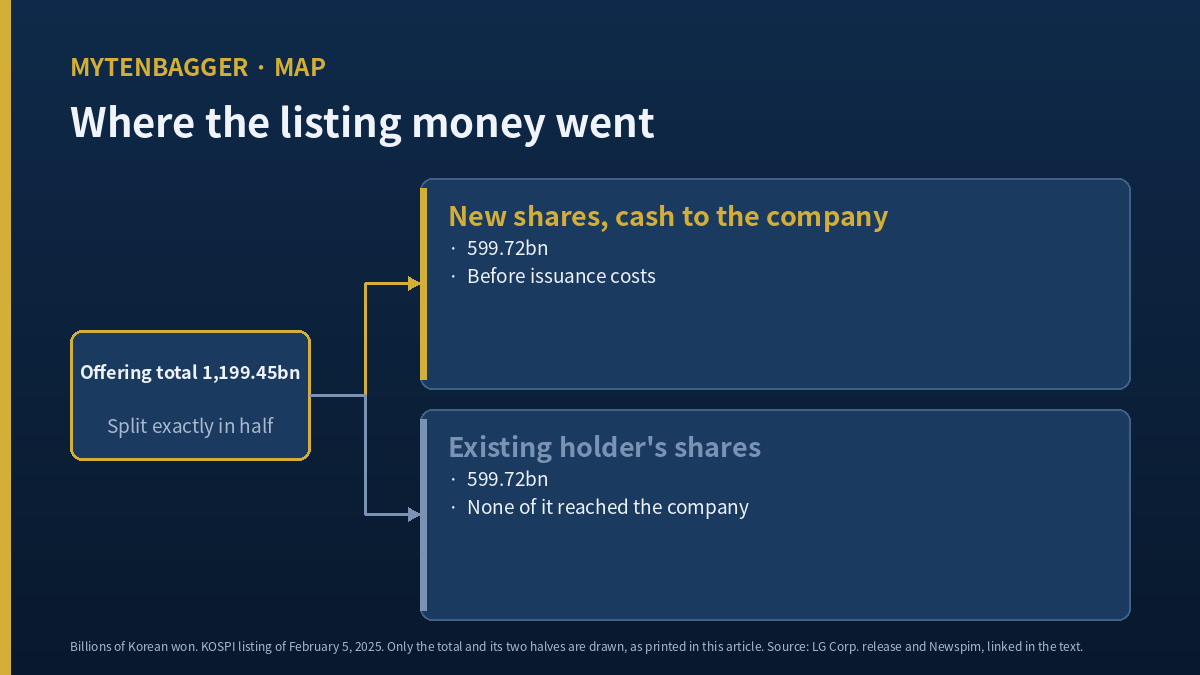
This company listed on the KOSPI on February 5, 2025. The offering was 19,377,190 shares at ₩61,900, for a headline size of ₩1,199.45bn (US$845.5m). The structure matters more than the headline: the offering was split exactly in half, 9,688,595 newly issued shares and 9,688,595 shares sold by an existing holder, a Macquarie-affiliated vehicle (LG Corp. release, Newspim).
- Cash reaching the company: ₩599.72bn (US$422.8m), before issuance costs (my calculation).
- Cash reaching the selling holder: the identical ₩599.72bn. None of it went to the company.
- Share count: 87,197,353 to 96,885,948, an increase of 11.111% (my calculation).
- First-day close ₩55,800, which is 9.855% below the offer price (my calculation).
Consolidated equity rose from ₩2,122.81bn at the end of 2024 to ₩2,941.44bn at the end of 2025, an increase of ₩818.63bn against net income of ₩439.16bn. Rebuilding that from published items (opening equity, primary proceeds, net income, the 2024 final dividend of ₩145.79bn at ₩1,672 per share on the pre-listing count, and the ₩72.7bn interim dividend paid in 2025) arrives at ₩2,943.20bn, which is 0.0598% away from the filed figure. So 73.26% of the equity increase traces to the primary issue. I did not open the statement of changes in equity, so the residual ₩1.76bn stays unexplained.
The scale of dilution here is modest next to a case I wrote about earlier, where a Korean cable maker took in ₩952.5bn from shareholders against ₩250.9bn of cumulative net profit. There the money shareholders paid in dwarfed what the business generated. Here the primary raise is roughly 1.4 times one year of net income, and the company has been profitable throughout. I am naming the comparison to mark how far apart the two cases sit.
The Macquarie vehicle cleared its remaining 8.3% (8.02 million shares) in a block at ₩66,800 on January 27, 2026 (Tuesday), ending its position (Invest Chosun). LG Corp. is the controlling shareholder. Treasury stock stood at zero at the end of 2025, and the chief executive said at the March 2026 annual meeting that there was no buyback or cancellation plan yet (FN Times). I found no bonus issue, split, rights offering, capital reduction or convertible security, and the vendor’s split-detection flag is off.
Two peers, chosen to split an industry number from a country number
A 9.003% operating margin means nothing on its own. What I wanted to know was whether that figure is what this industry produces or what this country produces, so I picked one peer that shares the industry and the country and one that shares the industry and not the country. Both close their books in December, as this company does.
| LG CNS | Samsung SDS (KRX: 018260) | Cognizant (NASDAQ: CTSH) | |
|---|---|---|---|
| Market value | US$5.457bn | US$13.274bn | US$26.48bn |
| Latest full-year operating margin | 9.003% | 6.871% | 15.8% |
| Dividend yield | 2.3154% | 1.35% | 2.25% |
Prices as of the August 14, 2026 close in each home market: LG CNS ₩79,900 at 15:30 KST, Samsung SDS ₩243,500 at 15:30 KST, Cognizant US$58.79 at 16:00 EDT. Samsung SDS fiscal 2025 revenue ₩13,929.9bn and operating profit ₩957.1bn come from the company’s own results release, and the 6.871% is my division; its 1.35% yield comes from an aggregator. Cognizant’s margin and yield come from an aggregator; I did not open the 10-K.
The split works. Against the other large Korean system integrator, 9.003% is 1.310 times the peer figure. Against a US-listed operator in the same business, it is 56.98% of the peer figure (my calculations). So the answer is that 9.003% is a good Korean number and a thin global one, and both of those statements are true at once. That is a more useful thing to carry than a single adjective.
I stopped at three rows on purpose. I had Accenture (NYSE: ACN) in hand at a 14.7% GAAP operating margin on fiscal 2025, but Accenture closes its year on August 31, so its “latest full year” covers a different twelve months from everyone else in the table, and I do not put periods that do not line up into the same grid. I also had Infosys, and dropped it: the aggregator I was reading listed identical operating profit for two consecutive fiscal years, which reads like an extraction fault, and I was not going to print a peer figure I could not trust to the source.
Numbers on the LG CNS stock screen I did not use
A total equity figure that disagrees with two of its own derivatives
The indicator screen shows total equity of ₩1,994.0bn. The same response’s debt ratio of 63.13% reverses to ₩1,851.44bn over ₩2,932.56bn, which is the filed first-quarter 2026 consolidated equity. Book value per share of ₩30,270 times 96,886,108 shares comes to ₩2,932.74bn against the filed ₩2,932.56bn, a gap of ₩0.18bn or 0.006%. Two derived fields point at one source and the total field sits ₩938.56bn, or 32.00%, away from it (my calculations). I used the 2.64 price-to-book and the debt ratio and discarded the total.
An earnings per share figure derived from the price
The screen’s precise earnings per share of ₩4,550.11 carries a basis note saying it was computed as price divided by the price-to-earnings multiple. ₩79,900 divided by 17.56 reproduces it exactly. Setting that beside the multiple would be saying one thing twice, so I used it only where it sits under a division I could sanity-check: ₩1,850 of dividends over ₩4,550.11 gives 40.66%, close to the 40.9% payout in the company’s governance report, which itself reconciles as ₩179.27bn of total dividends over ₩439.16bn of net income, or 40.821% (my calculations).
A daily series that mixes two market scopes
Of the 260 daily bars I pulled, 37 are tagged as regular-session exchange data and 223 carry no market tag at all, being older loads. The tool’s own note warns that unified and regular-session-only scopes differ in both close and volume, and that return and volume comparisons across a mixed series are unsafe. So this article contains no volume comparison of any kind. I kept the price extremes because the benchmark tool returned matching dates from its own separate series.
A cash-flow yield, an EBITDA line, and a coverage ratio
The screen’s free cash flow yield of 5.25% reverses to ₩406.33bn over the ₩7,741.2bn market value, which is one quarter’s free cash flow measured against a full market value. Using the 2025 full-year figure instead gives 4.828% (my calculations). Neither is wrong; they are different quantities and the screen does not say which one it is showing. The EBITDA field reads 94,196 in millions of won, identical to first-quarter 2026 operating profit down to the unit, so no depreciation has been added and I dropped it. Interest coverage of 7.69 reverses to ₩94.20bn over ₩12.25bn, again a single quarter; the 2025 full-year version is 16.4523x. Interest is not this company’s problem and neither figure carries any argument here.
One thing I checked that came out clean
Market value reverses to the share count exactly: ₩79,900 times 96,886,108 gives ₩7,741,200,029,200, or ₩7,741.2bn to the won. That told me the vendor’s price and share count are on the same date, which is the check that stops me from mixing a stale count into a fresh price.
Twenty-four lines that argue against how I graded this
Already on the public record (1 to 7)
- The company called the second-quarter margin decline temporary and tied it to contracts sliding into the second half. If they arrive, the back half fills on its own.
- First-half revenue grew 6.149%. Only operating profit stalled.
- Second-quarter net income was ₩118.7bn, up 19.9% year on year. I did not establish what below the operating line drove that.
- The company said it won more than ₩1 trillion of large deals in the first half, which can land as revenue later.
- A ₩189.75bn infrastructure supply contract with LG Electronics was disclosed on July 7, 2026 (Tuesday), with the contract term starting August 1, 2026. Part of the second half is already contracted.
- Korean coverage reported wins with Korea Airports Corporation on August 5, 2026 (Wednesday) and with the Dong-A Socio group on August 12, 2026 (Wednesday). Neither disclosed a value.
- The sector percentile I anchored on is itself a survivor statistic. Delisted names are not in the 102.
Reached only by my own arithmetic (8 to 12)
- The second-quarter figures are the company’s preliminary release. I did not open the semi-annual report, and the entire first-half sum rests on them.
- The unit conversion from billions to a common scale passed through my hands on every brokerage estimate.
- The second half of 2025 was assembled from cumulative filings split into single quarters, with the fourth quarter derived as the year minus the nine-month cumulative. The regulator does not publish it separately.
- The equity rebuild uses five published items and no statement of changes in equity.
- The listing totals are share count times offer price, so issuance costs are not deducted.
Tool output I declined to trust (13 to 18)
- The 250-session extremes are intraday while their basis note says closing. Following the note would have shipped a drawdown 3.48 points off.
- The total equity field is 32.00% away from the filing while two derived fields in the same response are not.
- The sector verdict inverts with the weighting. I chose the percentile as anchor, but choosing the anchor was still my choice.
- The daily series mixes two market scopes.
- The share count differs between sources: 96,886,108 on the vendor screen against 96,885,948 announced at listing, a gap of 160 shares I could not explain. Market value reverses cleanly only to the former.
- The three-year revenue growth field is empty, so I have no vendor-side multi-year growth line at all.
Not established (19 to 24)
- I did not pull the full list of regulatory filings for the last 90 days. I came to the events through coverage and broker notes.
- I confirmed the semi-annual report was filed on August 14, 2026 (Friday) but did not read it.
- Whether a 2026 interim dividend has been declared is unresolved. A ₩750 per share interim dividend was declared in early August 2025; for 2026 the July 31 call went only as far as saying it was under consideration.
- Of the four brokerages carrying full-year estimates, three disclosed an applied multiple and one did not. Of those three, two reconcile arithmetically and one does not: 19.5 times the earnings per share printed in the same note falls short of the price that note put on the shares, and I could not determine which year’s figure was used.
- I found no neutral or sell rating from any named house in the range I searched. Every line above is therefore mine and none of it came from a counterparty.
- Whether the ₩599.72bn raised at listing is still inside the company is something I did not check. That needs the cash flow statement notes, which I did not open.
A field note I only checked because a list told me to
Item 13 above nearly did not happen. The basis note on that screen is unusually specific: it names the series, calls it split-adjusted, dates its introduction, and says it supersedes an older intraday version. It reads like a note written by someone who had just fixed exactly this problem. I pulled the raw bars anyway, because pulling raw bars is a line in my own procedure and not a call I make fresh each time. The note was wrong and the procedure caught it. I want to record that the catch came from the list and not from me noticing anything, since I would otherwise remember this as a moment of care.
Where I stand on LG CNS stock and what would retire this
My position is that a year producing three different verdicts is a year I grade by rank and then set down. Eighteenth of 102 in an industry whose median member lost 24.14% is a real result. It is also not enough on its own to change my read on something that fell 59.499% from peak to trough inside the same twelve months while its operating profit was moving by single digits.
The condition that would retire this reasoning: if the sector verdict stops inverting, meaning a full year measured both equal-weighted and capitalization-weighted puts this name on the same side of its industry, then my whole objection collapses, because the three-verdict problem was the reason I refused to summarize. I will re-run the same 244-session comparison after the 2026 close, both weightings, and if they agree I will have to grade this the ordinary way and say something.
One more thing, and it is the point of writing this at all. I have not used the words cheap or expensive anywhere above, and that was deliberate. Both of them require a single verdict, and I spent this article establishing that I could not produce one honestly.
Q1. Which of the three verdicts is the right one?
All three are correctly computed and none is the answer. The percentile, 18th of 102 and top 17.6%, is the figure that survives the weighting change, and the tool’s own method block says to use it when the verdicts disagree. That is why it is the bottom line of the box at the top.
Q2. Why does the sector comparison change so much?
Equal weighting gives every constituent the same influence, so a sector of 102 names whose median lost 24.14% reads as an index down 10.88%. Capitalization weighting lets the largest names dominate, and in this sector the largest carries 29.24% of the value, which pulled the index to +22.82%. Same constituents, same window, different arithmetic behind the index.
Q3. Is the July 2026 low a company problem?
I found no evidence that it was. The KOSPI fell 22.19% that month with four circuit breakers, and the ₩58,200 close on July 30 sits inside that. The second-quarter release came the following day, July 31, so it postdates the low and did not cause it.
Q5. When are these figures from?
Prices and multiples are the August 14, 2026 (Friday) close, checked at the time of writing; August 15 was a Saturday and a national holiday, so Friday was the preceding trading day. Financial statements are consolidated regulatory filings, with the first quarter of 2026 the last one available in a periodic report and the second quarter taken from the company’s preliminary release. Korean won is the base currency throughout; US dollar figures are approximate, converted at about ₩1,418.6 per dollar, which was the August 13, 2026 (Thursday) night-session close reported in a bank foreign-exchange daily published on August 14. Those three dates do not coincide, and I am saying so instead of implying a precision I do not have.
Company data combines the Kiwoom feed (refreshed August 14, 2026) with consolidated filings from the Korean regulatory system; wherever the two disagreed I printed the disagreement. The listed name is LG CNS Co., Ltd., ticker 064400 on the KOSPI, sector IT services.
- Why Hotel Shilla Lagged the KOSPI as Its Operating Profit Rose
- Pan Ocean Tanker Orders Ahead of a 2028 Delivery Wave
- KG Mobility Operating Margin Stayed Under 1% for Four Years
- Kyobo Securities Earnings: Brokerage Gains, Derivative Losses