Daishin Securities Valuation: Why the P/E Ratio Overstates It
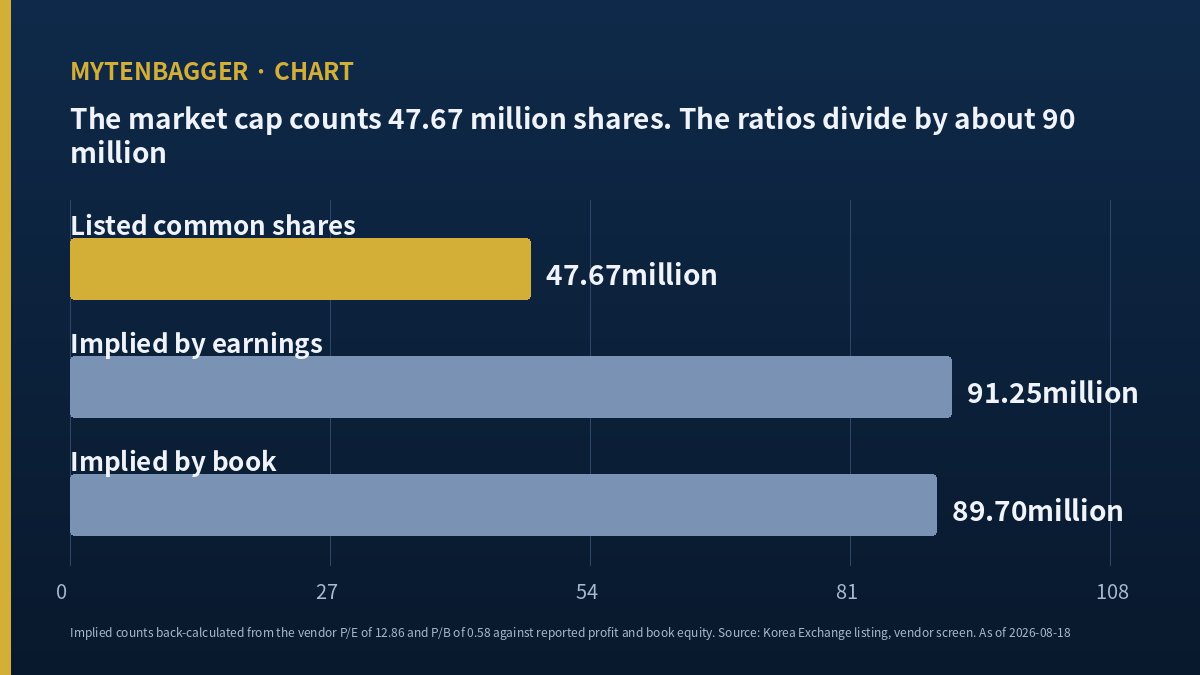
I opened two numbers for Daishin Securities stock on the same screen and they described two different companies. The screen said the price-to-earnings ratio was 12.86 and the price-to-book ratio was 0.58. Then I did the arithmetic a second way, dividing the market capitalization by the profit and the book equity the company actually reported, and got 6.71 and 0.31. Nothing was wrong with either calculation. They were counting different numbers of shares.
What I checked. Daishin Securities (KRX: 003540) closed at KRW 26,300 (about $18.61) on Tuesday, August 18, 2026. Market capitalization KRW 1,253.6bn (about $887 million) against 47,665,399 listed common shares.
What came out. The vendor screen’s per-share ratios are consistent only with a share count near 90 million. Two separate back-calculations, one from earnings and one from book, landed 1.7 percent apart, at 91.25 million and 89.70 million.
What I did not confirm. I could not open the 2026 half-year filing, so I have not verified the share count of each preferred line individually. The direction of the gap is arithmetic; its exact composition is my inference.
Contents
Two ways to price Daishin Securities stock, two answers
Here is the arithmetic laid out so it can be redone from scratch. All won figures are as reported; dollar figures use KRW 1,413.0 per dollar, the Seoul close on the same August 18 date.
| Measure | Per-share route | Market-cap route | Ratio |
|---|---|---|---|
| Earnings | 12.86x (KRW 26,300 divided by EPS KRW 2,045) | 6.71x (KRW 1,253.6bn divided by KRW 186.6bn) | 1.92x |
| Book | 0.58x (KRW 26,300 divided by BPS KRW 45,197) | 0.31x (KRW 1,253.6bn divided by KRW 4,054.1bn) | 1.88x |
The two ratios in the right column are 1.92 and 1.88. They were produced from unrelated inputs (one pair runs through profit, the other through equity) and they differ from each other by about two percent. When two independent routes disagree by almost exactly the same factor, the disagreement is not noise in either route. It is one shared assumption sitting underneath both.
Solving for the share count
So I solved for it. Reported net income attributable to owners for fiscal 2025 was KRW 186,611 million (about $132 million), from the consolidated statements filed with Korea’s electronic disclosure system under receipt number 20260319000718. If the vendor’s 12.86 multiple is consistent with that profit at a KRW 26,300 price, the implied count is KRW 186,611m multiplied by 12.86 and divided by KRW 26,300, which is 91.25 million shares (my calculation).
The book side is more direct. Owners’ equity at the end of fiscal 2025 was KRW 4,054,118 million (about $2.87 billion). Divide that by the screen’s book value per share of KRW 45,197 and the implied count is 89.70 million shares (my calculation).
The Korea Exchange lists 47,665,399 common shares. Both back-calculations sit roughly 42 to 44 million shares above that. Neither is a rounding artifact.
Where the missing 42 million shares in Daishin Securities stock probably sit
Korean listed companies frequently carry preferred lines that trade separately from the common line and never enter the common line’s market capitalization. This company carries at least two of them. The March 24, 2026 annual meeting approved three distinct payouts: KRW 1,200 per common share, KRW 1,250 on the first preferred line and KRW 1,200 on the second, in what the company described as its twenty-eighth consecutive dividend year. A per-share figure computed across all classes divides by all of them. A market capitalization quoted for the common line counts only the common line.
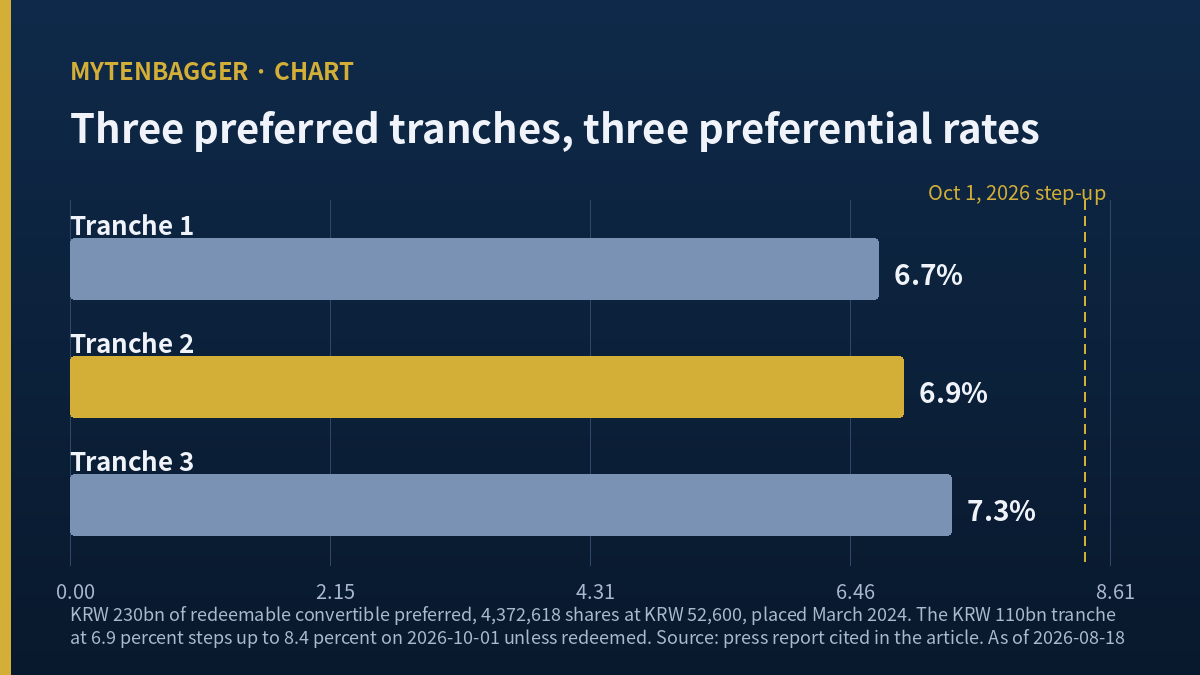
There is a third, smaller piece. To clear the KRW 3 trillion equity threshold Korea requires of a designated comprehensive financial investment business operator, the company issued KRW 230 billion of redeemable convertible preferred shares, 4,372,618 of them at KRW 52,600 apiece, in a private placement settled in late March 2024. Korean press characterized that instrument as closer to a short-dated loan than to equity, because it was issued on the expectation of redemption. Its preferential dividend rates were set at 6.7, 6.9 and 7.3 percent across three tranches, with step-ups written into two of them.
Add roughly 42 million preferred shares to 47.67 million common and the arithmetic closes. I want to be exact about what I have and have not established here: the gap is arithmetic and reproducible, the attribution to the preferred lines is my inference from the dividend resolution, and I did not open the half-year filing to count each class. That last step is the first thing I would do next.
Why the share count changes what cheap means
Because the cheapness looks different depending on which line you read it off. At 0.58 times book, this is a below-book Korean broker among many below-book Korean brokers. At 0.31 times book, the common line is being asked to represent less than a third of a KRW 4.05 trillion equity base. Neither number is the “true” one. But if you read the 0.58 and assume the market capitalization on your screen is a claim on the whole balance sheet, you have merged two share counts into one thesis.
The same question reaches the sell-side numbers, which is where I first noticed it mattered outside my own spreadsheet. The KRW 40,000 figure in the July note implies 52.1 percent above the August 18 close, and the KRW 41,667 consensus implies 58.4 percent (both my calculation). Those are per-common-share valuations, so they inherit the same share count this article has been chasing: they are statements about what one common share should fetch; they say nothing about what fraction of a KRW 4.05 trillion equity base the common line ought to represent. An analyst can be entirely right about the first and silent on the second, and reading the first as though it answered the second is how a reasonable person would end up with a wrong picture of the whole company from a set of individually correct numbers.
The earnings underneath, and one global parallel
The profit side is not in dispute and it is very large. For the second quarter of 2026, Korean press summarizing the company’s filing reported consolidated operating profit of KRW 359.9bn (about $255 million), up 165.2 percent year on year, and net income of KRW 257.8bn (about $182 million), up 242.8 percent. Net brokerage commissions came to KRW 187.8bn, up 158.7 percent, with the domestic-equity portion up 212.7 percent. Trading gains were KRW 178.8bn, up 305.4 percent.
First-half operating profit was KRW 462.4bn (about $327 million), and first-half net income KRW 403.3bn. I checked that second figure against the first-quarter filing: KRW 145.5bn in the first quarter plus KRW 257.8bn in the second gives KRW 403.3bn, closing to the won.
For context on the listing venue: the KOSPI is the main board of the Korea Exchange, the senior of Korea’s two domestic equity markets, and this is a KOSPI-listed name and not a KOSDAQ one. Over the trailing year the KOSPI’s move has been extraordinary in both directions, which is the backdrop to a brokerage printing a quarter like this one. Turnover on that index is the single largest input to a Korean broker’s commission line, which is why the second-quarter brokerage number moved the way it did. I looked at how differently that same turnover cycle lands on a pure retail broker when I wrote up Kiwoom Securities and why market share, not volume, is the number I watch there.
The dividend has not moved in four years, and the yield has doubled anyway
The payout history is worth setting out because it isolates something. Per-share common dividends, from the disclosure record: KRW 620 for 2018, KRW 1,000 for 2019, KRW 1,200 for 2020, KRW 1,400 for 2021, and then KRW 1,200 in each of 2022, 2023, 2024 and 2025. Four consecutive years at an identical figure, with the 2021 payment the only one above it. The July 2026 sell-side note cited elsewhere in this piece described KRW 1,200 as a minimum payout, which is the analyst’s characterization and not a company statement I have seen in a filing.
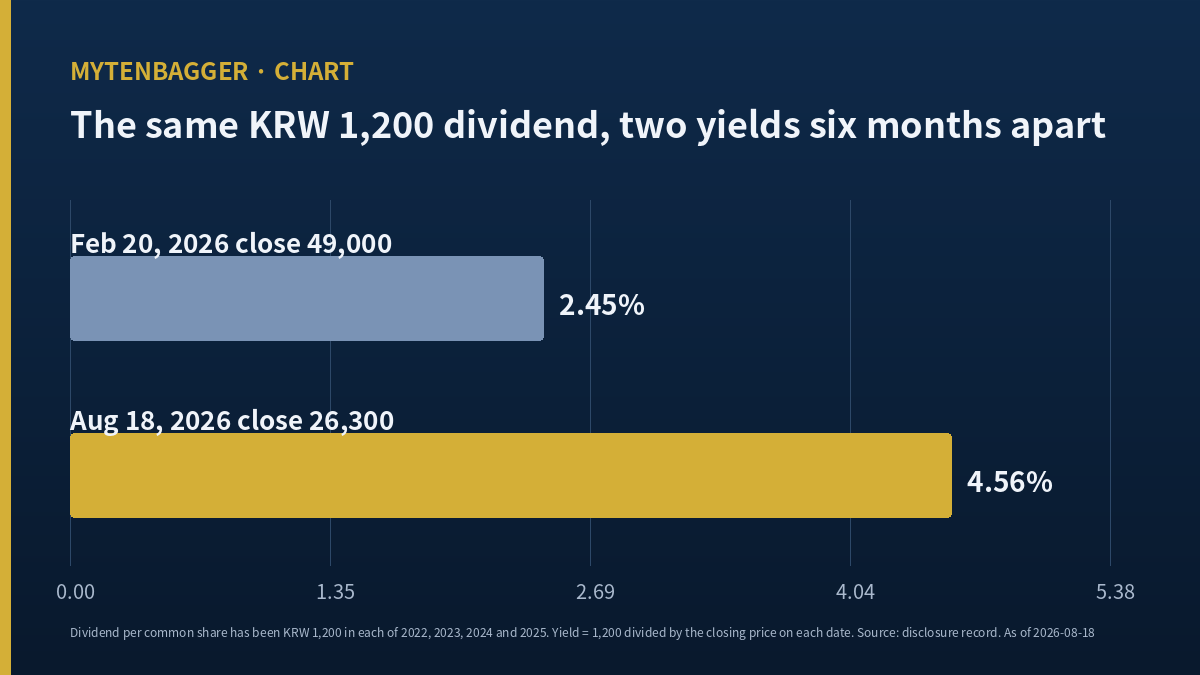
Now put that flat payout against the price. At the February 20, 2026 close of KRW 49,000, KRW 1,200 was a 2.45 percent yield. At the August 18 close of KRW 26,300 the same KRW 1,200 is 4.56 percent. The yield nearly doubled over six months while the company did not touch the dividend once. The whole move came from the price, and only from the price. That is worth naming explicitly because a screen sorted by dividend yield will surface this name today and would not have surfaced it in February, on identical company behavior.
Two footnotes on that 4.56 percent. First, the market-data screen I use displays 4.41 percent, which is the same KRW 1,200 measured against the August 14 close of KRW 27,200 instead of the August 18 close; both figures appear in the same response and I have used the more recent one throughout. Second, the preferred lines pay differently, KRW 1,250 on one and KRW 1,200 on the other for the same year, so a yield quoted for “the stock” is a yield for the common line specifically, which is the same counting distinction this article started with, arriving from a third direction.
The peer I named without a multiple next to it
Two things about that sentence need marking. I am naming it as a structure and not as a comparable, and I am stating the structure from what I already knew rather than from a filing I opened today. Putting one there would repeat exactly the error this article is about, which is placing two differently-counted figures in one row.
What the capital ratios say once you stop counting shares
Share counts are a measurement question. The capital ratios are a business question, and for a Korean brokerage they are read through a metric that has no direct US analogue: the net capital ratio, a regulatory solvency measure expressed as a percentage where higher is safer and where the numbers run in the hundreds, nowhere near 100. Newswhoplus assembled the recent series, and it moves in one direction after mid-2025.
| Quarter | Net capital ratio |
|---|---|
| 2025 Q1 | 513.7% |
| 2025 Q2 | 674.3% |
| 2025 Q3 | 606.6% |
| 2025 Q4 | 429.1% |
| 2026 Q1 | 385.0% |
That is 289.3 percentage points of decline across three consecutive quarters, from the 674.3 peak to 385.0. I recalculated the drop from the two endpoints and got the same figure. The same reporting puts the firm 41st of 61 domestic securities companies on this measure in the first quarter of 2026, and alone among the ten designated comprehensive operators in reading below 1,000 percent.
What makes the series worth sitting with is that it fell while equity was rising sharply. On the separate-entity basis that reporting uses, equity went from KRW 3,112.9bn at the end of 2024 to KRW 4,131.6bn at the end of 2025, an increase of KRW 1,018.7bn or 32.7 percent, then eased to KRW 4,094.7bn in the first quarter of 2026. A solvency ratio that falls through a period of rising capital is telling you that the risk it is measured against grew faster than the capital did. Alongside that, guarantee obligations stood at KRW 4,370bn and corporate loans at KRW 960bn at the end of 2025, and substandard-and-below assets went from KRW 113.6bn to KRW 648.1bn while the watch-and-below category went from KRW 233.8bn to KRW 807.9bn.
One attribution note, because it matters for anyone rechecking this. The equity figures in the paragraph above are the separate-entity numbers used in that Korean reporting; the consolidated figures I used earlier for the book-value arithmetic are different, at KRW 4,057.2bn for fiscal 2025 and KRW 4,038.1bn at the end of the first quarter of 2026. Both are correct on their own basis and I have kept them in separate paragraphs deliberately instead of netting them into one series.
The separate-versus-consolidated split is not a footnote everywhere. At Daol Investment Securities the profit that survives once both subtractions are made is a smaller number than the headline, and I counted it through in my entry on the Daol profit that survives two subtractions.
The cash flow line that looks alarming and is not
Consolidated operating cash flow for the first quarter of 2026 was negative KRW 1,047.5bn. Read with a manufacturer’s instincts, that is a company burning a billion dollars a quarter. Read correctly, it is a brokerage: client deposits, margin loan balances and issued structured products all move through that line, so it swings with balance-sheet growth instead of profitability. Operating cash flow was negative in each of fiscal 2023, 2024 and 2025, at KRW 2,802.7bn, KRW 3,970.6bn and KRW 3,223.9bn respectively, and net income was positive in all three of the same years. The consolidated debt-to-equity ratio of 856.74 percent at the end of the first quarter belongs in the same category: client money and funding are liabilities here by construction. I left both out of the argument for that reason, and I would leave them out again.
What the buyback does to the arithmetic in this article
One mechanical consequence deserves flagging before someone recomputes these ratios in six months and gets different answers. The 47,665,399 figure is shares issued, and shares issued includes treasury stock. If the 15.35 million-share retirement approved in March is executed against the common line, the count that produces the market capitalization falls by as much as 32.2 percent, and a market capitalization built the same way falls with it at an unchanged price, with nothing at all having happened to the equity base underneath. That would widen the gap this article is about instead of closing it. I am flagging it as an artifact of how the figure is constructed, and not as a valuation event, and I repeat that I could not establish how much of the 15.35 million is common versus preferred.
Four arguments against the way I read Daishin Securities stock
- The capital story is more urgent than the counting story. Korean outlet Newswhoplus reported on June 6, 2026 that the firm’s net capital ratio stood at 385.0 percent in the first quarter of 2026, ranking 41st of 61 firms, and that it is the only designated comprehensive operator below 1,000 percent. The next lowest, Hana Securities, was at 1,340.0 percent. Substandard-and-below assets rose from KRW 113.6bn in 2024 to KRW 648.1bn in 2025. A Korean credit rating agency’s assessment quoted in the same piece called the firm’s adjusted capital buffer and its practical competitiveness weaker than peers’, and its domestic and overseas property exposure heavy. Someone could reasonably say that a person spending an article on share counts is looking at the wrong screen.
- Every Korean broker with preferred lines has this gap. The divergence I described is a feature of the market’s share-class conventions, not of this company. If the same arithmetic produces a similar gap at half the sector, then it is context and not a finding, and the interesting question moves to why this particular gap is unusually wide.
- Sell-side is looking straight past all of this. An NH Investment & Securities analyst, Yoon Yu-dong, set a KRW 40,000 valuation on the shares with a buy rating in a July 8, 2026 note, down from KRW 52,000 on March 25 but still well above the KRW 26,300 August 18 close; the consensus figure quoted alongside it was KRW 41,667. None of that work turns on the share-count question I raised.
- And the share count is about to move anyway. The same March 2026 meeting approved the retirement of 15.35 million treasury shares, staged across six quarters. Every per-share figure in this article rests on a pre-retirement count, and I could not establish the per-quarter execution schedule.
Where I stand on Daishin Securities stock, and what would end this
At KRW 1,253.6bn the common line sits outside the KOSPI’s top hundred by value, which under my own rule means observation. What I actually took from the session is smaller and more uncomfortable than a view on the company: I have been treating “market cap divided by book” and “price divided by book per share” as two spellings of one question. On a single-class company they are. Here they are not, and I had never once checked whether the company in front of me was single-class before using them interchangeably. That shortcut, and not this stock, is the thing I came away wanting to fix.
My reading breaks if the half-year filing shows the preferred lines totaling materially less than roughly 42 million shares. In that case the gap has some other source, such as a different equity basis behind the vendor’s book value per share, or a share count carried from a different date, and my attribution was wrong even though the arithmetic was right. I would rather find that out from the filing than defend the inference.
On access, one thing worth stating plainly: there is no US listing for this company, so a US-based holder reaches the common line through a broker with Korea Exchange access, or indirectly through a Korea equity fund. For sector-level exposure instead of single-name, the broad Korea ETFs remain the ordinary route. If you want a Korean broker whose earnings do not swing with turnover the way this one’s do, the fee-on-assets model I described in Samsung Securities and why it held while Kiwoom fell is the opposite end of the same sector.
If you want the other half of what I looked at this session, namely why the share price topped out on February 20, 2026, four months before the index did, and why the record quarter arrived after that, I wrote that up separately in the Korean-language edition of this journal.
Korean won is the reference currency throughout and dollar figures are approximate, converted at KRW 1,413.0 per dollar, the Seoul market close on that same date per KB’s August 18 daily rate page. Financial statement figures come from consolidated filings with Korea’s electronic disclosure system (fiscal 2025 annual report receipt 20260319000718; first-quarter 2026 report 20260514001304) and from Korean press summaries of company announcements; screen-level ratios come from a market-data service using Kiwoom Securities data, queried at its August 18, 2026 refresh.
- SK Biopharm Cenobamate Revenue Grew Faster Than Prescriptions
- Why Hansung Enterprise Stock Doubled: Korea’s Crab Stick Buycott
- Kyobo Securities Earnings: Brokerage Gains, Derivative Losses
- Samsung Electro-Mechanics at 174x Earnings: MLCC Upcycle Outlook
- Young Poong Earnings: Most Profit Comes From Outside Operations
- Kumho Tire Stock Costs the Same as Goodyear: Valuation Compared