GS E&C Price Target Changes and a 1.54x Order-to-Revenue Ratio
GS E&C stock closed at KRW 35,000 on August 25, 2026, up 83.63 percent over twelve months. I did not start there. I started with two lines the company published about itself on February 6, 2026, in the same disclosure: a full-year revenue target of KRW 11.5 trillion and a new-order target of KRW 17.8 trillion.
Divide the second by the first and you get 1.548. The company wrote down, in advance, that it intends to book about one and a half times what it plans to bill. That number is not new either. I ran the same division on the two completed years behind it and got almost the same answer both times.
Order intake divided by revenue, three years (KRW trillion)
FY2024: booked 19.910 / billed 12.864 = 1.548 (order figure from Korean press; no company filing matched to it)
FY2025: booked 19.207 / billed 12.450 = 1.543 (both from the company’s February 6, 2026 results release)
FY2026: target 17.800 / target 11.500 = 1.548 (both from the same disclosure, and both are forward targets)
All three ratios are my own division, and I have not seen any of them printed anywhere. Korean coverage of this company reports the order number and the revenue number as separate headlines, usually in separate articles, and the order headline is almost always the cheerful one.
Contents
GS E&C stock and a ratio the company published about itself
A word on what the two lines mean, because Korean builders disclose them differently from most US engineering firms. New orders here are the contract value signed in a period, counted once, at full contract value. Revenue is percentage-of-completion accounting on work actually performed. So intake above revenue means the order book is growing, and a builder whose intake sat below revenue for several years would be shrinking. On its own the fact is neutral. What caught me is the stability.
Three values within five hundredths of each other, in three consecutive years, one of which is a forward target the company chose. A builder that happened to win a lot of work would not produce that. A builder managing to a planning assumption would. I cannot tell from the outside which of those two this is, and I want to say plainly that I could not confirm it. The company does not publish an intake-to-revenue policy that I could find.
The FY2026 target line has a second feature I keep coming back to. KRW 11.5 trillion of revenue is 7.63 percent below what the company actually billed in FY2025, by my calculation. The plan for 2026 is to sell less and stock more. Reported results have followed the plan: first-half revenue came in at KRW 5.1799 trillion, which is 45.04 percent of the annual revenue target and 17.24 percent below the same half of 2025 (all by my calculation, from the company’s February 6, 2026 disclosure and its quarterly filings).
The half year underneath the ratio
Here is what the same six months produced at the bottom of the income statement. Consolidated revenue KRW 5.1799 trillion. Operating profit KRW 164.8 billion. Net profit KRW 14.37 billion. Net profit for owners of the parent: KRW 2.621 billion. That last figure is 0.0506 percent of revenue by my calculation, and the first quarter’s share of it was KRW 55 million.
Korean outlets did report the first-quarter number. They reported it as “down 99.8 percent year on year,” which is arithmetically correct against the KRW 28.369 billion the company earned for its owners in the first quarter of 2025. I could not find the won amount printed in any of the articles I read. It is KRW 55 million on KRW 2.4005 trillion of quarterly revenue, or about 23 won of owner profit per million won billed, by my calculation.
Between operating profit of KRW 164.8 billion and owner profit of KRW 2.621 billion, KRW 162.2 billion disappears. The largest single line in that stretch is the finance cost account, at KRW 335.9 billion for the half. I will come back to what I could and could not establish about that account, because it is the softest point in this piece.
GS E&C stock, a peer table, and the twelve months it spans
I wanted to see where a 0.75 percent net margin sits among global engineering and construction firms, so I pulled eight of them. Before I could compare a single margin I ran into something I have been quietly ignoring in every peer table I have ever built.
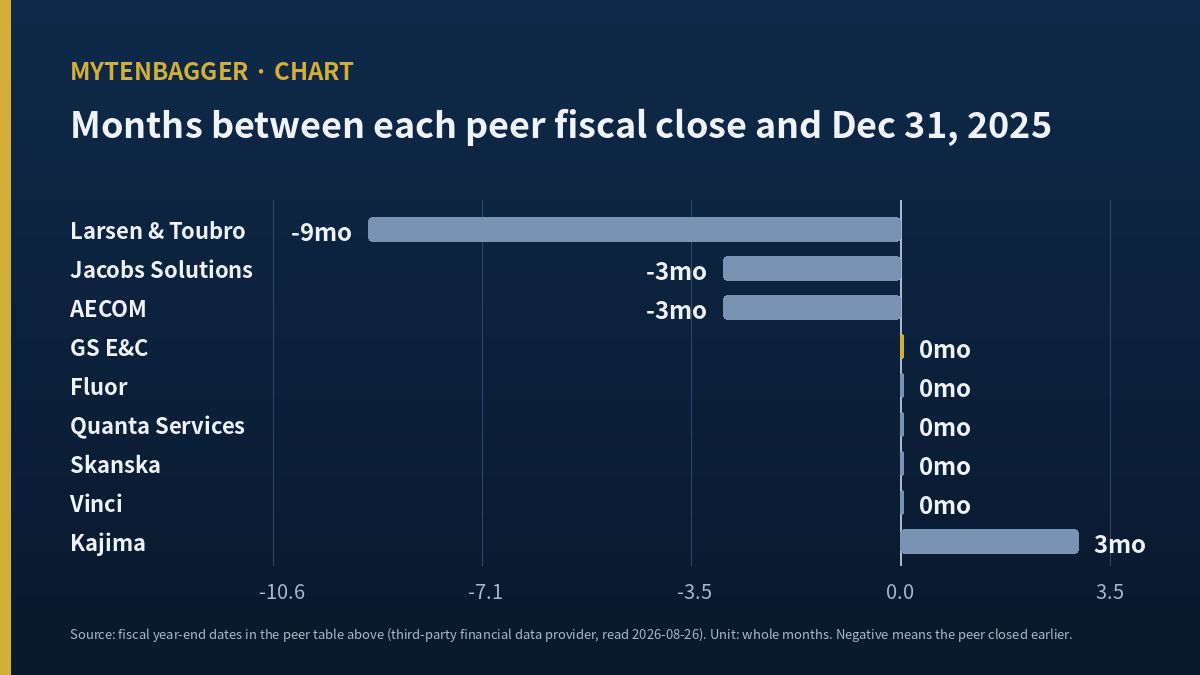
| Company | Fiscal year end | Months offset from my row | Revenue | Net income | Net margin |
|---|---|---|---|---|---|
| Larsen & Toubro (NSE: LT) | Mar 31, 2025 | -9 | INR 2,598,063m | INR 150,371m | 5.79% |
| Jacobs Solutions (NYSE: J) | Sep 26, 2025 | -3 | USD 12,030m | USD 290.25m | 2.41% |
| AECOM (NYSE: ACM) | Sep 30, 2025 | -3 | USD 16,140m | USD 561.77m | 3.48% |
| GS E&C (KRX: 006360) | Dec 31, 2025 | 0 | KRW 12,450,347m | KRW 93,518m | 0.75% |
| Fluor (NYSE: FLR) | Dec 31, 2025 | 0 | USD 15,503m | USD -51m | -0.33% |
| Quanta Services (NYSE: PWR) | Dec 31, 2025 | 0 | USD 28,480m | USD 1,028m | 3.61% |
| Skanska (STO: SKA.B) | Dec 31, 2025 | 0 | SEK 176,658m | SEK 5,702m | 3.23% |
| Vinci (EPA: DG) | Dec 31, 2025 | 0 | EUR 75,372m | EUR 4,903m | 6.51% |
| Kajima (TYO: 1812) | Mar 31, 2026 | +3 | JPY 3,067,275m | JPY 177,334m | 5.78% |
Revenue and net income for every row come from one third-party financial data provider, read on August 26, 2026, in each company’s own reporting currency with no conversion applied. Net income is the figure for owners of the parent. The margin column is my own division of the two columns beside it. The offset column is my own count of whole months between each row’s fiscal close and mine.
Four of the eight share my closing date. Four do not. Fluor, Quanta, Skanska and Vinci close on December 31 like this company. AECOM and Jacobs close in late September, so their most recent completed year ended three months before mine. Larsen & Toubro’s most recent completed year ended March 31, 2025, nine months before mine. Kajima’s ended March 31, 2026, three months after.
The span from the earliest close to the latest is twelve months exactly. Larsen & Toubro’s fiscal 2025 ended on the same day of the year that Kajima’s fiscal 2026 ended, one year apart. Both rows sit in a table I would have described, without thinking, as showing the latest full year for each company. That description is true and useless at the same time. The rows are not looking at the same weather, the same interest rate cycle, or the same construction cost curve.
I have built peer tables in this journal for months and I have never once put this column in one. I did not put it in because I never counted. That is a plain gap in my own procedure and not a discovery about anyone else’s accounting.
What the margin column supports, and what it does not. With that said, the margin column still carries something. Seven of the eight peers converted between 2.41 and 6.51 percent of revenue into owner profit in their most recent completed year. This company converted 0.75 percent. Fluor is the only row below it, at a small loss.
What the column does not support is a claim about relative operating quality, and I will not make one. Different fiscal windows, different tax regimes, different mixes of self-performed work versus consulting fees, and in Kajima’s case a Japanese construction market with its own cycle. I chose these eight companies myself, which means their arrangement on this page is my construction and not a fact about the industry. I have deliberately not written a sentence about where this company ranks.
What Korean sell-side did with GS E&C stock in 2026
Coverage moved in three directions in eight months. Upgrades clustered from late March through early May, downgrades clustered from mid-June through the end of July, and one house went back up in August. The detail I keep is not a number. The same analyst at the same house raised a valuation on April 15, 2026, and cut it below the starting point on June 12, 2026. Fifty-eight days between the two notes.
The July 30, 2026 cut came with a specific reason worth carrying. A Korean brokerage analyst, quoted in Korean business media on July 30, 2026, wrote that second-quarter selling and administrative expense absorbed roughly KRW 100 billion of bad-debt provisioning, and itemized about KRW 42.5 billion of industrial-complex receivables, about KRW 33.0 billion of completed-project receivables and about KRW 50.0 billion of plant incinerator operating losses. Those three add to KRW 125.5 billion, which does not match the “roughly KRW 100 billion” in the same note, and I could not establish whether the difference is rounding or partial classification. Reported second-quarter operating profit was KRW 91.36 billion. Adding the provisioning back would put it just above KRW 190 billion, but that added-back figure is my assumption and not a number the company published. All of this reaches me through Korean-language reporting of the notes, quoted in my own translation, and I did not read the original research.
Forward coverage is thin in a way I want on the record. The only 2026 full-year operating profit estimate I could pin to both a named house and a date is KRW 471.2 billion from a Korean brokerage note dated June 16, 2026, carried in Korean business press. First-half operating profit of KRW 164.8 billion is 34.98 percent of it, by my calculation. The company disclosed revenue and order targets but published no operating profit target. My data provider returns empty fields for forward earnings and forward multiples on this name.
Both of the moving parts the market is paying for sit outside the income statement. One is order intake: second-quarter new orders of KRW 5.2242 trillion, up 61.7 percent year on year, with KRW 7.4695 trillion of first-half urban redevelopment awards, per the company’s July 29, 2026 results. The other is a group data center project in Gangwon Province. One Korean brokerage note dated August 13, 2026 put construction cost at about KRW 1.5 trillion per 150 megawatts on a 1.2 gigawatt plan; another dated August 5, 2026 sized the whole thing at about KRW 10 trillion. Multiply the first figure across the full plan and you get KRW 12 trillion. Two houses, one project, two numbers, and neither is a company disclosure. I could not confirm a construction start, a tenant or a financing structure for any of it. Underneath both stories the housing market they feed is uneven: unsold inventory across Korea reached 67,464 units in the June 2026 government statistics, up 3.4 percent from May, while housing starts in the first half rose 14.4 percent.
The pattern of a Korean builder trading on a future date instead of a result is one I have written up before. I looked at a larger domestic peer whose share price was moving on a nuclear timetable and found the same split between what the filings said and what the price implied. And the pattern of a company leaving a full-year target untouched while the halves underneath it drift is one I traced through a Korean engineering firm whose unrevised guidance implied a much weaker second half. This company is doing the opposite of that one. It cut the target first. A third piece of mine belongs here too, on a Korean utility contractor that earned a profit in every one of seventeen quarters while its cash went negative in four of them, because the gap between a reported result and what actually lands is the same gap I am measuring here, only in a different account.
GS E&C stock, KOSPI, and the holdings I could not source
Korea runs two boards. KOSPI is the senior exchange, where large industrials and banks list; KOSDAQ is the growth board, closer in character to a small-cap venture market. This company trades on KOSPI under 006360, in Korean won, in Seoul hours.
On index membership I have a list of things I could not establish. I do not have a list of things I found. For the two broad Korea funds, the published top-25 holdings of both showed no line for this company, and neither fund’s full holdings list rendered for me. One of them holds 78 positions as of August 21, 2026 by its own count; the other holds 162 as of August 14, 2026. So the position could be in the unrendered remainder of either, or in neither.
What I want to be precise about is the difference between an absence and a failure to look. Every item above is the second kind. None of it is evidence that no such holding exists. It is evidence that the lists I checked did not resolve, and a reader who opens one has found something I missed.
Numbers I left out of the argument
The finance cost account
My data provider reports interest coverage of 0.49 for the first half, and the arithmetic reproduces: KRW 164.8 billion of operating profit over KRW 335.9 billion of the finance cost line. The same line runs KRW 295.2 billion in 2022, KRW 462.6 billion in 2023, KRW 616.9 billion in 2024 and KRW 574.0 billion in 2025, against revenue that grew 1.23 percent across that span by my calculation.
I did not build the piece on that ratio, for one reason. Korean reporting put consolidated net debt at roughly KRW 3.8 trillion as of March 2025, and a KRW 574.0 billion pure interest charge against that balance implies a rate no borrower of this size pays. Under IFRS this line frequently carries total finance costs, including derivative valuation losses, foreign exchange losses and receivable discount charges. My provider’s own field notes say the underlying account falls back to the broad finance cost tag when the narrow interest tag is missing, and that a fix to that priority applies only to data recollected after August 25, 2026. This name was last collected on August 20. So the level is unusable and only the trend within one consistently tagged account survives.
The dividend growth fields
The three-year dividend growth field reads minus 21.2 percent. Compounding from KRW 1,300 three years back down to KRW 500 over three periods gives minus 27.28 percent; over four periods it gives minus 21.25 percent, which matches. The five-year field is displaced the same way. The labels and the compounding windows disagree, so both fields stayed out.
One thing I checked that did hold
Market capitalization reconciles to the share count exactly. KRW 35,000 times 85,582,857 shares gives KRW 2,995,399,995,000, which rounds to the KRW 2.9954 trillion my screen shows. Per-share work in this piece rests on that.
A gap in the order numbers I could not close
Summing the company’s quarterly new-order disclosures gives KRW 7.8267 trillion for the first half. A brokerage note dated July 30, 2026 cites first-half housing new orders of KRW 8.6 trillion. The part exceeds the whole, so the two figures are not the same series, and I could not confirm from company notes whether one counts contractor selection and the other counts signed contracts. Only the quarterly sum appears in my group-level arithmetic.
Where I stand on GS E&C stock and what would break the reading
I am watching it. At KRW 2.9954 trillion the company sits outside the KOSPI top hundred by value, which puts it in the watch-only default I apply to everything that size, and nothing in this half year gave me a reason to override that.
The structure I see is a company that is filling its book faster than it is emptying it, on purpose, and paying for the gap in the meantime. Order intake at 1.54 times revenue for a third year means the work exists. It also means the revenue that would service the balance sheet has been deliberately deferred, and the half-year owner profit of KRW 2.621 billion is what deferral costs while it lasts. The market is pricing 2028. The filings are settling 2024. I have not built enough conviction to skip the two years in between.
My checkpoint is the third-quarter report. Two things decide it. First, does third-quarter cumulative operating profit divided by the same period’s finance cost line clear the 0.491 the first half produced. Second, does the intake-to-revenue ratio for the full year come in near 1.54 again, or does it break out of that band once actual results replace targets. The statutory filing deadline is November 15, 2026, which falls on a Sunday, so the report arrives on or after Monday, November 16, 2026.
The reading breaks if the ratio turns out to be coincidence. Three points make a line only if something is producing them. If the FY2026 result lands well away from 1.54 while nothing changes in how the company runs, then what I found was three numbers that happened to sit near each other, and I built a structural argument on a rounding accident. I hold that possibility open, and it is the single most likely way this piece ages badly.
Seven ways this reading could be wrong
- The one that hurts most. The FY2024 leg of my three-year ratio rests on an order figure I took from Korean press and never matched to a company filing. If that number is off, “three years running” collapses into two, and two points do not make a pattern at all.
- Intake above revenue is what a healthy builder looks like during an expansion. I have framed it as deliberate deferral, but a company simply winning more work than it can execute produces the same ratio and would deserve a warmer reading than mine.
- KRW 2.621 billion is the parent’s share. Consolidated net profit was KRW 14.37 billion, so subsidiary minorities took the larger part. A group whose subsidiaries earn is not obviously worse than one whose parent does.
- If the roughly KRW 100 billion of provisioning in the second quarter is genuinely non-recurring, then KRW 91.36 billion of operating profit is not this company’s run rate and every ratio I built on the half is depressed by a one-off.
- A water treatment subsidiary sale agreed in August 2025 and not yet closed would bring in more than KRW 1 trillion. Applied to debt, it improves my finance cost ratio without the company earning anything more. Reported closing timing splits between the second half of 2026 and early 2027 depending on the outlet.
- The same sale removes roughly KRW 900 billion of annual revenue and around KRW 120 billion of operating profit, per Korean sell-side estimates. I did not model that hole, which cuts against my own framing in the opposite direction from item five.
- My peer table takes revenue and net income for every row from a single third-party data provider, and for this company that provider’s operating profit figure differs from the company’s own release by tens of billions of won. I used the provider’s figures for consistency across rows and the company’s own filings everywhere else, which means two series appear in one article. I kept them out of any single division, but a stricter writer would have refused to put them in one piece.
One more thing belongs here. A fiscal year is the unit I have been treating as free. Every peer table I have built in this journal has quietly assumed that “the latest full year” means roughly the same twelve months for every row, and I never checked. It took about a minute of counting to find that four of nine rows in this one are looking at a different year than I am, and that the group spans a full twelve months end to end. The counting was trivial. Not having done it for months is the part I am recording.
Korean won is the reference currency throughout; the KRW 2.9954 trillion market capitalization is approximately USD 2.17 billion at roughly 1,382.4 won per dollar, the Seoul market close of August 24, 2026, and that conversion is deliberately approximate. Company financials come from Korean regulatory filings, including the half-year report filed August 14, 2026, and are quoted in millions or billions of won as marked. Korean-language sources appear in my own translation. Peer figures come from one third-party provider as noted under the table.
- DL E&C Q2 Earnings: What the Headline Profit Jump Actually Counts
- Haesung DS Free Cash Flow: Three Years of Borrowed Plant
- Kumho Tire Stock Costs the Same as Goodyear: Valuation Compared