
Korea’s DI Corporation Valuation Against Its Book Value
- At its twelve-month low of 15,010 won ($11.05), DI Corporation stock valued the whole company at 424.8 billion won ($312.7m),
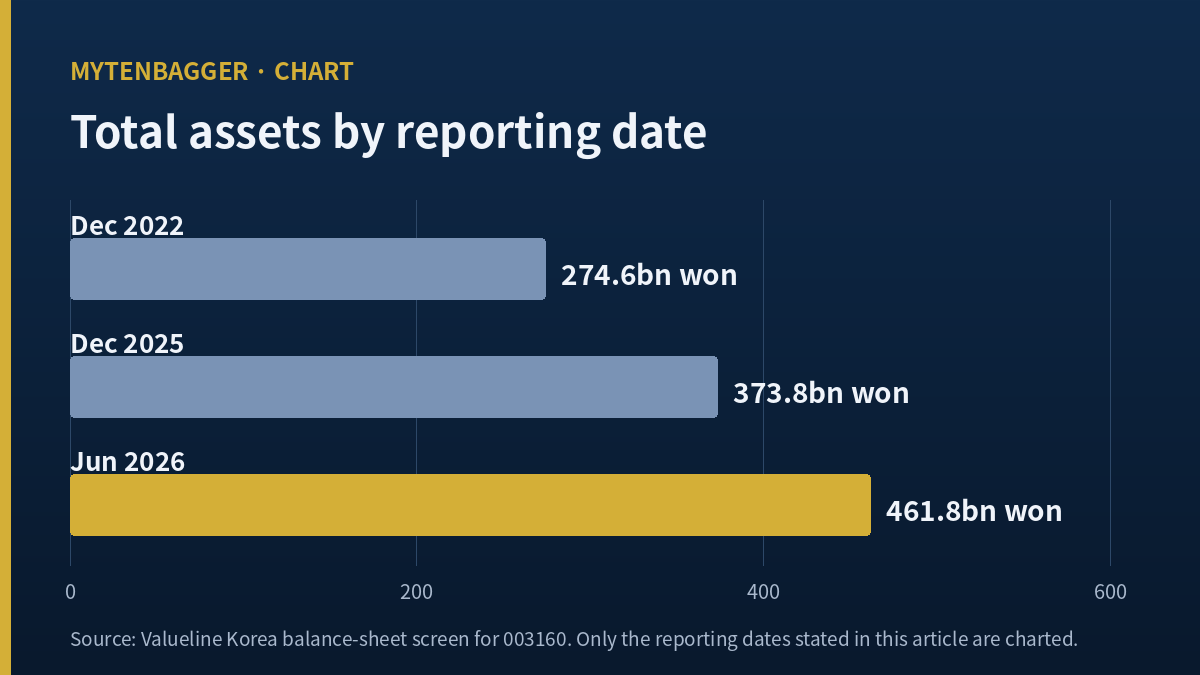
- which is 13.6% above the 373.8 billion won of assets the company had on its last published statement at the end of 2025, and 8.0% below the 461.8 billion won it published for the end of June 2026,
- so the answer to “did the price ever fall under the company’s own assets” is yes and also no, and I cannot pick one, because the screen that gave me the low does not give me its date.
The thing I was measuring against moved while I was measuring it. That is what I learned looking at DI Corporation stock this week, and it took me two passes to notice, because the first time through I treated the asset side as a fixed wall and the price as the only moving object.
DI Corporation (KRX: 003160) makes memory and logic burn-in testers and wafer test boards. It was founded in 1955, sits in Seoul, and has traded on the Korean exchange since 1996, according to its English-language encyclopedia entry. KOSPI, where it trades, is Korea’s main board and plays roughly the role the S&P 500 plays in the United States. On September 23, 2026, the close was 36,750 won, about $27.05, and 28.3 million shares put the market value at 1,040.0 billion won, roughly $765.6m.
Contents
What twelve months did to DI Corporation stock and to its statements
The twelve-month range on my screen runs from 15,010 won ($11.05) to 41,700 won ($30.70). At the bottom of that range the company was worth 424.8 billion won ($312.7m). At the top it was worth 1,180.1 billion won ($868.7m). The distance between those two market values is 755.3 billion won, which exceeds the company’s entire asset total at any reporting date I can see.
That by itself is not interesting. Small Korean equipment makers swing like this. What caught me is the middle term. Over the same twelve months, the asset side of this company went from 373.8 billion won ($275.2m) at the end of December 2025 to 461.8 billion won ($340.0m) at the end of June 2026, a gain of 88.0 billion won, or 23.5%.
A price low worth 424.8 billion won is above a 373.8 billion won statement and below a 461.8 billion won one. Both statements belong to the same twelve months.
The low, the high, and the two statements in between
Let me set the arithmetic out plainly so anyone can redo it. The number of shares in issue is 28.3 million on two separate screens, so I treat that as settled. Multiply by the low of 15,010 won and I get 424.8 billion won. Divide that by 373.8 and I get 1.136, which is 13.6% above. Divide it by 461.8 and I get 0.920, which is 8.0% below.
Both of those are true statements about one price. They are true about different reporting dates. I did not construct either statement; both are published, and the second has been public since the six-month report went out in August.
Where today’s price sits against the same wall
At 36,750 won the company is worth 2.25 times its June asset total and 4.37 times the 238.2 billion won ($175.4m) of net assets I get by taking liabilities off assets on that same June statement. That step is mine, and it does reproduce: for the four December dates, my own figure matches an independent data provider’s published total-equity line to within 0.1 billion won each year. I would not lean on a figure of my own that failed a check like that, and this one passed it four times.
Why I cannot date the crossing for DI Corporation stock
To say the price crossed under the company’s assets on a particular day, I would need two things: the day the low printed, and the statement that was public on that day. I have neither with confidence.
The screen gives me the range but not the dates inside it. Korean six-month reports land in August, so any low that printed before August was being compared, by anyone looking at the time, against the December 2025 statement. Under that statement the low was 13.6% above assets and no crossing happened at all. Under the statement we have now, it was 8.0% below.
I looked for the date and did not find it in a form I would cite. I am leaving the gap marked open. This is not a small omission for my purposes, because the whole reading turns on it, and I would sooner carry an open question than a dated claim I cannot support.
Three legs of the asset side, growing at three speeds
If the asset side is going to be one side of my comparison, I should know what it is made of. Between December 2022 and June 2026 the total went from 274.6 billion won ($202.1m) to 461.8 billion won, a gain of 187.2 billion won, or 68.2%. The three legs did not move together.
| Item (billion won) | Dec 2022 | Jun 2026 | Growth multiple |
|---|---|---|---|
| Current assets | 132.0 | 294.9 | 2.23x |
| Property, plant and equipment | 75.4 | 111.0 | 1.47x |
| Investment assets | 19.3 | 24.2 | 1.25x |
| Total assets | 274.6 | 461.8 | 1.68x |
Source: Valueline Korea balance-sheet screen for 003160, reporting dates as labeled. The original unit is 100 million won and I converted to billion won. Growth multiples are my own division of the two columns. Jun 2026 is a six-month reporting date and not a fiscal year end.
Current assets carried 162.9 billion won of the 187.2 billion won total gain, which is 87% of it. Plant carried 35.6 billion won. The investment caption carried 4.9 billion won. So the leg holding what this company owns of other things grew at roughly a third of the pace of the company as a whole.
Set those gains beside the market value and the proportions change again. The 187.2 billion won that this company added to its asset side across the whole period is 18.0% of what the market says the whole company is worth today. Put differently, the market is paying about 5.6 times the entire asset growth of the period for the right to own the result of it. That is not a criticism of the price, because a test-equipment maker is bought for what its plant produces and not for the plant, but it does tell me the asset side is a small part of the case.
Three speeds is not the same as three stories
I want to be careful about what a growth multiple can carry. Two providers can put different numbers on the same income statement item, and when they do, I leave that item out of my thinking entirely. I have written up a Korean equipment maker whose next-year earnings were put 2.3 times apart by two houses, and the lesson I took was that a figure two sources disagree about is not evidence yet. The four numbers in the table above do not have that problem: the asset captions came from one screen and the total-equity check came from a second, and they agreed. So I am willing to read the three speeds. I am not willing to say what caused them.
The one leg of DI Corporation stock’s asset side that went backwards
Read year by year, the investment caption goes 19.3, 27.8, 27.4, 16.0, 24.2 billion won. It falls twice. The second fall is the large one: from 27.4 at the end of 2024 to 16.0 at the end of 2025, down by 11.4 billion won, which is more than two fifths of where it stood. Then it returns to 24.2 by June 2026, still below where it sat at the end of 2023.
Nothing else on the asset side does this. Current assets rise in every step. Plant rises in every step except the last, where it is flat as printed: 111.2 then 111.0 billion won. So in the six months when the company added 88.0 billion won of assets, it added nothing at all to its plant.
I do not know what moved inside that caption. Fair-value marks, a disposal, a reclassification and an equity-method loss would all look identical at this resolution. I did not open the notes that would tell me, so I am recording the pattern and leaving the cause blank. What I take from the pattern is narrow: this company’s asset side grew through operating and not through buying. A firm purchasing its growth would show the opposite, and this one does not. There is a version of this trap I have written about before, in a chip designer resting on the exact product family its peers were walking away from, where the single moving item was the whole story. Here the single moving item is the one I understand least.
There is a fourth leg, and it is the one nobody prints as its own item. Take investments and plant off non-current assets and what remains is everything else long-dated: intangibles, deposits, deferred items. At the end of 2022 that remainder was 47.8 billion won. At the end of June 2026 it was 31.7 billion won. It fell 16.1 billion won, close to a third of itself, over a stretch when the company as a whole grew 68.2%. Two of the four long-dated legs shrank, one grew slowly, and one more than doubled.
The same arithmetic said another way: current assets were 48.07% of the asset side at the end of 2022 and 63.86% of it in June 2026. The center of weight moved 15.79 percentage points toward the short end. A company whose assets are increasingly short-dated is a company whose asset total tells you less about what it can build and more about what it happens to be holding on the reporting date. That is a second reason the wall I was measuring against is a poor wall.
What the first six months of 2026 added to DI Corporation stock
The six-month period is where the comparison I opened with actually comes from, so it is worth going slowly. Assets went from 373.8 to 461.8 billion won, up 88.0 billion. Liabilities went from 187.9 to 223.6 billion won ($164.6m), up 35.7 billion. Net assets, with liabilities taken off by me, went from 185.9 to 238.2 billion won, up 52.3 billion. So 40.6% of the asset growth was matched by liabilities and 59.4% by shareholders, and those two shares add back to the whole.
Cash went the other way, from 107.1 billion won ($78.9m) to 58.3 billion won ($42.9m), down 48.8 billion, or 45.6%. In a period when the asset total grew 23.5%, the cash item lost nearly half of itself. I am not building anything on that, because I have not traced where it went, and a company delivering large test systems can move that much cash into work in progress with nothing being wrong. But it is the single largest one-item move on the statement and leaving it unmentioned would be dishonest.
The leverage figure is the one figure here I built myself that I can check against a published one. A Korean market data screen prints 101.07% for the end of 2025. Dividing liabilities by net assets at that date returns the same 101.07% when I use the source’s original units, and 101.08% if I round both inputs to a tenth of a billion first. I am recording that rounding gap and not hiding it, because what the check establishes is that their denominator and mine are the same quantity, and they are. That is why I am willing to use the June figure the screen does not yet print: 223.6 over 238.2 gives 93.87%. Leverage crossed above one and came back under it in six months.
Dates matter here in a way I usually skip. Another Korean test-equipment maker whose low printed on a day I could pin down to the calendar gave me a comparison I could actually close, because I knew what was public on that day. This piece does not have that, and the difference between the two cases is one date.
Liabilities grew faster than net assets, and both grew
Over the full stretch from December 2022 the ordering is clean. Liabilities grew 101.1%, from 111.2 to 223.6 billion won. Total assets grew 68.2%. Net assets grew 45.8%, from 163.4 to 238.2 billion won. Liabilities grew faster than the company and shareholders’ funds grew slower than the company, which is the arithmetic definition of rising leverage across the period even though the latest reading came back down.
This is the part of the asset-side reading I find most usable, and also the part that most limits the price comparison I opened with. If I am going to hold a market value up against a company’s assets, the assets I am holding up carry a third more debt behind them than they did three and a half years ago. The wall is bigger and it is also more borrowed.
For a reader outside Korea, the local comparison that helps most is a company whose business is the same category and not the same size. Aehr Test Systems (NASDAQ: AEHR) is the name I reached for, because burn-in test is what its whole company is, and picking a firm where the category is the entire business tells me whether I am measuring a company or a category. I am putting no figures from it in this piece, and I want to be explicit about why: the accounting standard differs, the reporting currency differs, and the business scope differs. Three differences is enough for me to name the company and stop there.
Numbers I left out of this DI Corporation stock reading
Two things looked usable and did not make it in. Writing down why is cheaper than rediscovering it later.
The net assets a per-share screen uses are not the net assets on the statement
One screen prints a per-share net asset value of 5,779.79 won for the end of 2025. Multiply by 28.3 million shares and I get 163.6 billion won. The figure on the same date, by both my own arithmetic and the independent provider, is 185.9 billion won. The difference is 22.3 billion won, or 12.0%. The obvious candidate is the portion of group net assets belonging to minority holders of subsidiaries, and I did not confirm it. Since I could not confirm it, I did not build a per-share net asset figure into this piece at all. What I will say is the division: take the June figure over the number of shares and you get roughly 8,400 won a share, which is my arithmetic on my own arithmetic, twice removed from anything published.
A single-source twelve-month range, and no per-share figure from anyone else
The 15,010 and 41,700 won range came from one screen. A second screen I checked did not carry the range at all. A one-source input holding up one side of a thesis is thinner than I like, and it is why the conditions further down include getting a second reading of those two numbers.
The other omission is a per-share figure from anyone other than me. I did not find one. Three routes were tried: the two Korean research aggregators that would normally carry one are closed to automated reading, the international aggregator I can reach leaves this company’s estimate fields empty, and a general search returned index pages and not a note with a name on it. So there is no third-party per-share number in this piece, on either side of it, and the reason is absence and not choice.
Eleven ways this reading of DI Corporation stock is wrong
- The twelve-month low and high come from a single screen and I did not verify either against a second source.
- I do not know the date of the low, which makes the central comparison in this piece bounded and not settled.
- The June 2026 statement is a six-month one. Six-month figures get restated at the fiscal year end more often than annual ones do.
- Net assets here are liabilities taken off assets by me. It matched a published figure for four December dates, but June was not one of the dates I could check.
- The investment caption is a single aggregate. Four quite different events would look the same at this resolution.
- Cash fell 45.6% in six months and I did not trace it. If it went somewhere it does not come back from, the asset side I am comparing against is softer than it looks.
- Plant did not move over those six months. A company that just doubled its revenue and stopped adding capacity may be constrained and not efficient, and a balance sheet cannot tell me which.
- Holding a market value against total assets ignores what those assets earn. A test-equipment maker with high returns on its plant should trade above its net asset value, and there is nothing anomalous in 2.25 times.
- The 12.0% gap on the per-share screen is unexplained in this piece. If it is not what I suspect, my decision to drop per-share net asset value was based on a misreading.
- I found no named forward estimate for this company at all. That means there is no expert on the other side of this reading either, which cuts both ways.
- The market value of 1,040.0 billion won rests on one closing print, and that close came in more than five percent above the one before it.
Seven conditions that break it
- If a second source gives a twelve-month low materially different from 15,010 won, both comparisons at the top of this piece change and I redo them.
- If I find the date of the low, the piece stops being about two statements and becomes about one, and the open question closes.
- If the Q3 report (statutory filing date November 16, 2026) shows the asset total falling back toward 373.8 billion won, then the June figure was a shipment-cycle peak and not a new level.
- If plant starts rising again in the second half of the year, the flat period was timing and not a decision, and my reading of it as a decision was wrong.
- If cash recovers toward 107.1 billion won with no new borrowing, the cash drop was work in progress and carries no warning.
- If leverage goes back above 100% at the year end, the June reading of 93.87% was the exception and not the correction.
- If two or more named houses publish forward estimates, the coverage gap in this piece disappears and I rewrite the whole thing against their numbers.
Of those seven, I put the highest odds on the third, at roughly 40%: six-month asset totals at equipment makers do tend to peak with shipments. I put about 25% on the fourth, about 20% on the fifth, and the remaining 15% spread across the others. Those are my personal weights and I did not calculate them. The only reason I am attaching them is that writing “any of these might happen” would hide the fact that I think some are far likelier than others.
Where I stand on DI Corporation stock
I do not own it and I have no order in. A market value of 1,040.0 billion won puts it outside the hundred largest companies on this market, which makes it something I watch and not something I size. The dividend declared on the 2025 result comes to under one percent of the close, so it does not move my thinking either way.
A twelve-month range is the input I usually skim past fastest, and this week it was the only one that made me stop. I have used ranges for years as a rough sense of where a price sits, and I had never once asked what the company looked like at the two ends of one. When I did ask, the answer was that the company at the bottom of the range was a different company on paper from the one at the top, because the paper had been rewritten in between. So the correction I am making to how I work is this: when I compare a price to an asset total, I write down the date of both before I write down the multiple.
What I am waiting for is not a figure and not a filing. It is one fact I could not get, the day the twelve-month low printed. If I had it, this piece would resolve into a single sentence. And I should say plainly that this fact may simply not be available to me in a form I would use, in which case the question I opened with stays open and I will have to decide whether to keep holding prices against asset totals at all. How would you read a range whose two ends belong to two different companies?
Prices and multiples reflect the September 23, 2026 close. USD conversions are approximate, at roughly 1,358.4 won per dollar, the Seoul market close on that date as reported by Money Today. Asset and liability figures come from the Valueline Korea balance-sheet screen, cross-checked on total equity against Investing.com’s annual figures; the leverage comparison uses Hankyung’s market data page, a Korean-language market data source. Price, shares in issue and the twelve-month range come from Alphasquare and Kokstock, and the company description from its encyclopedia entry. Growth multiples, net assets taken off by me and the per-share division are my own arithmetic.
Related reading
- Korea Cast Iron Pipe Outlook Hinges on Its Unpaid Invoices
- Daewoong Pharmaceutical Current Ratio Falls Below 100%