Korea’s PNT Inventory Turnover: One Balance, Four Answers
I opened PNT stock expecting to spend my time in the income statement, and I spent it on one line of the balance sheet instead. The habit goes back about three years, to a stretch when I was reading through Korean machinery builders one after another. Until then I skipped the inventory line in industrial filings. A company that builds things keeps things, and the only two stories I expected from that line were “up” and “down.” Then I met several builders whose inventory was larger than their entire year of sales, and learned that this was the ordinary condition of the trade and not an accident.
This company, listed in Seoul under the code 137400, is built the same way. At June 30, 2026 its inventory stood at 817.177 billion won, about USD 601.6 million at the rate below, against total assets of 2,003.602 billion won. A data vendor I use also computes inventory turnover in days and hands it over with the rest of the screen. That figure moved between 185.82 days and 956.78 days across the periods it covers. Five times, for one line of one company. So before I looked at the business I reversed the arithmetic.
Divided into Q3 2025691.51 days (that quarter sold 107.538 billion won)
Divided into Q4 2025199.84 days (that quarter sold 372.104 billion won)
Divided into Q1 2026733.07 days (that quarter sold 101.441 billion won)
Divided into Q2 2026632.48 days (that quarter sold 117.574 billion won)
So I rewrote the question. Asked as “how many days,” it has no single answer. Asked as “how many days against which three months,” it has one. The four answers sit 533.23 days apart, and what opened that gap is how unevenly quarterly sales arrive, while the balance itself never moved.
Position: no shares held, no order placed, watching. I own none of this company and I have no bid working.
Contents
What PNT stock is priced against is a shop that ships in bursts
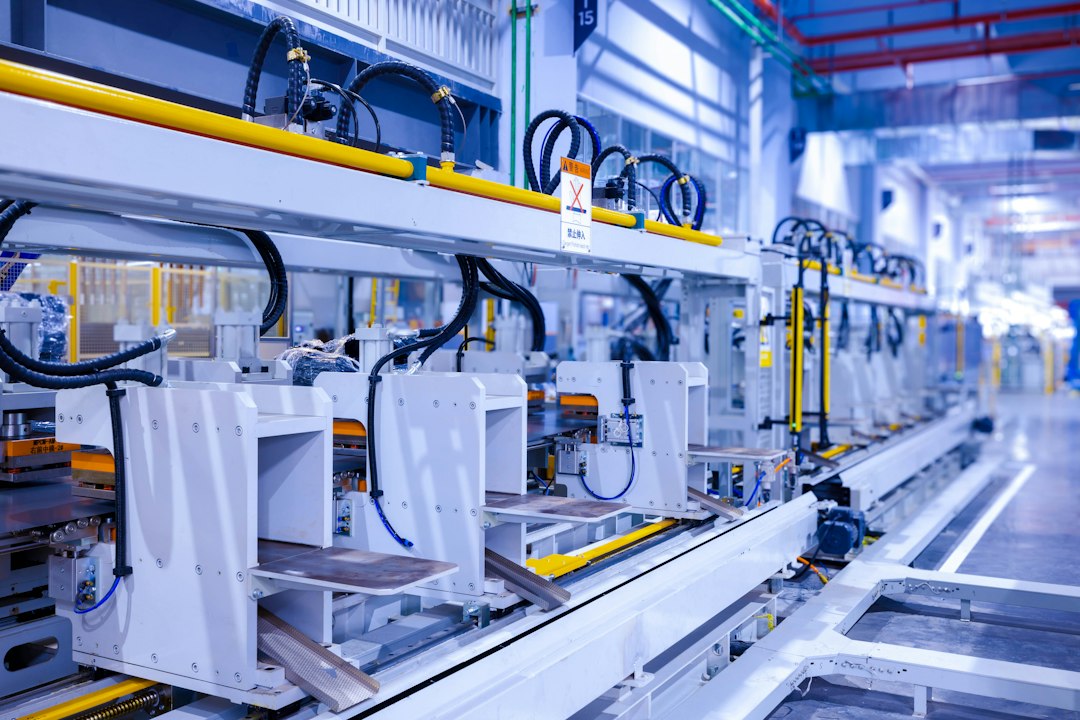
The company builds process equipment for lithium-ion electrode production. Its core machines coat active material onto copper and aluminum foil, press that foil to a target thickness, and unwind and rewind it through a continuous roll-to-roll path. In the last several years it has pushed beyond machines into materials, taking stakes in copper foil production in China and in lithium iron phosphate cathode work. Both are additions to the revenue mix; neither is the base business.
Two facts about the listing matter for readers outside Korea. First, the shares trade on KOSDAQ, the growth board of the Korea Exchange, which sits beside the main KOSPI board and carries most of the country’s mid-size technology and equipment names. Second, the sector label is contested even among Korean data providers: my vendor writes “electrical products” while Alphasquare writes “electrical equipment” for the same company. One business, two labels. I mention it because the same disagreement runs through everything else in this entry.
The important structural fact is about delivery. A single coating line is a bespoke installation worth billions of won, and the gap between a signed order and a commissioned machine runs well past a year. Nothing about that is unusual for capital equipment. What it does to the accounts is specific: work sitting in progress has to live somewhere on the balance sheet, and in this company’s filings it lives in inventory.
The line that dwarfs the factory
The largest single asset on this balance sheet is not the plant and it is not cash. It is inventory. At the end of 2022, inventory of 728.308 billion won was 66.9467 percent of total assets of 1,087.892 billion won. At the end of 2025, inventory of 759.810 billion won was still 44.2227 percent of total assets of 1,718.145 billion won. The share came down across four years, and even at the bottom of that range roughly one asset won in two was stock.
| Year end | Inventory | Total assets | Inventory share | Inventory to that year’s sales |
|---|---|---|---|---|
| 2022 | 728.308 | 1,087.892 | 66.9467% | 1.7431x |
| 2023 | 1,015.559 | 1,601.330 | 63.4197% | 1.8620x |
| 2024 | 810.826 | 1,620.271 | 50.0426% | 0.7833x |
| 2025 | 759.810 | 1,718.145 | 44.2227% | 1.0200x |
The final column is the shortest description of the trade I can give. In 2023 the closing inventory of 1,015.559 billion won was 1.8620 times that year’s revenue of 545.413 billion won. In 2025 the closing inventory of 759.810 billion won was 1.0200 times revenue of 744.889 billion won, so what the company kept at year end and what it sold through the year were nearly the same size. In a distributor that reading is an alarm. In a builder of bespoke machines it is a description of the order book working its way through the shop. I decided not to treat it as a warning, and to test instead whether the standard way of converting that line into a number of days holds up here.
Why I did not stop at the ratio
An inventory share of 44 percent invites a quick verdict in either direction. Either the company is choking on unsold machines, or it is sitting on a year of contracted work that will convert. The share alone cannot separate those two, and neither can the inventory-to-sales multiple, because both interpretations produce the same number. Days of stock is the conventional tool for splitting them, since it puts the balance on a timeline. That is the tool I went to, and it is the tool that came apart.
One balance, four quarters, four answers
Days of inventory takes a stock balance, divides it into sales, and multiplies by a period length. My vendor computes it once per reporting period and prints it alongside the price data, using the formula inventory divided into that single quarter’s sales, multiplied by 91. The division line therefore carries three months of selling, not a year of it. If a company sells evenly through the year, that construction is fine. This company does not sell evenly.
So I froze the balance and changed only the three months underneath it. The table below takes the single figure of 817.177 billion won from June 30, 2026 and runs it against each of the four most recent quarters of discrete sales. One warehouse, one measurement date, four results.
| Quarter used underneath | That quarter’s sales (bn won) | Days returned | Gap to the smallest answer |
|---|---|---|---|
| Q1 2026 | 101.441 | 733.07 | +533.23 |
| Q3 2025 | 107.538 | 691.51 | +491.67 |
| Q2 2026 | 117.574 | 632.48 | +432.64 |
| Q4 2025 | 372.104 | 199.84 | baseline |
The largest answer of 733.07 days is 3.6683 times the smallest of 199.84 days. That multiple comes from the unrounded figures, and it equals 372.104 / 101.441, the ratio of the two quarters of sales. The balance was identical, the formula was identical, and the 91 I multiplied by was identical. The only thing I changed was which three months of selling went underneath. That is where I stopped reading the warehouse and started reading the sales pattern.
I have walked into this same trap before in this industry. When I took apart which slice of EcoPro BM’s profit actually belongs to its own holders, the trap was structurally the same: a figure that looks like one number turns out to depend entirely on which population you put beneath it. Korean industrials are full of published metrics whose construction is not printed next to the result.
Eighteen quarters put PNT stock’s turnover between 185 and 957 days
Four quarters is a thin sample, so I rebuilt the whole series from Q1 2022 through Q2 2026 using the same formula, this time letting each period’s own closing balance sit on top. That reproduces exactly what the vendor publishes, which was the point. It reproduced. My 632.48 days for Q2 2026, 703.73 for Q1 2026, and 185.82 for Q4 2025 matched the vendor output to the second decimal.
What those eighteen answers look like together is the problem. The largest is 956.78 days at Q2 2023 and the smallest is 185.82 days at Q4 2025. The largest is 5.1491 times the smallest on the unrounded figures, a spread of 770.96 days. Thirty-one months of stock and six months of stock are both sitting inside one published series for one company.
The balance did not move that much. Across those eighteen periods the highest closing inventory was 1,070.214 billion won at Q3 2023 and the lowest was 373.376 billion won at Q1 2022, so 1,070.214 / 373.376 = 2.8663 times. Turnover swung 5.1491 times while the thing being measured swung 2.8663 times. The extra travel came from outside the balance sheet.
The fourth quarter of 2025 did most of the work behind PNT stock’s spread
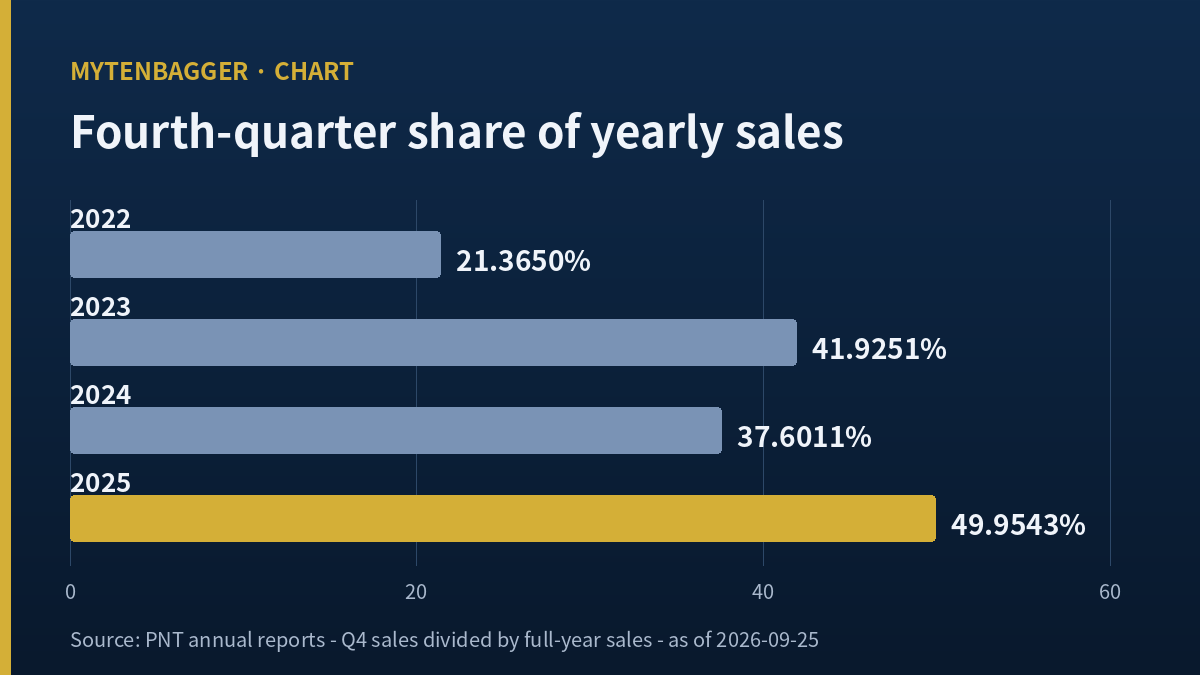
Discrete quarterly sales at this company land heavily in the December quarter. In 2025, Q4 sales of 372.104 billion won were 49.9543 percent of the full-year 744.889 billion won. Close to 50 percent of a year arrived inside three months. In 2024, Q4 sales of 389.202 billion won were 37.6011 percent of the full-year 1,035.081 billion won. In 2023, Q4 sales of 228.665 billion won were 41.9251 percent of 545.413 billion won. Only 2022 was flat, with Q4 sales of 89.266 billion won at 21.3650 percent of 417.814 billion won.
That concentration passes straight into the turnover series. Put a fixed balance over a quarter that carried almost 50 percent of the year and it reads as six months of stock. Put the same balance over a quarter that carried a tenth of the year and it reads as two years. Q1 2026 sales of 101.441 billion won were 46.3168 percent of first-half sales of 219.015 billion won, so that quarter was not even unusually small within its own six months, yet 372.104 / 101.441 = 3.6683 times larger sits on the other side of the comparison. The arithmetic behaved correctly throughout. I was the one about to read its output as a property of the warehouse.
For completeness, there is a second construction. Take the 2025 closing inventory of 759.810 billion won, divide it into full-year 2025 sales of 744.889 billion won, and multiply by 365, and you get 372.31 days. That lands near the middle of the 185.82 to 956.78 band. I am not arguing that one construction is correct and the other is wrong. My claim is narrower: at this company, a days-of-inventory figure published without naming its construction carries almost no information.
The same line can run the other way, too. In a recent entry I watched Seegene release 82.698 billion won of inventory and fund a large share of its operating cash with the drawdown. This company sits on the opposite side of that trade: it is adding to the line while booking orders. Same row on the balance sheet, opposite direction of travel.
What PNT stock’s first half of 2026 actually reports
Setting the warehouse aside, here is the profit and loss. Cumulative first-half 2026 revenue was 219.015 billion won, operating profit 12.484 billion won, and net profit 27.105 billion won. Against the same six months of 2025, revenue fell 17.4298 percent from 265.247 billion won and operating profit fell 66.2284 percent from 36.966 billion won. Net profit rose 51.8743 percent from 17.847 billion won, but that increase came from outside operations, so I am leaving it alone in this entry.
On a discrete quarterly basis, Q2 2026 revenue of 117.574 billion won carried operating profit of 3.697 billion won, an operating margin of 3.1444 percent. Q1 2026 revenue of 101.441 billion won carried 8.787 billion won, a margin of 8.6622 percent. The margin fell in the quarter where sales rose. Against the Korean press, Newspim reported on August 12, 2026 second-quarter revenue of 117.6 billion won, operating profit of 3.7 billion won, and net profit of 7.0 billion won, with first-half totals of 219.0, 12.5 and 27.1 billion won. Every one of those matched what I pulled from the filings within rounding. In the same report the company said its Chinese copper foil subsidiary booked roughly 20 billion won of revenue in the quarter and that the order backlog had grown from the first quarter.
Widen to full years and 2025 is where the business bent. Revenue of 744.889 billion won was 28.0357 percent below 2024’s 1,035.081 billion won, and operating profit of 95.648 billion won was 41.4022 percent below 2024’s 163.228 billion won. Leverage moved the other way. The debt-to-equity ratio fell from 366.5160 percent at the end of 2022 to 146.0770 percent at the end of 2025, and at June 30, 2026 liabilities of 1,261.425 billion won over equity of 742.176 billion won give 169.9613 percent.
Two screens swapped the close and the market value of PNT stock
The price took four looks to settle. The confirmed daily series records a September 23, 2026 close of 28,800 won, with an open of 29,000, a high of 29,200, a low of 28,500, volume of 58,278 shares, and a regular-session scope. Alphasquare also shows 28,800 won. Chickstock shows 28,750 won for the same date, and 28,750 is the confirmed close for September 22.
So I took the multiples each screen published and ran them back through a divisor I built myself. Chickstock’s market value of 682.3 billion won over the share count of 23,690,972 gives 28,800.03 won. Its price-to-earnings figure of 9.42 closes the same way: 28,800 / 3,056 = 9.4241, using its own per-share earnings of 3,056 won. The screen that wrote 28,750 in its price field built both its market value and its multiple from 28,800. Alphasquare did the reverse. It wrote 28,800 in the price field and 681.1 billion won as market value, and 28,750 x 23,690,972 = 681.115 billion won. The two screens traded their close and their market value with each other.
Two independent sources print the string 28,800 and the confirmed series agrees, so this entry uses 28,800 won, which is USD 21.20 at 1,358.4 won to the dollar, the September 23, 2026 daytime close in the Seoul foreign exchange market as reported by Money Today on September 23, 2026. Market capitalization on that basis is 682.300 billion won, about USD 502.3 million.
The prior close nobody can locate
There is one more split, and this one I could not resolve. The confirmed series puts the September 22 close at 28,750 won, which makes the September 23 move 50 won, or 0.1739 percent. Alphasquare shows a prior close of 28,650 and a gain of 150 won. Chickstock shows a prior close of 28,650 and a gain of 100 won. The 28,650 the two screens share does not appear among the last seven confirmed closes, which run 29,400, 28,950, 28,800, 29,000, 29,200, 28,750 and 28,800 won. Each screen is internally consistent with its own prior close and neither prior close is in the tape. I do not know why, and because of that this entry keeps daily percentage moves out of its argument.
A Canadian filer puts the same work under a different name
I am using exactly one peer here, and I am comparing exactly one thing: the name. ATS Corporation (NYSE and TSX: ATS) designs and builds custom automation systems to customer order, with a fiscal year ending March 31. I did not pick it for size or for valuation. I picked it because of what its statements call work that is still being built.
The ATS consolidated balance sheet lists its current assets in this order: Cash and cash equivalents, Accounts receivable, Income tax receivable, Contract assets, Inventories, and Deposits, prepaids and other assets. Orders in progress carry a second name of their own. At March 31, 2025, contract assets of 503,552 thousand Canadian dollars were 1.5728 times inventories of 320,172 thousand. At June 29, 2025 the two were 560,321 and 310,459 thousand, a multiple of 1.8048. The larger portion of work in progress does not travel under the word inventory at all. For reference, the same filer’s trailing inventory of 304.86 million Canadian dollars is 7.1162 percent of total assets of 4,284 million.
That is where I stop. I have put no revenue, no earnings, no multiple and no market value of either company beside the other, and I am not going to. The fiscal years end in different months, the reporting currencies differ, and the comparison would not hold. What I verified is a naming choice. One filer splits the same stage of work across two rows; the other reports it in one. I tried to open the Korean company’s inventory note to see how its 817.177 billion won divides into finished goods, work in process and raw materials, and the filing viewer I needed was closed to me. So I could not separate machines that are sold from machines that are not. That is the weakest ground in this entry and I would rather name it than bury it.
Naming has changed the character of a number for me once before. When I looked at which of two companies carries the stock that a licensing partner never buys, the same physical object was recorded in two different places by two different sets of books, and the margins tracked the recording instead of the object itself.
One named analyst covers PNT stock and he models this balance higher
The coverage gap comes first. After working through the available research I found one named sell-side author: Park Jun-seo of Mirae Asset Securities. There are two notes. The August 13, 2025 version carried a valuation of 53,000 won with 2026 revenue of 1,167.0 billion won. The February 27, 2026 version carried 70,000 won with 2026 revenue of 948.6 billion won and operating profit of 123.5 billion won. The same author raised the valuation and cut that year’s revenue estimate by 218.4 billion won within about six and a half months. Biztribune restated the February note on March 3, 2026, but the underlying source is the same, so I do not treat it as a second opinion. On the aggregate side, Hankyung shows a 66,000 won consensus valuation as of September 11, 2026, without telling me how many contributors that average holds. I could not reach two named houses, so the forward view in this entry rests on one.
That one opinion contradicts my reading directly. The February note models inventory at 853 billion won for 2026 and 1,034 billion won for 2027. The August 2025 note modeled it higher still, at 1,068 billion won for 2026 and 1,294 billion won for 2027. The sell-side does not treat rising stock at this company as a warning signal. It treats orders as the driver, work in progress as what orders look like before delivery, and the inventory line as where work in progress is recorded. Backlog was described as “roughly 1.5 trillion won” in the February note and as 1.68 trillion won at the end of Q2 2025 in the earlier one.
Four ways this reading of PNT stock could be wrong
- [The sell-side] The only named estimate on file carries inventory up to 1,034 billion won by 2027. The line I called large is, in that model, the evidence of growth.
- [The company] Copper foil in China contributed roughly 20 billion won of revenue for the first time in the second quarter, and management said backlog rose from the first quarter. If stock is starting to convert into sales, the turnover arithmetic in this entry goes stale quickly.
- [Me] I never opened the inventory note. I treated 817.177 billion won as one substance without knowing how it divides into finished machines, work in process and raw material.
- [The data vendor] Part of the spread is my own doing. Using annual sales underneath instead converges on a single 372.31 days for 2025, and the 3.6683 times I built does not appear.
Where I stand on PNT stock and what would end that stance
No shares, no order, watching. Market capitalization of 682.300 billion won, roughly USD 502.3 million, puts this below the size band where I am willing to write a buying stance, and nothing in this entry argues for one. The September 23, 2026 close of 28,800 won sits 2.2071 percent under the 20-day average of 29,450, 5.1477 percent under the 60-day average of 30,363, and 26.2711 percent under the 120-day average of 39,062. Against the 250-session high of 62,000 won it is 53.5484 percent lower, and against the low of 23,000 won it is 25.2174 percent higher.
I am not using a price-to-book multiple, because book value per share splits four ways. Alphasquare shows 21,027.39 won, my vendor shows 27,402 won, Chickstock shows 29,246 won, and dividing the June 30, 2026 controlling interest of 735.867 billion won by 23,690,972 shares gives my own 31,061.07 won. Dividing 28,800 by each returns 1.3696x, 1.0510x, 0.9848x and 0.9272x, so whether this trades above or below book flips with the source. I did identify one of the four. Chickstock’s 29,246 matches the 29,245.57 won I get from the December 31, 2025 controlling interest of 692.856 billion won over the current share total, to the rounding. The other two I could not attribute, so their multiples stay out of the argument.
Two markers would move me, in either direction:
- The inventory balance in the Q3 2026 filing, statutorily due November 15, 2026. Below 817.177 billion won and the conversion story management tells is visible in the accounts. Above it and the sell-side model of 853 billion won for the year is the better description.
- Whether Q4 2026 discrete sales clear the 372.104 billion won of Q4 2025. If they do, the turnover spread widens again. If they do not, the spread narrows and the meaning of the remaining balance changes with it.
The sentence in this entry most likely to break, and what I left out
I want to name the sentence that will fail first, while I can still be specific about it. It is this one: the spread was made by the fourth quarter of 2025 and not by the inventory line.
That sentence assumes the 372.104 billion won of Q4 2025 is a normal December quarter for this company. If the assumption holds, a similar share arrives in Q4 2026, and the turnover spread reopens in the same place every year. But Q4 2022 brought 89.266 billion won, or 21.3650 percent of that year’s 417.814 billion won. One year in four was flat. If Q4 2026 comes in flat as well, then what I have been calling a seasonal structure is really a feature of three particular years, and I will have to say something different while looking at the same table.
In that case exactly one claim from this entry survives: a days-of-inventory figure published without naming its construction carries almost no information at this company. That holds whether the December quarter is large or small, which is why it is the part I would defend.
Numbers I checked and deliberately left out. The four-year sum of net profit and the four-year sum of free cash flow come out nearly equal in size with opposite signs; the divergence of profit and cash has been worked over repeatedly in this journal lately, so I did not build on it here. Depreciation and EBITDA are absent from the filed statements and from the vendor feed, so I wrote neither. I dropped the vendor’s price-to-earnings ratio because its per-share earnings field is derived by dividing price by that same ratio, which is circular; in its place, trailing four-quarter profit attributable to controlling holders of 83.296 billion won over 23,690,972 shares gives 3,515.94 won per share, and 28,800 over that is 8.1913x.
One vendor note is worth passing on. The fields labeled trailing four quarters on my screen, at 744.9 billion won of revenue, 95.6 billion of operating profit and 69.5 billion of net profit, are precisely the full-year 2025 figures of 744.889, 95.648 and 69.517 billion won. The label and the contents disagree. Adding the four most recent discrete quarters gives revenue of 698.657 billion won and operating profit of 71.166 billion won, so 71.166 / 698.657 = 10.1861 percent is the operating margin for that window, against the 12.83 percent the screen prints, a gap of 2.6439 percentage points. Both sit above 5 percent, so no characterization of this business flips on it. Still, anyone building multiples from that feed should add the quarterly series by hand instead of trusting the label.
There were no share-count events. I found no bonus issue, no split, no rights offering, no retirement of treasury shares and no capital reduction in the last six months or on the near calendar, and the vendor’s split flag is off. The share total itself does split, though: my vendor reports 23,690,972 shares and Alphasquare reports 23,690,728, a difference of 244. Every per-share figure in this entry uses 23,690,972.
Basis of figures: price and screen indicators are Kiwoom data as of the September 23, 2026 close. Financials are DART annual and semi-annual filings on a consolidated basis, 2022 through Q2 2026. Turnover days, shares, multiples and growth rates are my own calculations, with each formula written into the text above. The USD/KRW rate is 1,358.4, the daytime close in the Seoul foreign exchange market on 2026-09-23 (rate date: 2026-09-23), and every dollar figure here is converted at that one rate.
Related reading
- Unison Wind Leverage: Korean Turbine Maker vs Vestas and Nordex
- Why Pearl Abyss Cut Its 2026 Guidance and What It Leaves Out