POSCO Steelion Operating Leverage: Profit Moved 5.85x Revenue
- POSCO Steelion stock closed at 4,510 won on September 23, 2026. I own none of it and I have no order in.
- Revenue moved very little across five years: 1,347.27 billion won down to 1,125.44 billion, a spread of 1.20 times.
- Gross profit moved a lot: 185.71 billion won down to 68.37 billion, a spread of 2.72 times.
- Operating income moved most: 143.06 billion won down to 24.46 billion, a spread of 5.85 times.
- Subtract the third from the second and you get a row no filing publishes: 42.65 / 38.15 / 52.03 / 47.44 / 43.91 billion won.
- That built row moved 1.36 times. It is the flattest line in the whole picture, and that flatness is what turns a 2.72 into a 5.85.
- I am watching and I am staying out. What I could not settle is whether that flat row is a choice the company makes or a floor it cannot go under.
There is a row between gross profit and operating income that POSCO Steelion stock is priced on and that no table I could reach prints as a line of its own. Korean practice calls it selling and administrative expense. I made it with a subtraction, five years in a row, and it came out at 42.65 / 38.15 / 52.03 / 47.44 / 43.91 billion won.
I want to be exact about what I did, because the whole piece rests on it. Investing.com publishes total revenue, gross profit, operating income and net income for this company by year. It does not publish the cost line between the second and the third. So I took gross profit and took operating income away from it. If both inputs are right, the result is right, and the result closes: my row plus operating income equals gross profit in all five years to the last reported digit.
KOSPI, for anyone who has not met it, is Korea’s main board, roughly what the S&P 500 is to a US reader. POSCO Steelion sits at number 431 of 942 names on it by market value, which is 270.6 billion won or about $199 million at 1,358.4 won per dollar. It coats steel sheet: galvanized and color coated product, made from substrate it buys from POSCO, which is its controlling shareholder.
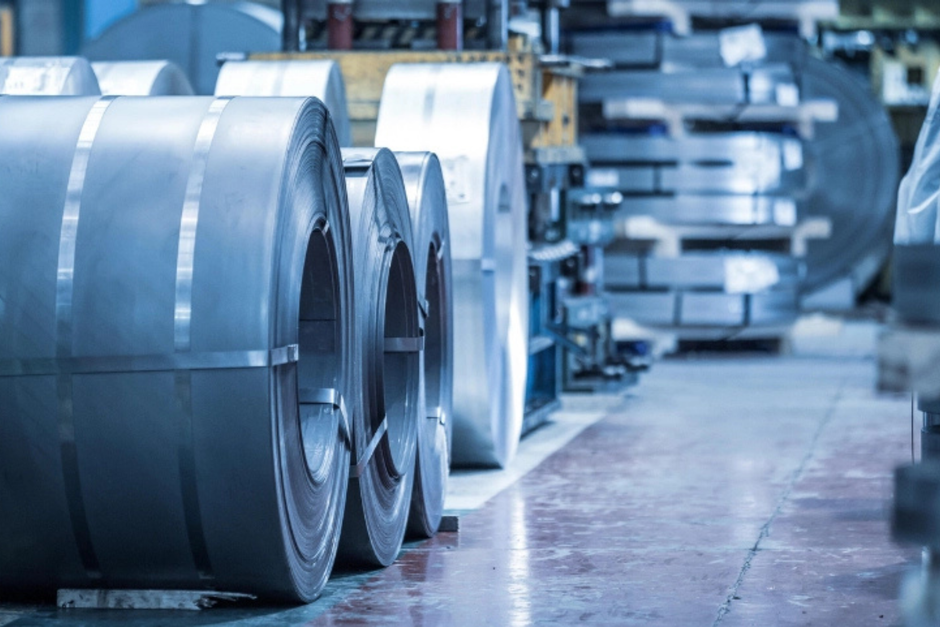
For a US reader the business matters more than the ticker. This is not a mill and it melts nothing. It takes cold rolled coil from its parent, runs it through galvanizing and painting lines, and ships sheet that ends up in building panels, appliance housings and car interior parts. The closest American analogue is a coil coating service center, and it is neither a Nucor nor a Cleveland-Cliffs. The input price is set by someone else, the value added is a coating, and the profit is the spread between the two. That is why gross profit is the line to watch here, and why 6.075% of revenue in 2025 is a real number and no rounding accident. The closest listed peer on the same board runs the same coat-and-ship model without a steelmaking parent above it, and I read its half-year numbers in Korea’s KG Steel Earnings: Sales Grew but Profit Fell by a Third.
Contents
Five years of revenue behind POSCO Steelion stock
Here is what I read, in billions of won, for years ending December.
| Row | 2021 | 2022 | 2023 | 2024 | 2025 |
|---|---|---|---|---|---|
| Total revenue | 1,347.27 | 1,202.12 | 1,158.54 | 1,209.86 | 1,125.44 |
| Gross profit | 185.71 | 76.37 | 82.66 | 99.37 | 68.37 |
| My subtraction | 42.65 | 38.15 | 52.03 | 47.44 | 43.91 |
| Operating income | 143.06 | 38.22 | 30.63 | 51.92 | 24.46 |
| Net income | 102.42 | 22.71 | 24.77 | 34.26 | 17.04 |
Source: Investing.com annual table for every row except the third, which is my own subtraction of operating income from gross profit. Billions of won, December year ends, figures rounded as published. The third row is subtracted from the unrounded figures. Subtract the rounded numbers printed above it and 2024 comes out at 47.45 against the 47.44 shown; that is the only year the two differ.
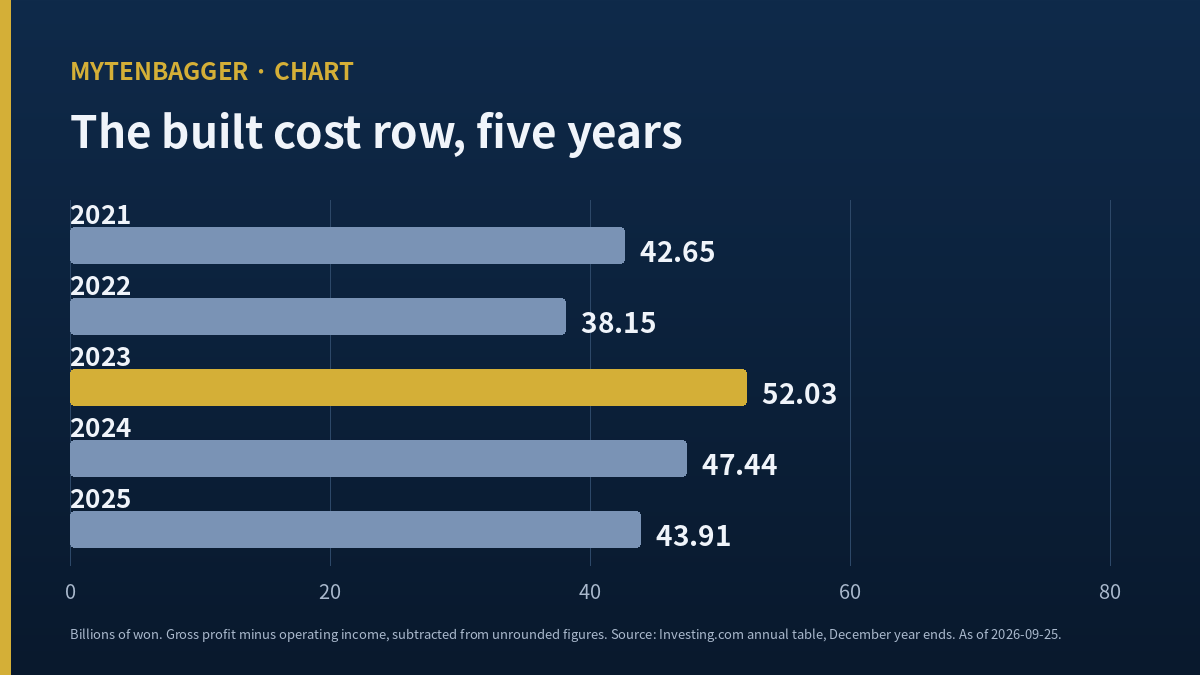
Read the table from the top down and the story is about one line holding still while the lines above and below it swing. Revenue fell 16.47% from 2021 to 2025. Gross profit fell 63.19%. My subtraction changed by less than a tenth of gross profit’s change.
The row that no filing carries
Two of the four lines in that table are published. The third is not, and the fourth is what is left after the third comes off. So the question here is narrow: can I make the missing line reliably, and how would I know if I had made it wrong.
The subtraction I did myself
I checked my row two ways before I leaned on it. First, it has to be positive in every year, because operating income cannot exceed gross profit for a manufacturer with real selling costs. It was: 42.65, 38.15, 52.03, 47.44, 43.91. Second, it has to be plausible as a share of revenue for a company that sells industrial sheet to fabricators and not to households. As a share of revenue it was 3.166 / 3.173 / 4.491 / 3.921 / 3.901%, which is small and stable, and that is what a business with a short customer list and no retail spending looks like.
What I could not do is confirm the row against the company’s own filing. Korea’s disclosure portal blocks automated reading from where I work, so the audited selling and administrative expense line stayed out of reach. Everywhere these figures appear I call them a subtraction, and I never call them a quotation.
Here is the part I keep coming back to. The spread between the largest and smallest value of my row is 1.36 times. For gross profit it is 2.72 times. For operating income it is 5.85 times. For revenue it is 1.20 times. Line those four up and the arithmetic of this business is visible without any opinion attached to it: the top barely moves, the cost line barely moves, and everything the top does to the second line lands undiluted on the third.
Why POSCO Steelion stock moved 5.85 times while revenue moved 1.20
Take 2021 against 2025, the best year and the worst. Revenue was 1,347.27 billion won then and 1,125.44 billion now, so 221.83 billion won of sales left. Gross profit was 185.71 billion and is 68.37 billion, so 117.34 billion of it left. Of every 1,000 won of revenue that disappeared, 529 won of gross profit disappeared with it.
That is a hard number to sit with. It says the sales that went away were carrying more than half their value as profit, which for a coating business means they were priced well above the cost of the substrate underneath them. When that pricing left, almost nothing cushioned it, because my row did not fall to meet it. My row went from 42.65 to 43.91 billion won across the same five years. It went up.
So the share of gross profit that my row consumes tells the whole arc: 22.97% in 2021, then 49.95, 62.94, 47.75 and 64.22% in 2025. In the good year, a little under a quarter of the gross was spent before operating income was struck. In the most recent year, nearly two thirds of it was.
Take just the last step, 2024 into 2025. Gross profit fell 31.00 billion won. My row fell 3.53 billion. Operating income fell 27.46 billion, and 31.00 less 3.53 is 27.47, the same figure to a rounding. One year of this company can be written as a single subtraction, and the cost line contributed roughly a ninth of the movement.
I looked at a Korean mill earlier this year where the division that earned the quarter was not the division the next quarter’s case rested on. That question was about which plant produced the profit. This one is about what sits between two printed lines and never moves.
Fixed cost, and what POSCO Steelion stock pays for it
A cost that will not move with sales is the oldest reason a cyclical company swings harder than the market it sells into. Here I can put a figure on that cost, because the line I built behaves almost exactly like one.
Three point nine percent of revenue, four years running
As a share of revenue my row reads 3.166 / 3.173 / 4.491 / 3.921 / 3.901%. Four of the five years land between 3.17 and 3.92. Only 2023 breaks out, at 4.491%, and 2023 is also the year operating income was lowest in the pre-2025 part of the record, at 30.63 billion won. Those two facts are the same fact seen twice.
What I take from this is an operating rule, and no part of it is a valuation. If my row will not go below roughly 3.9% of revenue, then at 1,125 billion won of sales the company spends about 43.9 billion won before it can report an operating profit, and it needs gross profit above that figure just to avoid a loss. In 2025 gross profit was 68.37 billion, so the cover was 24.46 billion, which is the operating income. The cover is thinner than any single year of gross profit swing in this record.
2023 deserves its own paragraph, because it is the one year that breaks the pattern in both directions at once. My row was 52.03 billion won that year, the highest of the five, and 4.491% of revenue, also the highest. Operating income was 30.63 billion, which was then the lowest in the record. Gross profit, meanwhile, was 82.66 billion, above 2022’s 76.37 billion. A better gross year produced a worse operating year, and the only thing standing between the two is the line I built. I cannot say what the extra 13.88 billion won over 2022 went on, because that detail lives in the audited note I could not open. What I can say is that the year the cost line moved is the year this mechanism showed itself most plainly.
That is the case for watching and for staying out. The company does not need to lose sales to lose all of its operating profit. It needs gross profit to fall by 36% from where it is, which it did between 2024 and 2025 already, when gross profit went from 99.37 to 68.37 billion won, a fall of 31.2%.
Two paths follow from that, and the arithmetic differs enough to be worth writing down. If the duty holds and gross profit returns to the 2024 figure of 99.37 billion won, my row at 3.9% of a similar revenue level takes about 43.9 billion and operating income lands near 55.5 billion, more than double 2025. If the duty lapses and gross profit slides back toward 68 billion, my row takes the same 43.9 billion and operating income returns to the mid twenties. The company’s outcome swings by a factor of two while the line I built does not move at all. That is the mechanism written as a forecast, and I am declining to forecast which path runs.
What 2026 changed for POSCO Steelion stock
Everything above stops at December 2025. Two quarters of 2026 exist and they point the other way, so I have to be clear about how much of them I can actually use and on what reporting scope.
Two sets of figures for the same quarter
On July 30, 2026 the company filed provisional second quarter results twice, once on a group reporting basis and once for the parent company alone. I could read the parent version in full: revenue 293.2 billion won, operating income 9.2 billion, net income 6.7 billion, with revenue up 5.8% and operating income up 114.0% against the same quarter of 2025. Revenue for the opening six months on that basis was 567.3 billion won.
The group version reached me through a brokerage note and never through the filing itself, and the figures differ: revenue 298.2 billion won and operating income 9.6 billion, with operating income up 74%. Same quarter, same company, two reporting scopes, two growth percentages. I have used the parent numbers where I quote a quarter and I have flagged the group numbers as coming from the note, and I have not mixed them inside a single comparison.
There is a reason the quarter improved. Korea put import duties on Chinese coated product, and the imported share of the domestic market fell from 22% in May 2026 to 6% in June. Domestic sales volume rose 12% in the quarter to 93,000 tonnes while exports slipped 2% to 100,000 tonnes. So volume was roughly flat at 193,000 tonnes in total and the gain came from what each tonne fetched at home.
Volume gives me one more thing to hold. On the group scope that quarter’s 298.2 billion won of revenue came out of 193,000 tonnes, which is 1.545 million won a tonne, or about $1,138 at the September conversion used here. I could not check that against a published price series for Korean color coated sheet, so I am treating it only as a size marker: this is product selling for roughly a dollar a kilogram, and a duty that lifts the domestic price by a few percent of that moves gross profit by much more than it moves revenue.
The comparison quarter can be recovered from the percentages in the filing itself. Revenue up 5.8% on 293.2 billion won puts the same quarter of 2025 at 277.1 billion. Operating income up 114.0% on 9.2 billion puts it at 4.3 billion. A year ago this company turned 277.1 billion won of sales into 4.3 billion of operating income, which is 1.55% of revenue. The same quarter this year produced 3.138%. Both figures sit under the five year record and both sit above zero, and my row would have been taking its 3.9% out of the middle in each of them.
Two quarters of 2026 do not settle a five year mechanism, and I have been in this position before. In August I looked at a Korean pipe maker where operating cash went negative while operating profit stayed positive, and the following six months turned the sign back without settling the question. I am treating this company’s good quarter the same way: one observation on a line that needs four more.
That is the first thing in five years to lift gross profit ahead of revenue, and gross profit is the line my row eats. It is also the thing I cannot size, because I have no quarterly split of my own row and the company does not publish one.
A named valuation on POSCO Steelion stock, and only one
There is one sell side opinion on this company that I could trace to a named analyst at a named house. There is also one fact about the Korean market that I read too lightly the first time. Both belong in this section, because the second is the reason the first exists.
An import share
An import share falling from 22% to 6% in one month is the kind of fact I used to file under news and move past. I did that here too, at first. Then I noticed what it does to the arithmetic above: a duty that removes a competitor adds no revenue at all; what it adds is price, and price lands on gross profit with nothing in between. My row would not have caught it either way, since my row is a cost the company chooses and not a cost the market sets. Correction I am writing down: when a trade measure shows up in a company I am reading, I now put it against the second line of the yearly figures before I put it against the first.
On the sell side I found exactly one named house. Hyundai Motor Securities, in a note dated September 4, 2026 by analyst Park Hyun-wook, carried a Buy opinion and a 6,180 won valuation, against a close of 4,635 won that day. The note carries 2026 estimates of revenue of 1,202.0 billion won and operating income of 34.0 billion, with 18.6 billion of that operating income in the closing six months, 17% more than the opening six. Reading backwards from that 17%, the opening six months on the note’s group scope is 159.0 billion won divided by ten, or 15.9 billion, which matches 6.3 plus 9.6 from the two quarters above.
I have printed the 6,180 won because it exists and because the calculation behind it is easy to follow. It does not enter my read, and the reason is arithmetical, with no scepticism in it: one house is not an average of houses. There is nothing to take a mean of, so I cannot call it a consensus, and I also cannot call this name uncovered. This is a single point of view, correctly attributed, and I have left it as one.
What the note does give me is something to test my own row against. Estimated 2026 revenue of 1,202.0 billion won is 89.2% of 2021 revenue. Estimated 2026 operating income of 34.0 billion won is 23.8% of 2021 operating income. The asymmetry the note carries into next year is the same asymmetry my subtraction explains in the years behind it.
BlueScope Steel, and the only row I compared
A Korean coater is hard to place for anyone who has never bought a tonne of galvanized sheet. So I went looking for the company a US or Australian investor would already recognize, and then I deliberately compared almost nothing.
Same product family, eight times apart
I picked BlueScope Steel Limited of Australia, listed on the ASX under BSL, for one reason and one reason only. It is the company that put its own names on coated sheet, COLORBOND and ZINCALUME, and got the market to ask for the name. That is the question I wanted a mirror for: is the Korean company the one whose name is on the product, or the one that coats substrate somebody else made and sells it as sheet.
So I built the same row for BlueScope, the same way, from its published gross profit and EBIT, and I compared nothing else. No market value beside market value, no multiple beside multiple, no per tonne figure. Just my row as a share of revenue, because that is the only thing I made identically on both sides.
For the three fiscal years ending June, BlueScope’s version of my row is 31.73%, 32.76% and 33.08% of revenue. POSCO Steelion’s most recent is 3.901%. The two figures are 8.48 times apart.
I do not think that gap measures efficiency, and I want to say so plainly before the number implies it for me. A company that runs its own steelmaking, its own retail brands and a US mini mill carries selling and distribution costs a coating line does not have, and it books a much larger gross profit to carry them against: BlueScope’s gross profit is around 39% of revenue and POSCO Steelion’s is 6.075%. What the 8.48 times actually tells me is that these two are not doing the same job, and that the Australian company’s cost line is a brand, while the Korean company’s cost line is a sales office. That is the comparison, and it ends there. Different fiscal calendars would have stopped me anyway.
Eight things I cannot pin on POSCO Steelion stock
- My central row is a subtraction of two published figures and never a quoted line. If either input is restated, all five of my values move.
- I never opened the audited selling and administrative expense line. The portal that holds it blocks automated reading, so my naming of the row is an inference from Korean reporting practice.
- 2021 is the pivot year of every comparison here, and it is the one year where two sources publish different operating income: 143.06 billion won in one and 143.28 billion in another, 0.22 billion apart. The rest of the years agree exactly.
- A flat cost row can mean discipline or it can mean a floor nobody can cut through. Five annual figures cannot tell those two apart, and I did not pretend otherwise.
- The 2026 improvement rests on an import duty. Trade measures are decided outside the company, and I have no view on how long this one lasts.
- The second quarter exists under two reporting scopes with growth of 114.0% and 74%. Anyone who strings my five year table together with a 2026 quarter is joining two different scopes.
- Only one named house publishes estimates. Everything forward looking in this piece traces to that single note.
- POSCO controls the company and also sells it the substrate it coats. How that substrate is priced sits in a related party note I could not open, and it is upstream of every gross profit figure above.
Nine conditions that end my read of POSCO Steelion stock
These are the things that would make me rewrite the piece. I have not weighted them, because I have not followed this company long enough to know which one answers first.
- My row rises above 4.5% of revenue in a full year, which would say the flatness was never a floor.
- My row falls below 3.5% of revenue, which would say the company can cut where I assumed it could not.
- Gross profit for 2026 lands below 68.37 billion won despite the duty, which would mean price did not reach the second line.
- Gross profit clears 99.37 billion won, the 2024 figure, which would put the cover back above two times my row.
- The audited selling and administrative expense line, when I finally read it, differs from my subtraction by more than 5%.
- The import share climbs back above 15%, undoing the quarter this year turned on.
- Domestic volume falls below 80,000 tonnes in a quarter, which would say the duty moved price without moving demand.
- A second named house publishes estimates and lands materially away from 34.0 billion won of 2026 operating income.
- The related party note shows substrate pricing set on a formula I can model, which would let me replace my inference with a calculation.
One number I will build again
I hold none of this company and I have placed no order. Five years of figures told me the top line barely moved, the cost line between the top and the bottom barely moved, and the bottom moved 5.85 times because of it. That is a clean mechanism. What it does not tell me is whether the flat line is a decision or a limit, and I am not willing to own a cyclical coater on a mechanism I understand only in part.
So I am fixing the condition that reopens this on a single figure I can make myself. When the 2026 full year figures appear, I will take gross profit, take operating income away from it, divide by revenue, and look at where it lands against 3.901%. Above 4.5% and the flatness was an accident. Below 3.5% and I was wrong about the floor. Between them and the mechanism holds, and the question moves back up to gross profit where the duty is doing its work.
No one has to publish that figure for me to have it. Both inputs are already in the annual table I used above, and the subtraction is mine. The number that has to move before I change my mind is 3.901% of revenue, and I will know it the day those figures land.
Prices and share data reflect the September 23, 2026 close. The Seoul market did not trade on September 24 and 25 for the Chuseok holiday, and the next session is September 28. Dollar figures are approximate, converted at roughly 1,358.4 won per dollar on that same date, per Money Today and Steel and Metal News. Won figures are rounded as published. Other sources used: the July 30 provisional filing, Financial News on the September 4 brokerage note, and BlueScope Steel annual figures.
Related reading