Korea’s KG Steel Earnings: Sales Grew but Profit Fell by a Third
KRW 31.8 billion. Before anything else about KG Steel stock, hold that number. It is the earnings benefit the company itself attributed to shifting sales toward exports in the second quarter of 2026, set against the same quarter a year earlier.
Now the other side of it. The second quarter’s operating profit rose 16.86 percent year on year, from KRW 43.1 billion reported this year against KRW 36.88 billion I calculated for last year. The increase is KRW 6.22 billion. The company’s stated benefit is 5.11 times that increase. Either the explanation and the profit line are measuring different things, or something else inside the quarter went the other way by roughly the difference. I could not determine which, and KG Steel stock is where I am writing that down.
- While half-year revenue rose 5.2 percent, half-year operating profit fell 36.7 percent.
- Because the second quarter rose on both lines, the entire decline has to sit in the first quarter, and my arithmetic puts it at about 67 percent.
- Until the third-quarter filing lands, I have one improving quarter and one collapsed quarter, which is not yet a direction.

Contents
What the first half of 2026 did to KG Steel stock
The disclosed half-year figures are straightforward. Revenue of KRW 1,701.7 billion, up 5.2 percent. Operating profit of KRW 64.6 billion, down 36.7 percent. A steel maker that sold more and earned much less.
The quarterly figures are also disclosed, and they do not behave the same way. Second-quarter revenue was KRW 896.4 billion, up 11.34 percent. Second-quarter operating profit was KRW 43.1 billion, up 16.86 percent. Both lines rose, and profit rose faster.
Those two statements cannot both describe the same six months unless the first quarter was very bad. So I went and rebuilt the first quarter.
Rebuilding the quarter nobody quoted
From the half-year change I can work back to last year’s half. Revenue of KRW 1,701.7 billion divided by 1.052 gives KRW 1,617.59 billion. Operating profit of KRW 64.6 billion divided by 0.633 gives KRW 102.05 billion. Both are my calculation, and both inherit the rounding in the disclosed percentages.
From the second-quarter change I can work back to last year’s second quarter. Revenue of KRW 896.4 billion divided by 1.1134 gives KRW 805.10 billion. Operating profit of KRW 43.1 billion divided by 1.1686 gives KRW 36.88 billion.
Subtracting leaves last year’s first quarter: revenue of about KRW 812.49 billion and operating profit of about KRW 65.17 billion. This year’s first quarter, as reported on 15 May 2026, was revenue of KRW 805.3 billion and operating profit of KRW 21.5 billion.
Revenue therefore moved by 0.88 percent. Operating profit moved by 67.01 percent. Both are my calculation. A reported 0.9 percent revenue decline in the first quarter sat on top of a two-thirds collapse in first-quarter operating profit, and the half-year headline of 5.2 percent revenue growth hides it completely.
The company’s own number for the improvement
Back to KRW 31.8 billion. The company framed it as the profit improvement that came from redirecting volume into exports while global steel demand stayed weak, set against the same quarter last year. Korean press carried that figure directly from the earnings release.
The second-quarter operating profit increase I calculated is KRW 6.22 billion. The stated benefit is 5.11 times larger. There are three readings and I hold all of them open.
- The stated benefit may be gross, sitting before costs that moved against it in the same quarter.
- It may cover a different span or a different profit line than the consolidated operating figure.
- It may be accurate and complete, in which case the underlying business outside the export shift deteriorated by roughly KRW 25.6 billion year on year.
The third reading is the one that would matter most to a holder, and it is the one I have the least evidence for. I am recording the size of the gap and declining to pick.
What the export mix actually did
The mix numbers are disclosed and they are genuinely good. Exports reached 53.1 percent of sales in the second quarter, described as the highest share in the company’s history. That compares with 51.7 percent a year earlier and 51.1 percent in the first quarter of 2026. Export volume was 304,000 tonnes. Quarterly sales volume was 573,000 tonnes against production of 576,000 tonnes.
So the shift is real and it sits inside a single accounting period. What I cannot do is convert a 2.0 percentage point move in export share into KRW 31.8 billion of profit without the price and cost assumptions behind it, and those were not published.
Where KG Steel stock’s margin has been for five years
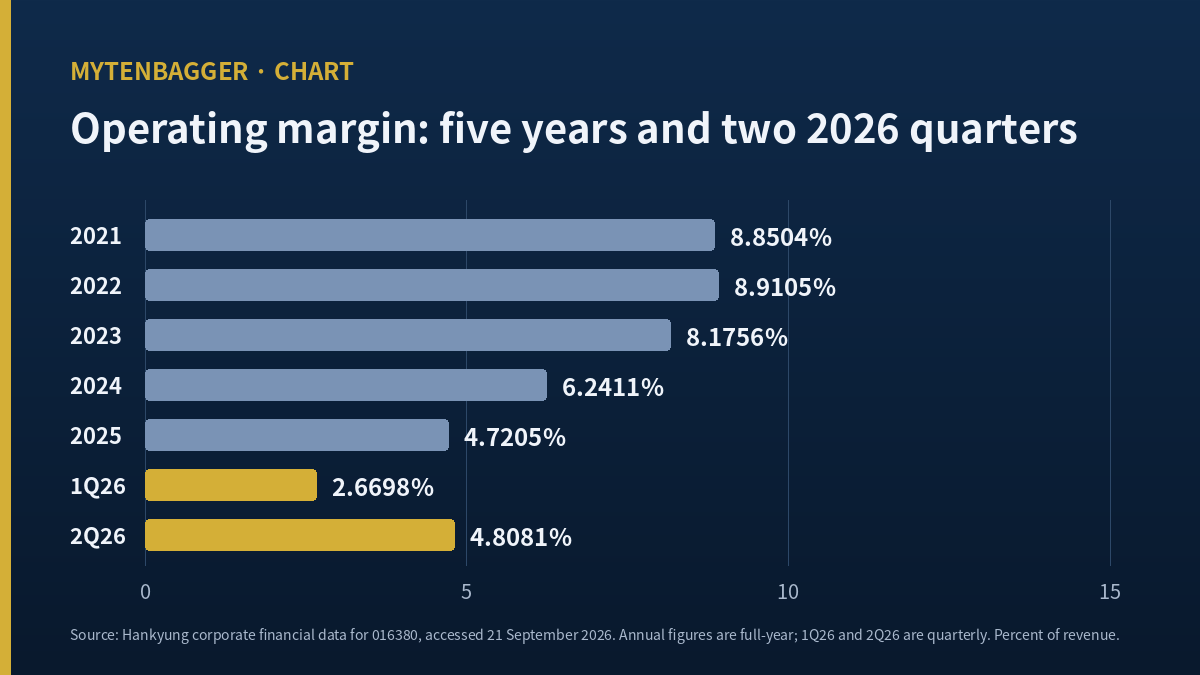
| Year | Revenue (KRW bn) | Operating profit (KRW bn) | Operating margin (%) |
|---|---|---|---|
| 2021 | 3,354.79 | 296.91 | 8.8504 |
| 2022 | 3,819.69 | 340.35 | 8.9105 |
| 2023 | 3,429.85 | 280.41 | 8.1756 |
| 2024 | 3,300.98 | 206.02 | 6.2411 |
| 2025 | 3,193.44 | 150.75 | 4.7205 |
Sources: Hankyung corporate financial data page for 016380, accessed 21 September 2026. Margins are my calculation from the revenue and operating profit columns; they reproduce the printed margin column to two decimals.
Profit moves by a multiple of revenue, every single year
Put the annual changes next to each other. In 2023 revenue fell 10.21 percent and operating profit fell 17.61 percent, a multiple of 1.73. In 2024 revenue fell 3.76 percent and operating profit fell 26.53 percent, a multiple of 7.06. In 2025 revenue fell 3.26 percent and operating profit fell 26.83 percent, a multiple of 8.24. All my calculation.
That is operating leverage doing what operating leverage does, and it got more violent as the margin thinned. The interesting part is the second quarter of 2026: revenue up 11.34 percent, operating profit up 16.86 percent, a multiple of 1.49. The relationship held. Only the sign changed.
Quarterly margins fill in the rest. The first quarter of 2026 ran at 2.6698 percent, the second at 4.8081 percent, the half at 3.7962 percent. All three sit below the 4.7205 percent full-year figure for 2025, which was itself the lowest in the five years above.
How far the top line has already come down
Stack the endpoints of that table. Revenue fell from KRW 3,819.69 billion in 2022 to KRW 3,193.44 billion in 2025, a cumulative decline of 16.40 percent. Operating profit over the same three years fell from KRW 340.35 billion to KRW 150.75 billion, a cumulative decline of 55.71 percent. Both my calculation. Three years of a roughly one sixth revenue contraction took more than half the operating profit with it.
Now push the first half of 2026 out to a full year, purely as an ordering device. Doubling the half-year revenue gives KRW 3,403.4 billion, which would be the first annual increase since 2022 and about 6.57 percent above last year. Doubling the half-year operating profit gives KRW 129.2 billion, about 14.30 percent below last year. I am not forecasting with this. Steel volumes and prices are seasonal and the second half carries a different cost base. What the doubling does show is that the top line and the profit line are currently pointed in different directions on a full-year view, which is the same disagreement the two quarters produced, one layer up.
I have watched an adjacent case where the cash line and the profit line told different stories in the same year, which I wrote up in SeAH Steel and US Tariffs: Cash Flow Went Negative, Profit Held. The lesson I took from that one applies here: when two disclosed series disagree, the disagreement is the finding.
Two further pieces of mine sit near this one for anyone tracing the same ground: POSCO International Dividend: Eight Straight Years Without a Cut for a Korean industrial where the consistent series was the payout, and Poongsan Copper and Tariffs: Inventory Equals 94% of Market Value for one where a single balance sheet line dwarfed the market’s valuation of the whole company.
A footnote I read as a cause
Here is where I got it wrong on the first pass. A footnote in the second-quarter reporting gave the export-shift benefit, and I first wrote it into my notes as the explanation for the quarter’s profit increase. It sat next to the profit line, it was about the same event, and the direction matched. So I treated it as the cause.
It cannot be the cause of a change five times smaller than itself, at least not on its own. What I had done was let adjacency stand in for arithmetic. My correction rule from this one: when a company’s stated effect is larger than the change it is offered to explain, the two are not measuring the same thing, and the honest move is to write both down without choosing.
Three ways the next two quarters can go
The path I weight most heavily (about 40 percent)
The second quarter was the turn, and the third and fourth quarters print margins between the second quarter’s 4.8081 percent and the 2024 full-year level. Full-year operating profit lands above 2025 without approaching the 2022 peak, and the first quarter of 2026 reads afterwards as a trough caused by conditions that had already changed by April.
Where I would be wrong (about 33 percent)
The export shift was a one period effect built on a currency and demand mix that does not repeat. Margins slide back toward the first quarter’s 2.6698 percent, and the multiple of 8.24 from 2025 reappears with a negative sign attached. In that world the second quarter was the exception and not the turn.
The two tails (about 19 percent and about 8 percent)
On the better tail, at about 19 percent, the European subsidiary established in the second quarter and trading from the third turns the export share into a structurally higher one, and margins move past the 2023 level. I have no numbers for that entity yet, so this is an outline and not a forecast. On the worse tail, at about 8 percent, trade measures against Korean coated steel tighten and the export route that carried the second quarter narrows, which would show up first in volume and not in price.
Korea’s larger steel names give a sense of how quickly these swings arrive. I wrote about one of them when a single mill carried a quarter, in Dongkuk Steel Outlook: What the Steel Plate Duty Was Really Worth, where the moving part was a duty and not a currency.
Where I stand on KG Steel stock, and what breaks it
I hold none of this. No order in. KG Steel stock closed at 5,640 won on Monday 21 September 2026, which puts the company at roughly KRW 564.1 billion, or about USD 408.44 million at 1,381.0 won to the dollar on the same date. That is small enough that my default for a name outside the top hundred by value applies, and I do not open a position on a default.
The second reason is specific. One quarter collapsed and the next one climbed back, and the company’s own account of that rebound is several times the size of the rebound itself. I want a third quarter before I decide which of those two quarters was the anomaly.
Six conditions would settle it, ordered by how fast each answers.
- Third-quarter operating margin, due by the 16 November 2026 statutory deadline. Above the second quarter’s level and the turn is confirmed on its own terms.
- Third-quarter export share. If it holds above the second quarter’s 53.1 percent, the mix shift is a policy and not a single quarter’s opportunism.
- The year-on-year operating profit comparison for the third quarter. A second consecutive positive print breaks the four-year pattern of falling annual profit.
- Any restatement of the export-shift benefit. If the company quantifies it again on a comparable basis, the gap I am flagging either closes or becomes a real question.
- Full-year operating profit against 2025. Below KRW 150.75 billion and the second quarter was noise.
- First contribution from the European entity. Its absence from the third-quarter numbers would tell me the export route still runs through the same channels it always did.
Conditions one and three are answered by the same document on the same day, which is why I am content to wait instead of acting on a half year that argues with itself.
Twenty-two ways this reading fails
- Every first-quarter comparative here is mine. The disclosed percentages are rounded, so my calculated figures carry a band and not a point.
- If the half-year decline is nearer 36.5 or 36.9 percent, last year’s first quarter moves and the 67.01 percent shifts with it.
- A 67 percent fall from a small base is less alarming than the same fall from a large one, and the first quarter is seasonally the smaller quarter for this business.
- Last year’s first quarter may itself have been unusually strong, which would make this year’s look worse than the run rate.
- The export-shift benefit may be an internally defined management metric with no direct line to consolidated operating profit.
- Comparing a management metric to a year-on-year change I built myself is comparing two things that were never built to be compared.
- Currency moves affect revenue and cost at the same time, and a gross benefit on one side says nothing about the net.
- The second quarter’s margin of 4.8081 percent is still above the first quarter and above nothing else in the five-year table.
- Operating leverage cuts both ways. If revenue keeps rising at the second quarter’s pace, the multiple works in the holder’s direction.
- Three annual multiples is a very small sample for a claim about how a business behaves.
- The 2022 peak sat on a steel price cycle that has not repeated, so counting the fall from it flatters the fall.
- I did not examine cost of goods sold at all. A margin story without a cost breakdown is half a story.
- Raw material timing can move a quarterly margin by more than an export mix shift does.
- Export share rising while total volume is flat means domestic volume fell, and I did not check whether domestic pricing was the reason.
- Volume of 573,000 tonnes against production of 576,000 tonnes is one quarter’s observation and says little about inventory policy.
- The European entity was announced without being quantified. Treating it as a tail is generous to an entity with no reported numbers.
- Korean trade exposure works in both directions, and a trade action that closes one market can open another for a coated steel exporter.
- Sell-side work on this name is thin and stale, so my read has nothing informed to argue with.
- The company trades below the book value of its assets, and a margin argument does not engage with that at all.
- My price basis is one closing print. Providers disagreed on it, and a different close moves the market value figure.
- The annual figures come from one aggregator’s page and not from the filings themselves.
- The strongest case against this piece is that a company whose profit is rising year on year in its most recent quarter does not need me to reconstruct an old quarter to decide anything.
Numbers I left out, and a closing note on KG Steel stock
A column that does not reconcile to its own row
The annual data page I used prints both a net profit row and a net margin column. They do not agree. Multiply 2023 revenue by the printed 6.86 percent margin and you get about KRW 235.29 billion, while the net profit row on the same table reads KRW 234.35 billion. The same mismatch appears in every year.
I checked it against a second aggregator and against the financial statements approved at the March shareholder meeting, and the pattern is consistent: the margin column is computed on total consolidated net profit while the row above it prints the parent shareholders’ portion. This is a real finding about the source and not about the company, so it stays here and out of the argument.
A quarter where net profit beat operating profit
The first quarter of 2026 reported operating profit of KRW 21.5 billion and net profit of KRW 45.1 billion. Net came in at 2.10 times operating, my calculation. That is the opposite of the usual order, since interest and tax normally take a cut on the way down the statement.
Something below the operating line added more than the operating line earned. It could be a foreign exchange gain on receivables, an equity method contribution, or a one time disposal. I did not open the quarterly filing and I am not going to name a cause I have not read. The reason I am leaving it out of the argument is narrower than the reason I am leaving out the balance sheet: a single quarter of non operating income tells me nothing about whether the export shift is durable, which is the question this piece is actually asking.
Two valuations I did not use
Two named houses have published figures on this name. The older one came from Sangsangin Investment and Securities in January 2025; the more recent from Hyundai Motor Securities in March 2026. I am not putting either into my own arithmetic, and the reason is not simply age. Two quarterly results have been reported since the more recent of the two, on 15 May and 29 July 2026, and those two results contain the entire half year this piece is about. A figure that predates the evidence does not answer the question the evidence raises. I also reached the more recent one only through a headline and did not open the report itself.
A peer I named and did not tabulate
Ternium S.A. (NYSE: TX). The exchange files it under the same industry label as this company, and its registered home sits on a different continent from the markets where it actually sells, which is the condition I was looking for while this piece turned on export mix. Ternium publishes a steel division and a mining division. This company publishes neither of those as a reported segment, and that asymmetry is exactly why I built no comparison table. Naming the peer and declining to tabulate it is the whole of what I am willing to claim.
Closing
The number I decided to leave out of this piece is the balance sheet. Total assets moved substantially in the same six months, and had I opened with that, this would have become a piece about where the money went instead of a piece about what the two quarters disagree on. Both were available. Choosing between them was the largest decision I made here.
The paragraph that moved most often is the one about export share. It started in the opening, because the record share is the most quotable fact in the release. It ended up below the reconstruction, because a record share means nothing until you know how much profit it actually carried. Its final position is the argument of the piece in miniature.
The third-quarter report is due by 16 November 2026. I will open it on the margin line first.
Prices and market value reflect the 21 September 2026 close. The USD conversion is approximate, at roughly 1,381.0 won per dollar on the same date. Quarterly and half-year figures come from the company’s second-quarter release as carried by Digital Daily and Edaily; first-quarter figures and the filing dates from Chickstock; annual revenue, operating profit and margins from the Hankyung corporate financial data page; the peer’s segment and industry labels from Stock Analysis. Figures I built myself are marked as my calculation where they appear.
Related reading