Korea’s ISC Balance Sheet: Long-Term Assets Below 2022 Level
- Total holdings, end of 2022: 358.43 billion won
- Total holdings, end of June 2026: 652.90 billion won
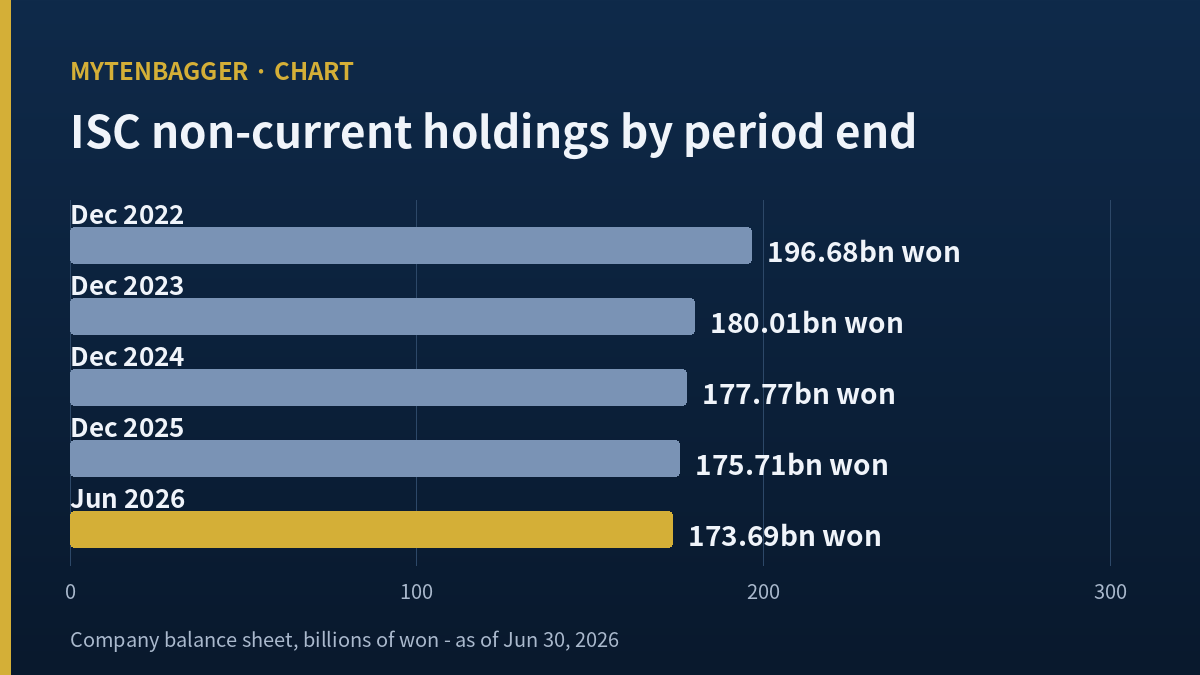
- Non-current holdings, end of 2022: 196.68 billion won
- Non-current holdings, end of June 2026: 173.69 billion won
- Revenue for 2022: 178.87 billion won
- Revenue for the six months to June 2026, doubled: 282.46 billion won
- Revenue per won of holdings: 0.499 in 2022, 0.433 annualized in 2026
- Where I stand: no position, no order, watching the December figure
Two lines on this balance sheet have been moving in opposite directions for roughly forty-two months, and only one of them gets quoted. The company’s total holdings went from 358.43 billion won at the end of 2022 to 652.90 billion won at the end of June 2026, a rise of 82.16 percent. Over the same span the part of those holdings that is not current fell from 196.68 billion won to 173.69 billion won, a decline of 11.69 percent. The Korean maker of semiconductor test sockets got much bigger on one line and slightly smaller on the other.
I do not own this name and I have no order placed. What kept me at the screen for an hour was the second line, because a company that roughly doubled what it sells while the long-lived part of its holdings went down is either very efficient or has not yet paid for the growth it has announced. I could not settle which, and this journal entry is the record of that.
Contents
Two lines under ISC stock that moved in opposite directions
The Korean filing database publishes a balance sheet twice a year, and an aggregator called Valueline reprints it in units of 100 million won. I converted everything to billions of won so the numbers in this entry read on one ruler. The figures below are period-end figures and not averages.
| Period end | Total | Current | Non-current | Liabilities | Equity |
|---|---|---|---|---|---|
| Dec 2022 | 358.43 | 161.74 | 196.68 | 90.40 | 268.02 |
| Dec 2023 | 541.81 | 361.80 | 180.01 | 68.36 | 473.45 |
| Dec 2024 | 582.88 | 405.10 | 177.77 | 59.74 | 523.14 |
| Dec 2025 | 622.42 | 446.71 | 175.71 | 85.16 | 537.26 |
| Jun 2026 | 652.90 | 479.21 | 173.69 | 69.84 | 583.07 |
Source: Valueline balance sheet for 095340, converted to billions of won. Cross-checked against Investing.com’s own table of the same filings, which matched on every 2022 to 2025 figure I could compare.
Two internal checks hold. Current plus non-current equals the total in every period within a rounding tenth, and liabilities plus equity equals the total on the same terms. I did both by hand before using any of it, because the two sources use different units and a units error would not announce itself.
What ISC stock owns for the long term is smaller than in 2022
The non-current column reads 196.68, then 180.01, then 177.77, then 175.71, then 173.69. Four consecutive declines. Nothing in that sequence is dramatic on its own, and each step after the first is close to two billion won. Put end to end they take the long-lived part of the company down 11.69 percent from where it stood at the close of 2022.
Against that, what the company sells kept climbing. Revenue for 2022 was 178.87 billion won. Revenue for the first six months of 2026 was 141.23 billion won, which doubles to 282.46 billion won for a full year at the same pace. That is 57.9 percent more than 2022 while the productive side of the holdings went down by a tenth. A test socket is a consumable, so volume can rise without new floor space for a while, and Korean suppliers in this niche have historically run their lines harder before adding them. There is a limit to that, and I cannot see where it sits from outside.
A company can sell more from the same plant for a long time. It cannot do it forever, and the filing does not say how much room is left.
ISC stock and the year the balance sheet grew the most
The single largest move in that table is 2023. Total holdings went from 358.43 to 541.81 billion won, a rise of 183.38 billion won in twelve months. It is also the worst operating year the company has had in the five I looked at, and the year its equity jumped from 268.02 to 473.45 billion won.
Reading that year on its own is instructive. The operating result for 2023 was the weakest of the five by a wide distance, and a company in that position normally shrinks its sheet: it draws down inventory, collects receivables, defers spending. This one did the opposite by 183 billion won, and it did so because the money arrived from outside the business and not from it. Anyone looking only at total holdings in 2023 would have read growth. Anyone looking only at what the company sold would have read contraction. Both were true in the same twelve months, which is the sort of thing that makes a single-line screen useless on this name.
The explanation is not hidden. In 2023 the company issued new shares to a strategic buyer in a placement reported at roughly 200 billion won, and the chemical affiliate that bought them became the controlling shareholder. Equity rose by 205.43 billion won that year, which is the placement plus the year’s modest earnings less whatever went out. So the balance sheet swelled in the year the income statement contracted, and the swelling came from share issuance and not from trading.
Where the 2023 expansion actually landed
Money raised has to sit somewhere, and which line it sits on tells you what the company did with it. I split the 2023 increase two ways.
The current side took all of it
Current holdings rose 200.06 billion won in 2023, from 161.74 to 361.80. The non-current side fell 16.67 billion won in the same year. Those two numbers add to 183.39, which is the total increase of 183.38 within a rounding tenth. Every won of the expansion, and then some, went to the current side of the sheet.
Korean suppliers in this corner of the chip chain often carry a light fixed side, and I have looked at that pattern before. When I wrote up another Korean consumables maker with a dominant niche position in July, the question was whether the price already held the whole moat. Here the question is the opposite one: whether the plant behind the moat exists yet.
And it stayed there
Forty-two months later the current side is 479.21 billion won and the non-current side is 173.69. Current holdings were 45.12 percent of the total at the end of 2022 and are 73.40 percent now. The company is, in the arithmetic sense, mostly cash and receivables and inventory today, and the part that makes the product is a quarter of what it owns.
The current share by period end runs 45.12, then 66.78, then 69.50, then 71.77, then 73.40 percent. It has climbed every single period since the placement, never once stepping back. That steadiness is itself information. A company spending heavily on plant would show at least one period where the current share dips, because the money leaves one line and lands on the other. Four consecutive periods without a dip says the conversion has not started.
Revenue per won of holdings, and what ISC stock did to it
The cleanest way I found to hold both lines at once is to divide the year’s revenue by what the company owned at the end of it. That ratio is my own arithmetic on two published lines, and I am printing it as my own computation and not as anything the company reports.
The five-year path
2021 gives 0.553. 2022 gives 0.499. 2023 gives 0.259. 2024 gives 0.299. 2025 gives 0.354. The 2026 figure, using six months doubled over the June holdings, gives 0.433. The drop between 2022 and 2023 is a halving, and it happens because total holdings grew 51 percent in the year revenue shrank 21.6 percent. Nothing about operations caused it. A placement did.
What has and has not been recovered
From 0.259 the ratio has climbed three years running and is now within 78 percent of the 2021 reading. The climb came almost entirely from revenue. Total holdings have grown too, but slowly, and the piece of it that can be worked has not grown at all. If the recovery keeps running on the same plant, the ratio keeps rising. If the announced expansion arrives, total holdings jump and the ratio falls again, and the fall will not mean anything went wrong.
One more feature of the table is worth naming because it complicates the story slightly. Liabilities do not sit still. They run 90.40, then 68.36, then 59.74, then 85.16, then 69.84 billion won across the five period ends. The 2025 reading is 42.6 percent above 2024 and the June 2026 reading gives most of that back. A swing of that size on a company with almost no borrowing is usually payables and accrued items moving with the production calendar, which is what I would expect from a supplier whose customers order in bursts. I have not confirmed that from the notes, so I am describing the movement and not its cause.
The share total moved once, in 2023
Because per-share figures are only comparable only when the share total is fixed, I checked whether the number of shares had moved. It did, once. Paid-in capital reads 8.70 billion won at the end of 2022 and 10.59 billion won in every period after, with 17,400,000 shares before and 21,197,058 after. Those two multiply out exactly at 500 won of par each, which is the check I ran to confirm the two sources were describing the same event. The rise is 3,797,058 shares, or 21.82 percent.
The par check matters more than it looks. Two sources printed paid-in capital and share totals in different units, and only by multiplying each pair back to 500 won could I be sure they described one event and not two.
That single step is the 2023 placement. There has been no further movement through June 2026, no split, no bonus issue, no retirement of treasury shares. So any per-share number from 2022 or earlier sits on a different share total from anything after, and I have kept those two eras apart everywhere in this entry.
One global peer and one ratio behind ISC stock
For an American reader the useful comparison is Cohu, Inc. (NASDAQ: COHU), which sells into the same back-end test step but sells the handling equipment alongside the contact hardware, so it owns more of the test step than a consumables specialist does. I picked it to test one thing only: whether a company that owns more of the test process carries a heavier long-lived side.
Cohu’s non-current holdings were 37.31 percent of its total at its June 2026 period end. The Korean company’s were 26.60 percent. The gap is 10.71 percentage points. That is the entire comparison I am making. I have deliberately printed no revenue, no earnings, no multiple and no market value for the American company, because those would invite a ranking and a ranking is not what this ratio supports. What the gap says is narrow and useful: the company I am looking at is lighter on the productive side than a peer that does more of the job, which is consistent with a consumables specialist and consistent with an expansion that has not been paid for yet. It does not tell me which.
When I looked at a Korean chip designer earlier this year I had to work the same problem from the other end, because its revenue sat still for five quarters while operating profit swung. There the fixed side was stable and the mix moved. Here the mix is moving and the fixed side is the thing standing still.
What ISC stock costs against the equity behind it
The shares closed at 212,500 won on September 23, 2026. Multiplied by the 21,197,058 shares outstanding that is 4,504.37 billion won of market value, or about 3.32 billion dollars at 1,358.4 won per dollar. Against the 583.07 billion won of equity reported for June 2026, the market is paying 7.73 times, by my own division.
Two screens I use print a lower figure than that, around 4.2 times, and I could not reproduce it from the closing price and any equity number in the filing. I am recording the disagreement without choosing a side, and I have kept the 7.73 out of the argument for the same reason. The 52-week span runs from 69,500 to 292,500 won, which is a span of 4.2 times in twelve months, so whichever figure is right it has been a very different number recently.
Figures I found and left out of the case
Three things I verified and then did not use. Leaving them visible is cheaper than pretending I did not see them.
Liabilities, which barely matter here
Total liabilities were 69.84 billion won in June 2026 against 583.07 of equity, a ratio under 12 percent. The company has effectively no leverage, and a debt discussion would have taken space without changing any conclusion.
Where inside the current side the money sits
Cash, receivables and inventory are separate lines and they behave very differently. The aggregators I could reach give only the current subtotal, and the audited breakdown sits behind a filing portal that refused my requests. So I wrote current holdings as one number and did not guess at its parts.
One thing I did check, and it held
I tested whether the 2026 interim total could be reconciled from the December 2025 figures and it does: 622.42 grew to 652.90, a rise of 30.48 billion won, while equity rose 45.81 and liabilities fell 15.32. Those two moves net to 30.49, which closes within a rounding tenth. The June sheet is internally consistent with the December one.
The announced expansion is not on the sheet yet
On July 27, 2026 the company said it intends to lift annual capacity from roughly 210,000 units toward a maximum of 640,000 by 2029, in stages tied to confirmed customer schedules. A tripling of physical output is not something a balance sheet hides. As of the June sheet, nothing of it has arrived: the non-current side is still going down, one or two billion won at a time.
It is worth doing the arithmetic on what a tripling implies. Going from 210,000 units to 640,000 is 3.05 times, and the company put 2029 on it, which is about forty-two months from the June sheet. If the productive side had to scale anywhere near proportionally, the non-current line would need to grow by hundreds of billions of won over that span, against a starting point of 173.69. Nothing remotely like that has begun. Either the ratio of output to plant is far more elastic in this niche than I assume, or almost the entire spend is still in front of the company.
That is the tension I could not resolve. Either the company can serve a great deal more demand from what it already owns, in which case the coming years are unusually profitable, or the spending is ahead and the current line falls as the non-current line rises. Both stories fit the same table, and the filing that separates them is not published yet.
Thirteen ways I could be wrong about ISC stock
The ways this entry fails, written before I stop looking.
- Test socket lines may be cheap relative to output, so a flat non-current line could be normal for this business and carry no signal at all.
- Rented floor space and tooling under operating leases can expand output without appearing where I looked.
- My ratio uses period-end holdings and not averages. Averages would soften the 2023 collapse considerably.
- Doubling six months to get a year assumes no seasonality, and the closing six months have historically been larger.
- A large current balance depresses the ratio mechanically. A company holding three quarters of its worth in cash will always look unproductive by this measure.
- The 2023 placement raised money for a purpose the buyer described at the time, and I did not read that document.
- Cohu reports on a different calendar and under different accounting, so my 10.71 point gap carries accounting noise I have not sized.
- One peer is a sample of one. A second comparison could move the gap either way.
- The two screens printing 4.2 times may be right and my 7.73 wrong, in which case the shares are far less demanding than I assumed.
- Capacity in units says nothing about revenue per unit, and a tripling of units is not a tripling of sales.
- The June sheet is an interim report, and interim figures get restated.
- A controlling shareholder with its own capital needs can change this company’s spending plan without regard to the operating case.
- I am reading a balance sheet to answer a question about demand, which is an indirect route at best.
Seven checkpoints for ISC stock, with the odds I give them
These are my own probabilities and not anyone’s estimate, and they sum to one hundred by construction.
- 28 percent. The next published balance sheet shows non-current holdings still at or below 173.69 billion won. The expansion is being deferred or leased.
- 22 percent. Non-current holdings rise between five and twenty billion won. Staged spending has begun on the announced schedule.
- 16 percent. Non-current holdings rise more than twenty billion won in a single interim period, which would be a step change in intent.
- 12 percent. Revenue per won of holdings clears 0.45 for the full year, above every reading since 2021.
- 9 percent. The current share of total holdings falls back under 70 percent as money is converted into plant.
- 8 percent. Liabilities rise above 100 billion won, meaning the expansion is being financed with borrowing while the money on hand stays where it is.
- 5 percent. The share total moves again, which would reset every per-share figure in this entry.
Six of the seven are answered by one document. Only the full-year ratio needs a second one, because a nine-month revenue figure will not settle it. The statutory date for the next quarterly filing is November 16, 2026, and that is the date I have marked.
What I would have to see
I have no position and I am not opening one. The reason is narrow enough to write in a sentence: I cannot tell whether a shrinking long-lived line is evidence of an unusually light business or evidence of spending that has not started, and those two lead to opposite outcomes from the same table.
The practice this one corrected
A capacity target is something I have been treating as news when it is arithmetic. When a company says it will triple output by a given year I file it under narrative and go back to the earnings lines. This time the narrative and the sheet disagreed, and the disagreement was the most informative thing available. The correction I am writing down: when output plans are announced, go to the long-lived line first and see whether anything has moved, because that line answers with money and the press release answers with intent. Honestly, I should have been doing this for years, and it took a company whose fixed side was going down to make it obvious.
One number reopens this for me. If the next published balance sheet shows non-current holdings meaningfully above 173.69 billion won, the expansion is real and paid for, and I will look again with a different question. Both inputs to that comparison are already published twice a year on a fixed schedule, so I do not need anyone’s forecast to get the answer. This one I am passing on for want of a fact.
Prices and figures reflect the September 23, 2026 close. The dollar conversion is approximate, at 1,358.4 won per dollar on the same date, as reported for the Seoul market that afternoon. Quarterly results cited are the provisional group figures the company filed on July 27, 2026, and peer figures come from Cohu’s reported balance sheet.
Related reading
- Golfzon Revenue per Store Fell as 689 New Venues Opened
- Samwha Capacitor Earnings: Three Steady Years, Then a Weaker Half
- Isu Chemical Balance Sheet: Liabilities Down, Equity Up
- Korea’s PHA: 40% of Pre-Tax Profit Is Below the Operating Line