CJ CheilJedang Stock: The Year the P/E Cell Stayed Empty
My stock screener has never once shown me this company, and I now know exactly why. CJ CheilJedang stock closed at ₩195,100 on Tuesday, August 4, 2026, or roughly $136 a share at the exchange rate I use below, for a market value of about ₩2.94 trillion, near $2.05 billion. The price-to-earnings column beside it is not a low number. It is blank. The company posted a net loss for 2025, so the arithmetic that would fill that cell has no denominator to work with, and every filter I run drops the name before I ever see it. I spent this session looking at what my filter was throwing away.
What the screen cannot compute, and where each blank comes from
P/E: no value. Traces to one line: the 2025 net loss of ₩416.9 billion.
EPS: negative. Same line.
Return on equity: negative 7.7 percent. Same line again.
Three of the four checks this stock fails all reduce to a single fiscal year’s bottom line. Operating profit that same year was positive, and large. This piece is about the distance between those two facts, and about why I stopped using growth rates to describe it.
Contents
CJ CheilJedang stock, priced against a blank column
A word on the market first, because it changes how the numbers should be read. CJ CheilJedang is listed on the KOSPI, the senior board of the Korea Exchange, under the code 097950. The KOSPI is where Korea’s large industrial and consumer names sit, as opposed to the KOSDAQ, which carries younger and smaller companies. Korean won is the reference currency for everything that follows; dollar figures are conversions I have added for readability, not the primary record.
| Measure | Value | Note |
|---|---|---|
| Close | ₩195,100 | August 4, 2026 |
| Market value | ₩2.94tn (~$2.05bn) | Close × 15,054,331 common shares, my calculation |
| P/E | not computable | 2025 net loss |
| Price / book | 0.45 | Book value ₩437,008 per share; 195,100 ÷ 437,008 = 0.4465, my check |
| Price / sales | 0.11 | Denominator is consolidated revenue of ₩27.34tn |
| Return on equity | −7.7% | Vendor figure, Kiwoom data |
| Dividend yield | 3.08% | ₩6,000 per share ÷ close, my calculation |
| Range over 250 sessions | ₩254,000 / ₩172,600 | Intraday; close sits 23.19% below the high and 13.04% above the low, both computed off ₩195,100 |
| Foreign ownership | 15.56% | Debt-to-equity 157.98% |
The seven-point quality checklist I keep gives this name three passes out of seven. Revenue scale passes, price-to-book passes, positive operating profit passes. Operating margin, earnings per share, return on equity and price-to-earnings all fail. I want to sit on the strange pairing in that list for a moment: operating profit is positive and earnings per share is negative in the same fiscal year. The company earned more than a trillion won from operations and still closed the year underwater. That is the whole subject.
From ₩1.23 trillion down to a ₩417 billion loss
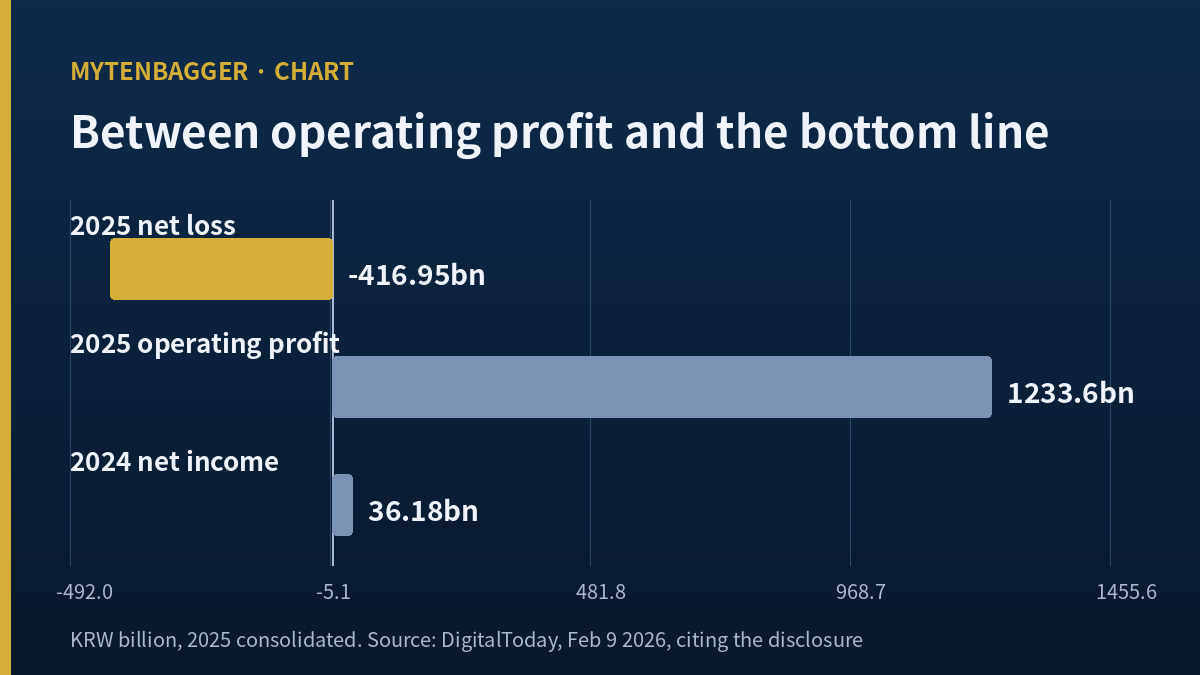
Here are the 2025 consolidated figures at full precision, taken from Korean press reporting of the company’s regulatory filing: revenue ₩27,342.58 billion, operating profit ₩1,233.60 billion, net loss ₩416.95 billion (DigitalToday, February 9, 2026, citing the disclosure). The prior year had closed with net income of ₩36.18 billion, so this was a swing into loss rather than a deepening of one. Between the operating line and the final line, ₩1,650.6 billion went missing, my subtraction, worth about $1.15 billion.
The company gave two reasons: weaker bio-segment earnings, and non-operating losses tied to valuation of tangible and intangible assets. The first is already visible in the operating line, which fell 20.6 percent. So the second reason is the one carrying the ₩1.65 trillion. I did not open the filing itself to break that item into components, and because I did not, I am not going to tell you what share came from where. What I verified is the size of the gap and the label the company put on it.
Why I stopped quoting growth rates for this company
I tried to write the first quarter of 2026 into this piece and got stuck. Three sources agree on the absolute figures and disagree on every percentage attached to them. The company’s own release put consolidated revenue at ₩7,111.1 billion, up 6.0 percent, with operating profit of ₩238.1 billion, down 17.2 percent. Korean press citing the filing gave the identical two amounts with revenue down 1.4 percent and operating profit down 28.5 percent. A third outlet, reconstructing from the quarterly report, printed revenue of ₩7,208.5 billion, up 1.4 percent, and the same ₩238.1 billion operating profit, down 17.2 percent.
So I checked which version survives arithmetic. For operating profit to be down 17.2 percent, the year-ago quarter has to be ₩238.1 ÷ 0.828 = ₩287.6 billion. One of those outlets states the year-ago quarter as ₩287.6 billion outright, and the two numbers lock together. The 28.5 percent version would require a year-ago base of roughly ₩333 billion, and I could not find any source that prints that figure. The company, for its part, noted that assets of a subsidiary previously classified as held for sale had depreciation suspended and then resumed under K-IFRS 1105, and that the quarter was a provisional figure not yet through external audit. Restate a base and the same amount carries a different percentage. The conclusion I drew is not that one growth rate is right. It is that for this company a percentage cannot be quoted without first asking what sits underneath it, and that this alone tells you something about how the accounts have been moving.
A claim about finance costs that did not survive my own check
One article framed the leverage problem in a way that fit my argument perfectly. First-quarter gross borrowings of roughly ₩12 trillion, about ₩5 trillion of it maturing within a year, and finance costs of ₩244.6 billion in a quarter whose operating profit was ₩238.1 billion, meaning, in that writer’s phrasing, that the company paid out more in financing than it earned from operations (Asia Today, July 30, 2026). It is a clean sentence and I wanted to use it.
Then I looked at the bottom line of that same quarter. Net income was positive ₩119.8 billion, up 108.8 percent from a year earlier, with ₩81.8 billion attributable to controlling shareholders. Finance costs exceeded operating profit and the quarter still closed in profit. A gross cost line and a net result are two different statements, and something on the income side, whether finance income or another item, must have absorbed the difference. I could not identify what did the absorbing. The borrowings of ₩12 trillion and the ₩5 trillion maturity wall stay in my notes as facts. The sentence about financing eating the profit does not, because I could not make it come out.
The same article gave first-quarter operating cash flow of ₩536.3 billion and net investing outflow of ₩476.6 billion. The cash flow figure matched, to the nearest ten billion won, the operating cash line in the indicator database I keep separately. That database does not label which period its cash-flow fields cover, but when two independent paths land on the same amount I treat that one field as usable.
CJ CheilJedang stock has two revenue bases, not one
The 0.11 price-to-sales ratio comes from dividing ₩2.94 trillion of market value by ₩27.34 trillion of consolidated revenue, which works out to 0.107 on my calculator. Read plainly, that says the market pays about eleven cents for each dollar of sales. But the denominator includes CJ Logistics, the group’s freight and warehousing arm, which consolidates into these accounts. When the company reports operating results to investors, it reports them on a basis that excludes CJ Logistics. Reporting on that basis put 2025 revenue at roughly ₩17.7 trillion (Seoul Economic TV, February 11, 2026). The article does not spell out the exclusion in words, and I inferred it from how far that number sits from the consolidated ₩27.34 trillion. On the smaller base, price-to-sales becomes about 0.17, my approximate calculation.
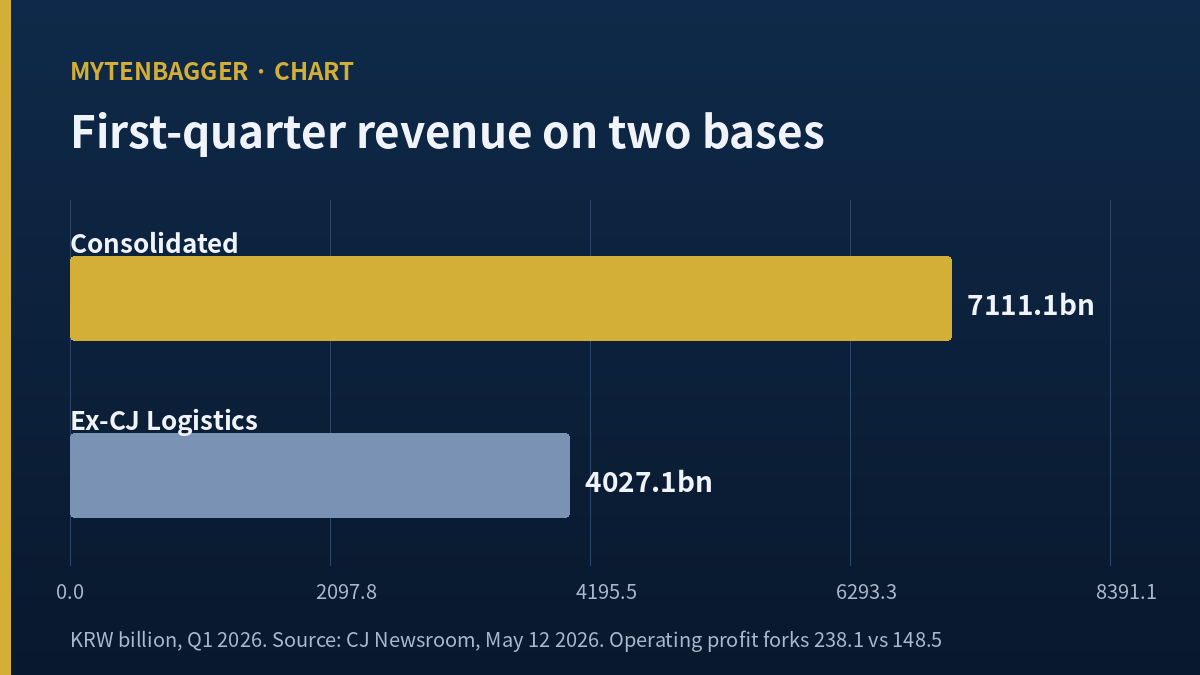
Neither ratio looks expensive. The problem is different. Anyone who lifts the 0.11 off a screen and lines it up against a packaged-food peer is not comparing two food companies. They are comparing a food company with a logistics business bolted on to a food company standing alone. The first quarter shows the same fork: consolidated revenue of ₩7,111.1 billion against ₩4,027.1 billion on the ex-logistics basis, and operating profit of ₩238.1 billion against ₩148.5 billion (CJ Newsroom, May 12, 2026).
Underneath that, the segment split explains where the earnings actually went. Food revenue of ₩3,038.4 billion rose 3.9 percent with operating profit up 11.2 percent. Bio revenue of ₩988.7 billion rose 5.7 percent, and its operating profit collapsed 92.4 percent to ₩5.5 billion. Overseas food revenue of ₩1,555.5 billion grew 4.5 percent, led by dumplings in the American and Japanese markets. Food held. One segment broke.
The business being sold outearns the company selling it
Between July 28 and 30 of this year, Korean outlets reported that the company is seeking a buyer for its starch and sweetener division, a business-to-business unit making corn starch, syrups, glucose and fructose. The reported expectations were a price in the neighborhood of ₩300 billion, around $210 million, a domestic market position of fourth or fifth, a carve-out structure, and financial sponsors as the likely counterparties (Newspim, July 29, 2026). Management described the move as clearing out businesses with weak growth and weak profitability.
That description is where I slowed down. Ingredion, the American pure-play in exactly this category, runs a 12.89 percent operating margin against this company’s 4.51 percent on a consolidated basis, a factor of 2.9 by my arithmetic. The global specialist in the business being called marginal earns a much better margin than the seller does overall. I do not read that as proof the seller is wrong. I read it as evidence that the problem is positional rather than sectoral: fourth or fifth place in one national market is a different asset from category leadership. And if the sale clears near the reported range, ₩300 billion is roughly a tenth of the current market value, which bounds how much balance-sheet relief it can deliver.
| Company | P/E | P/B | P/S | Op. margin | ROE | Yield |
|---|---|---|---|---|---|---|
| CJ CheilJedang Aug 4, 2026 close |
n/a | 0.45 | 0.11 | 4.51% | −7.7% | 3.08% |
| ADM Aug 4, 2026 intraday |
21.73 | 1.61 | 0.47 | 2.32% | 7.64% | 2.62% |
| Ingredion Aug 4, 2026 intraday |
10.91 | 1.40 | 0.90 | 12.89% | 13.69% | 3.20% |
| Ajinomoto May 29, 2026 close |
37.24 | 5.84 | 3.11 | 12.08% | 17.50% | 0.97% |
The peer multiples come from the per-company statistics pages at stockanalysis.com (Ingredion, ADM, Ajinomoto), and the as-of dates differ by row. The two American names carry early-afternoon Eastern time quotes from August 4, which means they are intraday rather than closing marks, and the Ajinomoto page was stamped May 29, more than two months stale. I could not align them to one date, so I use this table for direction and I do not lean on the second decimal.
Direction is enough for the comparison I care about. Of these four, Ajinomoto is the closest structural twin, a food company that also runs a large amino acid business, which is exactly this company’s two-segment shape. Ajinomoto trades at 5.84 times book. CJ CheilJedang trades at 0.45. That is more than a tenfold spread on the same combination of businesses. Ajinomoto also earns a 17.50 percent return on equity and an 8.50 percent net margin, while the Korean company’s net margin is below zero. The valuation gap and the performance gap appear in the same table, which makes the discount look less like an anomaly and more like a scorecard. My interest is in whether that scorecard belongs to one year or to the business.
What CJ CheilJedang stock pays, and what the analysts see
The dividend was paid through the loss year. Six thousand won per share, which regulatory filings show at ₩6,000 for both 2025 and 2024 and ₩5,500 for the two years before that. Against the August close that is a 3.08 percent yield, my calculation. Because a dividend paid in a loss year comes out of cash rather than earnings, I went looking for the cash. Total common dividends work out to about ₩90.3 billion, from ₩6,000 across 15,054,331 shares. The only cash-flow figure I hold is the first-quarter operating figure of ₩536.3 billion, which covers a different span, so I am not going to divide an annual payout by a quarterly inflow and present the result as a coverage ratio. What I will say is that one quarter of operating cash exceeded the full year’s common dividend by more than five times.
On the sell side, and quoting rather than adopting: Kiwoom Securities analyst Park Sang-jun raised his valuation on the shares to ₩310,000 on April 1, keeping a buy rating, arguing that Middle East supply disruption in methionine had highlighted the cost and supply stability of grain-based fermentation, as reported by the Korean securities press (ksdaily, April 1, 2026). KB Securities went the other way in January, cutting to ₩270,000, a ten percent reduction, while holding its buy rating and disclosing that it had lowered the applied multiple from eleven times to nine (PRESS9, January 7, 2026). Hanwha Investment published a February 10 company note whose title translates as a call for a persuasive and concrete strategy; I saw the title and not the body. DS Investment was reported to expect a bio recovery in the second half alongside softer food profitability, but I could not reach the original and so cannot give the analyst or the estimates.
Measured off the August 4 close, ₩310,000 sits 58.9 percent above the price and ₩270,000 sits 38.4 percent above it, both my arithmetic. There is one more thing in that Kiwoom note worth recording: the first-quarter operating profit estimate was ₩269.1 billion and the reported consolidated figure came in at ₩238.1 billion, which is 11.5 percent below. I could not confirm whether that estimate was framed on the consolidated basis or the ex-logistics basis, so I hold the comparison loosely. In a company that publishes two bases, the estimate has to be asked the same question as the multiple.
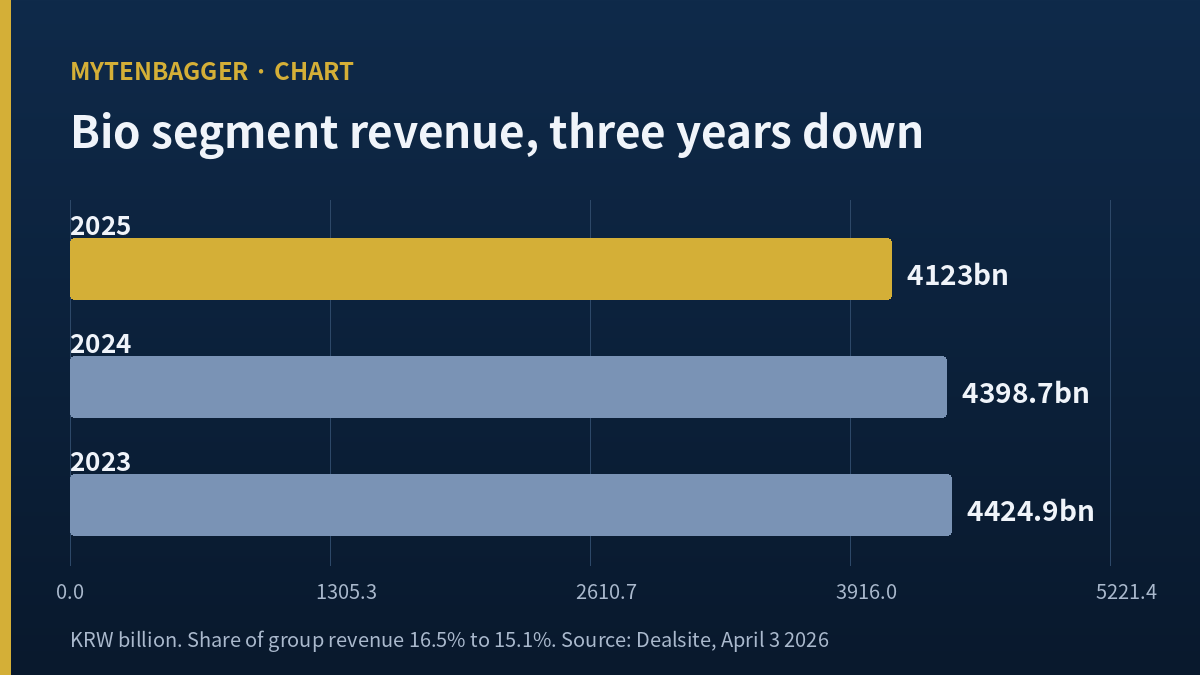
The case against. Bio revenue has fallen three years running: ₩4,424.9 billion in 2023, ₩4,398.7 billion in 2024, ₩4,123.0 billion in 2025, with the segment’s share of group revenue sliding from 16.5 to 15.1 percent. The cause is a collapse in specialty amino acid pricing. Tryptophan in China went from 75,938 yuan per ton to 32,238 yuan, and European pricing from 9,346 euros per ton to 3,954 euros, on the quarterly comparison the trade press laid out. Industry voices quoted in the Korean trade press warn that if the price weakness persists, the bio unit shifts from contributing to subtracting (Dealsite, April 3, 2026). And there is a pattern in the divestment history worth weighing: the bio sale review was withdrawn in April 2025, the Selecta disposal fell through, and the feed business went back on the block. The starch and sweetener process is at the stage of options under review, not a signed deal. I have watched a Korean name lose a story premium and get left with the plain earnings underneath, and the reverse asymmetry applies here: the story has not been told yet, so there is nothing to lose and nothing yet confirmed to gain.
The timing problem, and what it does to the trigger
I did not come across a US-listed line for this company; the Seoul listing is the one that prices and settles in won. At ₩195,100 a share the single-share ticket is around $136 at the rate footnoted below, and Korea does not offer fractional trading on ordinary listings, so the smallest position the market allows here is set by the share price rather than by the size of the conviction.
The part specific to this piece is timing, and it matters more here than usual. The Korea Exchange closes at half past three in the afternoon Seoul time, which is half past two in the morning on the American East Coast. Korean companies release quarterly results into that window. The entire trigger in this article is a single number in the second-quarter release, the sign on net income, and that number lands and gets repriced inside a window that falls in the middle of the night across the Atlantic and the Pacific alike. What reaches anyone outside that window is the reaction, not the print. That is not a reason to avoid the name. It is a reason to decide the response before the print rather than after, which is what the rest of this section is for. I have written before about a Korean name trading below a price the company itself had paid, and the common thread is the same: the mispricing is easy to describe after the fact and awkward to act on while the tape is moving.
Why CJ CheilJedang stock went onto my watchlist and what removes it
I own none of this and I am not buying any today. What changed is upstream of that. Until this session the company was not on my watchlist at all. Not held, not tracked, not looked at. A checklist score of three out of seven, a blank P/E and a negative return on equity get a name dropped by my first-pass filter, and because the filter dropped it I never learned why it had been dropped. That was the state I was in.
Three of the four failing checks trace back to one line, the 2025 net loss, and that line had already flipped by the first quarter of 2026: net income of ₩119.8 billion, with ₩81.8 billion attributable to controlling shareholders, up 363.8 percent. What the indicator screen shows is the residue of a closed fiscal year, and residue takes several quarters to clear. My filter, in other words, is built to discard companies precisely during the lag between the loss ending and the ratios catching up. Learning that about my own process was worth more to me than the stock was. It is the same failure mode I ran into with a Korean shipbuilder whose order book was at a record while an accounting item kept the payout at zero: the headline operating story and the line that actually governs the screen were two separate things, and only one of them reaches a filter.
So instead of buying, I added a line. Here is what the line says, and here is what erases it.
Added. CJ CheilJedang (097950), watch only, entered August 5, 2026. Reason: to find out whether the ₩1,650.6 billion between operating profit and net loss belongs to one year or to the structure. The 0.45 book multiple and the 3.08 percent yield are what I would price afterward, not what I am pricing now.
Removed. If second-quarter net income returns to a loss. That would mean the first-quarter profit leaned on suspended depreciation of assets held for sale rather than on the operations, and the company itself disclosed that possibility in its own results statement. My thesis breaks on a condition the issuer wrote down before I did.
One closing note on order. There is not a single valuation multiple in that watchlist entry. The trigger is the sign on a net income line, and nothing else, because in a company whose P/E cell is blank the first question is not whether the price is low but whether the arithmetic that produces a price ratio has come back into existence. Take those in the wrong order and you end up running a calculation the accounts do not yet support. The second-quarter release had not appeared as of August 4, 2026; the equivalent release last year came on August 12, 2025. I intend to read the bottom line first and the rest afterward.
Prices, market value and multiples for the Korean listing reflect the August 4, 2026 close as I checked it while writing, so live quotes can differ. USD conversions are approximate, at roughly ₩1,430 to the dollar on that date, and Korean won is the reference currency throughout. Peer figures carry the individual as-of dates shown in the table and are not aligned to one another. Anything I describe as my calculation or my check was derived by me from figures in the cited sources rather than printed there.
Related reading
- Lotte Wellfood Stock: The Cheap Cocoa Has Not Arrived Yet
- Binggrae Stock: Two of Four Quarters Carry the Whole Year
- CJ Freshway Stock: A 2.92% Margin the Whole Industry Shares