Isu Chemical Balance Sheet: Liabilities Down, Equity Up
- Nothing on the liability side got larger. Total liabilities came down at each of the four balance sheet dates I have, from KRW 832.79 billion to KRW 631.08 billion.
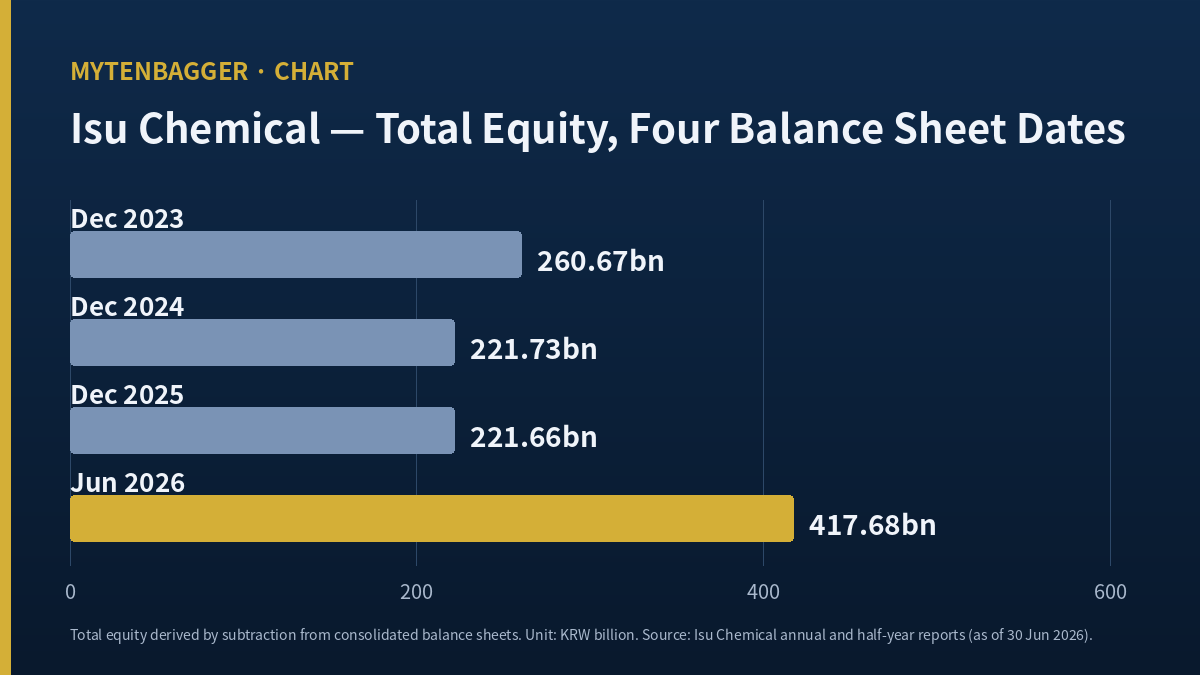
- Something on the equity side did. Equity went from KRW 221.66 billion to KRW 417.68 billion in six months, a factor of 1.8843.
- Everything I cannot account for sits in that one line, and I say so below instead of filling it in. I own none of this and I placed no order.
Total liabilities on the four balance sheet dates I could open for Isu Chemical stock read KRW 832.79 billion, KRW 735.51 billion, KRW 676.04 billion and KRW 631.08 billion. That is December 2023, December 2024, December 2025 and June 2026, and the line comes down at every step. Over the same four dates total assets went the other way twice: down from KRW 1,093.46 billion to KRW 897.70 billion, then up to KRW 1,048.76 billion in the most recent six months.
I added the current and non current liability lines myself to get those totals, and I got equity by subtracting the sum from total assets. The company trades in Seoul under the code 005950, and on Friday, September 18, 2026 the regular session closed at KRW 10,770, which puts the market value at roughly USD 204.72 million. KOSPI is Korea’s main stock index, the local equivalent of the S&P 500, and this company sits well down its market value table.
Contents
Four balance sheet dates, and only the fourth one grew
I started here because the income statement for this company has been loud and the balance sheet has been quiet, and quiet lines tell me more about what a business has actually been doing with its cash. The four dates are the ones a Korean data vendor publishes in full, with the sub lines intact, so I could rebuild the totals instead of copying somebody else’s arithmetic.
| KRW billion | Dec 2023 | Dec 2024 | Dec 2025 | Jun 2026 |
|---|---|---|---|---|
| Current assets | 696.25 | 502.74 | 456.80 | 618.44 |
| Non current assets | 397.21 | 454.50 | 440.90 | 430.31 |
| Total assets | 1,093.46 | 957.24 | 897.70 | 1,048.76 |
| Total liabilities (my addition) | 832.79 | 735.51 | 676.04 | 631.08 |
| Total equity (my subtraction) | 260.67 | 221.73 | 221.66 | 417.68 |
Source: Valueline Korea consolidated balance sheet, Korean won hundred millions converted to billions | Liability totals and equity are derived by me
The three dates that shrank
From December 2023 to December 2025 this company got smaller on both sides. Assets fell by KRW 195.76 billion. Liabilities fell by KRW 156.75 billion. Equity fell by KRW 39.01 billion. A business that shrinks its balance sheet by roughly a fifth over two years is usually doing one of two things: selling something, or paying something down while it waits. This one was paying down.
Liabilities measured against equity give me 3.1948 times at December 2023, 3.3171 at December 2024 and 3.0499 at December 2025. Those three numbers barely move. Two years of shrinking both sides left the proportions almost exactly where they started, which is what paying down debt with a thin income statement looks like from the outside.
Then the June 2026 sheet arrives and that same measure is 1.5109 times. It did not get there by paying anything down.
What the liability side of Isu Chemical stock has been doing
In the most recent six months liabilities fell again, by KRW 44.96 billion, which is 6.6505 percent. That is the smallest of the three drops in my window, and it is the one that matters least to the headline measure. The headline moved because the other side of the sheet moved far more.
Before I split out the interest bearing lines, the two halves of the liability side are worth reading on their own, because they moved together, and neither of them traded places with the other. Current liabilities read KRW 661.97 billion, KRW 605.51 billion, KRW 564.00 billion and KRW 529.39 billion across my four dates. Non current liabilities read KRW 170.82 billion, KRW 130.00 billion, KRW 112.04 billion and KRW 101.69 billion. Each pair adds to the totals in the table above, which is how I checked that I had transcribed the sheet correctly. More importantly, both halves fall at every single date. Nothing was refinanced from short to long or from long to short to make the headline look better, which is a pattern I check for first and did not find here.
Interest bearing lines, counted separately
I pulled out the four lines that carry interest, which are short term debt, short term notes, long term debt and bonds, and added them by hand for each date. They come to KRW 422.53 billion, KRW 411.03 billion, KRW 384.84 billion and KRW 319.62 billion. Every step down, and the last step is the biggest: KRW 65.22 billion in six months, or 16.9473 percent. Across the whole window the interest bearing total fell by KRW 102.91 billion, which is 24.3557 percent of where it started.
Two of those four lines deserve a word on their own. Bonds went to zero between December 2024 and December 2025 and stayed at zero in June 2026. Short term notes went from KRW 146.63 billion at the first date to KRW 51.32 billion at the last. Those are the two lines a company retires first when it wants to stop rolling paper, and this company retired both while its income statement was still weak. I find that more informative about management intent than anything in a press release, and it is one of the few things in this file I did not have to derive.
What I could not open is the interest expense that sat against those lines. The vendor sheet I used carries balance sheet lines only, and the filings I could reach did not give me a clean interest cost series. So I am writing about the size of the debt and not about what it cost, and I want that limit on the record before I go further.
Where the asset growth landed behind Isu Chemical stock
Total assets grew by KRW 151.06 billion in six months, which is 16.8274 percent. All of it, and then some, landed in current assets: those rose KRW 161.64 billion, or 35.3853 percent. Non current assets went the other way, down KRW 10.59 billion, or 2.4019 percent. So the company did not get bigger by building anything. It got bigger by carrying more of what turns over.
Receivables did most of the work
Trade and other receivables went from KRW 182.35 billion to KRW 306.14 billion, up KRW 123.79 billion or 67.8859 percent. Inventory went from KRW 167.19 billion to KRW 192.82 billion, up 15.3299 percent. Cash went from KRW 75.56 billion to KRW 84.36 billion, up 11.6464 percent. Those three account for KRW 158.22 billion of the KRW 161.64 billion increase in current assets, so there is very little left over to explain.
The mix inside those current assets shifted too, and that shift is the part I keep returning to. At December 2025 receivables were 1.0907 times inventory. At June 2026 they were 1.5877 times inventory. Both lines grew, but the money owed to the company grew roughly four and a half times faster than the goods sitting in its yards. For a producer selling a commodity into a tight market, that is what I would expect to see if it was shipping hard against firm orders. It is also exactly what I would expect to see if collection had slowed. The balance sheet on its own cannot separate those two, and a single date cannot either. What would separate them is a second observation, which is why the next report matters more to me than this one did.
Property, plant and equipment tells the opposite story: KRW 212.19 billion to KRW 202.86 billion, down 4.3970 percent. A company running a genuinely hot product cycle would often be adding capacity. This one was not, at least not in the six months I can see. I read that as a business capturing a price move on assets it already owned, which is a good thing while the price holds and a completely neutral thing once it does not.
I have written up a Korean chemical maker with an unusually loud single quarter before, in the LG Chem entry where I trusted a credit downgrade over the cheap arithmetic, and a Korean petrochemical maker whose single strong quarter I declined to annualize in the Kumho Petrochemical entry. Both of those pieces came down to the same discipline I am using here: find out which side of the statement a number actually came from before deciding what it means.
Five annual net income lines under Isu Chemical stock
Here is the part that makes the equity jump interesting instead of routine. Consolidated net income for the five years through 2025 reads KRW 94.03 billion, KRW 27.73 billion, KRW 31.27 billion of losses, KRW 47.42 billion of losses and KRW 31.07 billion of losses. Three consecutive loss years, and they add to KRW 109.76 billion of losses.
Over those same three years equity fell by only KRW 39.01 billion. If losses of KRW 109.76 billion had been the only thing touching the equity line, the fall would have been far larger. Roughly KRW 70.75 billion came in from somewhere else during that stretch.
A share issue sits inside the three loss years
Part of that is accounted for by a Korean disclosure dated June 10, 2025, whose title records an additional listing of shares from a third party allocation. I did not open the amount, and I have not printed one. What I can say is that the path of the equity line across those three years is consistent with money coming in from shareholders while the business was losing money, and that is a materially different story from a business that funded itself.
It also means I will not compare per share book value across those dates. The share count moved inside my window, so any per share series that crosses June 2025 would be measuring two different things and calling them one. The count I do use is the current one, 26,294,169 shares, and I use it only against the current price.
Reading Isu Chemical stock against a company one step downstream
The product this company makes is linear alkylbenzene, and the feedstock it makes first is normal paraffin. Korean trade press reported in May 2026 that it is the only Korean chemical maker producing both in one chain. Linear alkylbenzene is the raw material for the surfactants that go into laundry detergent, which means the last buyer in this chain is a household doing washing.
For a global reference point I went one step down that chain instead of sideways into another Korean name. Stepan Company trades on the NYSE and was founded in 1932. Its surfactants business makes cleaning ingredients of the kind that this sort of feedstock ends up inside. I have taken exactly one number out of that company for this piece, and it is the founding year. No revenue, no profit, no multiple, no capacity.
That is deliberate, and it is the whole point of picking it. What I wanted from a peer here was not a valuation comparison, because two companies at different steps of a chain with different accounting scopes will not give me one that holds. What I wanted was the age of the demand. A surfactants business that has been listed and operating since 1932 tells me the end market for this product is old, stable and unglamorous, and that an unusually good six months in the middle of that chain is far more likely to be about price than about a new market appearing.
The same logic showed up when I looked at nine Korean fiber makers in the Hyosung TNC entry, where removing one row moved the median. A peer table is only worth building when the rows are actually the same kind of thing, and when they are not, saying so is the more honest output.

Twenty one things I hold against Isu Chemical stock
- Equity rose by KRW 196.02 billion in six months and I cannot tell you where all of it came from. That is the single largest hole in this piece.
- I have four balance sheet dates and five annual net income figures. I do not have a half year net income figure from a document I opened, so I cannot size the profit portion of that increase.
- Three consecutive years of net losses is the base rate for this business. One good stretch does not reset that.
- The company was taking money from shareholders during those loss years, on the evidence of the June 2025 disclosure title.
- Non current assets fell in the six months when assets grew. Nothing was being built.
- Receivables grew 67.8859 percent in six months. Receivables that grow faster than anything else on the sheet are money the company has earned and not yet collected.
- Inventory grew 15.3299 percent at the same time. Both of those unwind badly if the selling price turns.
- Cash is KRW 84.36 billion against interest bearing debt of KRW 319.62 billion. The gap is still wide.
- Liabilities measured against equity at 1.5109 times looks much better than 3.0499, but it improved mostly because of equity, and only slightly because of repayment.
- The vendor sheet I used carries no interest expense line, so I am writing about debt size without its cost.
- Bonds at zero for two consecutive dates could mean discipline, or it could mean the company stopped being able to issue them. I cannot tell which from the balance sheet alone.
- The market value of roughly USD 204.72 million puts this well outside the part of the Korean market I normally take positions in.
- I found no named brokerage forecast for 2026 or 2027 in anything I could open. I have no external check on whether my reading is consensus or contrarian.
- Two data providers I looked at print different book value figures for the same date, which means at least one of them is using a scope I have not identified.
- Three providers printed three different closing prices for Friday, September 18, 2026. I picked the one labeled as the regular session close and verified it against two market value columns, but that is judgment and not certainty.
- The Korean product press coverage I relied on is trade press and not a filing. The claim that this is the only Korean maker running both steps comes from there.
- The company’s own explanation for the strong stretch points at geopolitical supply tightness, which is a condition it does not control.
- The same coverage noted that a sustained rise in crude could make it hard to pass input cost through into product price.
- Consolidated results here include a construction subsidiary, so reading this purely as a chemicals business is wrong on its face.
- A September 2026 disclosure shows that 16.2842 percent of all shares outstanding are pledged as collateral by the largest holder. That is a claim on the register that has nothing to do with how the business trades.
- Only two significant disclosures appeared in the last ninety days, both of them holdings reports. This has been a quiet window for company communication, and quiet windows are when I am most likely to fill gaps with my own assumptions.
Where I stand, and what would end this reading
I do not own this and I have not placed an order. The market value is small enough that my default with a Korean name this size is to watch and write, and buying comes much later, and nothing on these four balance sheets changed that default. What the June 2026 sheet did change is the question I would ask next. Six months ago the question was whether this company could stop shrinking. Now it is where KRW 196.02 billion of equity came from.
Five things would end this reading, and I am listing them in the order I expect answers:
- The Q3 2026 report shows the equity movement broken out, and most of it turns out to be something other than retained profit. In that case the improvement in the debt measure is not what I have been treating it as.
- Receivables keep growing faster than assets as a whole at the next date. At some point growing receivables stop being a sign of sales and start being a sign of collection.
- Interest bearing debt stops falling, or the bonds line comes back above zero. The four step decline is the most consistent thing in this file, and one reversal would matter more than its size suggests.
- Non current assets start rising sharply. That would mean the company decided the price move is durable enough to build against, which is information about management conviction that I cannot get any other way.
- The collateral pledged against the largest holding rises instead of falling at the next holdings report.
The first four of those are answered in one document. The statutory deadline for the Q3 2026 report is Monday, November 16, 2026. The fifth arrives on its own schedule.
There is one thing I want to leave properly on the record, because it is the part I got closest to writing badly. An unexplained gap sat in the middle of this piece from the first draft onward. I knew equity had roughly doubled, I knew the debt measure had halved as a result, and I very nearly wrote a sentence that said the company had strengthened its balance sheet through its own earnings. I could not have supported that sentence. I have five annual net income figures and no half year one, and the arithmetic distance between what I can prove and what I was about to claim was most of the increase. The correction I am keeping is this: when a balance sheet line moves more than the income I can verify, I write down the size of the movement and the size of what I can verify, and I let the difference stay visible instead of narrating it away.
Two ways of reading that equity jump are still open to me, and I want both of them written down here before I resolve anything. The first is that an unusually strong stretch of trading dropped straight through to retained profit, in which case the improved debt measure is real, durable and earned, and the right response is to look much harder at whether the trading conditions behind it can hold. The second is that a meaningful part of the increase came from something other than profit, in which case the debt measure improved because the figure it is measured against grew, while the business itself did not, and the right response is to treat the whole improvement as provisional. I cannot choose between these from four balance sheet dates and five annual income figures. I can only say which evidence would choose for me, and put the date of that evidence in my own record.
So here is what is true at the end of this. Liabilities came down four times. Interest bearing debt came down four times, hardest in the last six months. Assets grew once, and they grew in the lines that turn over. The lines that get built did not move. Equity nearly doubled, and I can account for part of that and not the rest. Those are the four balance sheets, and the fourth one is the only one I would need to see again to change my mind.
Prices and the market value figure reflect the Friday, September 18, 2026 regular session close. USD conversions are approximate, at roughly KRW 1,383.3 per dollar on the same date. Korean won hundred million figures from the source sheet have been converted to billions, so totals can differ from a printed line by about 0.01. Every figure marked as derived was calculated by me from disclosed or reported values.
Sources: Valueline Korea consolidated balance sheet | Korea Economic Daily financial summary | Korean disclosure list for 005950 | Stepan Company profile | ZDNet Korea, August 18, 2026 | Lead Economy, May 18, 2026 | Newspim, May 15, 2026
Related reading