Sam-A Aluminium Q2 Results: First Profit After Seven Losses
I opened the second quarter of 2026 for Sam-A Aluminium stock expecting one answer and got two that point opposite ways. The income statement says the quarter was good: operating profit of KRW 1.745bn ($1.2615m), the first positive quarter after seven negative ones. The cash flow statement says the quarter was the worst of the run: operating cash outflow of KRW 18.184bn ($13.1454m). The space between those two answers is KRW 19.929bn ($14.4069m), and one line on the balance sheet covers 83.7925% of it.
Sam-A Aluminium Company (KRX: 006110) rolls aluminium foil. It began in food packaging foil and still sells into it, but the part that moves the share price now is battery foil going into electric vehicle cells and, increasingly, into energy storage systems. At the 2026-09-18 close of KRW 60,100 ($43.4468) and 15,123,333 shares in issue, the company is worth KRW 908.912bn ($657.0609m). That places it outside the top 100 of the Korean market by value, which is where my own rule says I take no position. I hold none and I have no order in.
Every won figure here converts at KRW 1,383.3 per USD, the Seoul onshore close for 2026-09-18 as reported by Money Today and Asia Economy. One close for the whole piece.
Contents
What Sam-A Aluminium Stock Looked Like on One Closing Date
The price took a decision before anything else did. My indicator screen carries a current price of KRW 60,000 in one field and a latest close of KRW 60,100 in another. The daily series settles it: the row dated 2026-09-18 closes at KRW 60,100, carries a final flag of true, a market scope of the regular Korean exchange only, volume of 66,818 shares, and no provisional marking. I took the row that says it is final.
The same screen carries a market value of KRW 907.4bn. Divide that by 15,123,333 shares and you get KRW 59,993 per share, so that field was built on KRW 60,000. I did not use it. I multiplied KRW 60,100 by the share count myself and got KRW 908.912bn. The difference between the two is KRW 1.512bn, or 0.1664% of the market value, which changes nothing in this piece except that without saying which row I took, none of the multiples below could be rebuilt by anyone else.
The screen’s trailing figures were annual figures
The same screen labels revenue of KRW 271.5bn, operating loss of KRW 17.6bn and net loss of KRW 24.9bn as the most recent four quarters. Those three match full-year 2025 exactly: KRW 271.458bn, KRW 17.648bn and KRW 24.889bn. When I add the four quarters myself I get revenue of KRW 302.307bn, an operating loss of KRW 14.518bn and a net loss of KRW 22.554bn. Revenue alone is KRW 30.849bn apart. So every total and every multiple in this piece comes from quarterly regulatory filings that I added up, not from that screen.
Three Statements, One Quarter, Three Different Answers
Here is what each statement says about the three months to 2026-06-30, and I want to keep the three answers apart before I try to reconcile them.
| Where I asked | The answer it gives | The figure behind that answer |
|---|---|---|
| Income statement | Better | Operating profit KRW 1.745bn ($1.2615m), positive after seven negative quarters |
| Cash flow statement | Worse | Operating cash outflow KRW 18.184bn ($13.1454m), the deepest single quarter since 2022 |
| Balance sheet | Heavier | Inventory KRW 128.77bn ($93.089m), up KRW 40.898bn ($29.5655m) in six months |
| Sell-side estimate | Still far | Full-year 2026 operating profit of KRW 8.8bn needs KRW 11.442bn ($8.2715m) in the second half |
Four places, one question, and only one of the four says the quarter was good. I did not try to pick a winner. I measured how far apart the answers sit and then looked for the line that sits in the space between them.
One Balance Sheet Line Explains 83.7925% of the Gap
Operating profit of KRW 1.745bn minus operating cash of negative KRW 18.184bn leaves KRW 19.929bn ($14.4069m) unaccounted for in a single quarter. Inventory closed the first quarter of 2026 at KRW 112.071bn and the second at KRW 128.77bn, a rise of KRW 16.699bn ($12.0719m). Divide KRW 16.699bn by KRW 19.929bn and you get 83.7925%.
That leaves KRW 3.23bn spread across receivables, interest and tax. I did not open the interim notes far enough to split those three, so I am stopping there. A figure I cannot source does more damage to a reader than a hole I admit to.
This is not the first time the two lines have pointed opposite ways here, and that is the part I did not expect. Across the four full years I can reach, operating profit and operating cash agreed on sign twice and disagreed twice. In 2022, the best year in the series, operating profit was positive KRW 22.571bn while operating cash was negative KRW 13.032bn. In 2024 the signs crossed the other way: an operating loss of KRW 9.591bn sat next to positive operating cash of KRW 5.185bn. Only 2023 (positive KRW 3.77bn against positive KRW 13.798bn) and 2025 (negative KRW 17.648bn against negative KRW 4.974bn) had the two moving together.
A word on how the quarterly figures above were built, because none of them can be read straight off a filing. Korean interim reports carry flow items cumulatively, so the figure labeled second quarter is really the six months to June. To get a single quarter I take the cumulative figure and remove the previous cumulative figure: operating profit of negative KRW 2.642bn for the first half less negative KRW 4.387bn for the first quarter leaves positive KRW 1.745bn for the second. The cash line works the same way: negative KRW 33.076bn for the half less negative KRW 14.892bn for the first quarter leaves negative KRW 18.184bn. Fourth quarters never appear at all and have to be taken as the full year less the nine-month cumulative, which is how the negative KRW 7.489bn of Q4 2025 was obtained. Every single-quarter figure in this piece went through that step, and anyone checking me should redo it before checking anything else.
So a reader who treats Q2 2026 as an anomaly has the history against them. Two of the last four years ended with the cash line contradicting the profit line, and in the better of those two years the contradiction was larger in absolute terms than anything the loss run produced. What changed in Q2 2026 is not that the two lines split. It is that they split by KRW 19.929bn inside three months, where the 2022 split took twelve months to reach KRW 35.603bn.
What the 83.7925% does is turn a vague worry into a testable one. If the quarter’s profit was real and the cash simply went into goods waiting to be sold, the cash comes back when those goods ship. If the goods do not ship, the profit was an accounting event and the cash never returns. Those are different futures, and one line on one statement is where they separate.
The residual matters as much as the 83.7925%, so here is what I can say about it. KRW 3.23bn is left after inventory, and interest alone accounts for a large part: the first half carried KRW 2.191bn of interest expense against KRW 0.847bn in the first quarter, leaving KRW 1.344bn in the second. That takes the unexplained portion down to roughly KRW 1.886bn, which is small enough that receivables and tax can plausibly absorb it without anything unusual happening. What that ordering tells me is that there is no third surprise hiding in this quarter. The gap is inventory, then interest, then noise, in that order, and the first of the three is the only one large enough to argue about.
Sam-A Aluminium Stock and an Inventory Pile of KRW 128.77bn
Inventory went from KRW 87.872bn at the end of 2025 to KRW 128.77bn at 2026-06-30, a rise of KRW 40.898bn or 46.5427% against that KRW 87.872bn base. Against total equity of KRW 221.562bn ($160.1692m) it is 58.1194%, and against the market value of KRW 908.912bn it is 14.1675%.
Some of that build is what a recovery looks like. IB Tomato, reporting on the first quarter of 2026, wrote that foil division utilization rose from 50.3% in 2025 to 61.9% in the first quarter of 2026, a gain of 11.6 percentage points, and that battery makers were shifting lines toward storage systems. A plant running harder needs more material in front of it. The same report put trade receivables at KRW 45.5bn against revenue growth of 2%, and receivables growing ten times faster than the sales they come from is harder to read as a healthy build.
Raw material cost moved the same way. On the same report’s basis, the aluminium price went from $2,627 per tonne in the first quarter of 2025 to $3,571 in the second quarter of 2026, a rise of $944 or 35.9345%. An input that costs more lifts the carrying value of a pile that has not grown by a single tonne. I could not find a tonnage series for this company’s inventory, so I cannot tell you how much of the 46.5427% is volume and how much is price. I am leaving that unsplit.
I have met this pattern in neighboring names. Poongsan’s inventory was worth 94% of its market value, and EcoPro BM’s bottom line turned out to be 57% outside the parent. Korean materials companies carry heavy working capital, and the interesting question is rarely whether the pile is large.
Demand is the reason anyone builds the pile in the first place, and the demand figures are real enough to state. The April 2026 coverage put global new storage installations at 24.2GWh in March, up 33% year on year, and first-quarter installations at 68.5GWh, up 29%. Those two growth figures were given without the prior-year bases, so I backed them out myself: 18.2GWh for the month and 53.1GWh for the quarter. On the same estimates, storage was 17% of this company’s sales in 2025 and would reach 31% in 2026, with storage revenue growing 160%. A foil roller sitting in front of that shift has a defensible reason to carry more material than it did.
The counter-argument is about who holds the risk while the pile sits there. Equity at 2026-06-30 was KRW 221.562bn and inventory was KRW 128.77bn, so 58.1194% of what the owners have is goods that have not been sold. Set the market value of KRW 908.912bn against the KRW 22.571bn of operating profit this company earned in its best recent year and you get 40.269 times. That figure is not a valuation I am proposing. It is the size of the recovery already priced in, expressed against the only peak this company has actually delivered.
Seven Loss Quarters Behind Sam-A Aluminium Stock, and What One Profit Buys
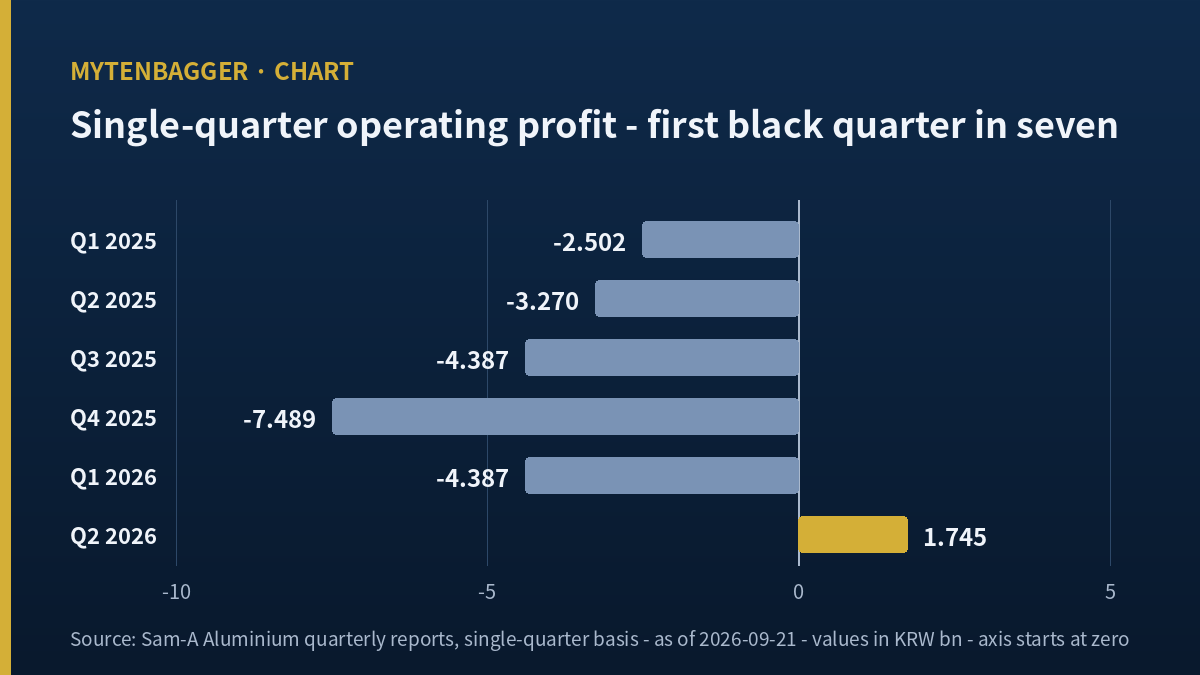
The loss run is exact. Single-quarter operating results, taken by splitting the cumulative figures in each filing: negative KRW 4.322bn in Q3 2024, negative KRW 4.036bn in Q4 2024, negative KRW 2.502bn in Q1 2025, negative KRW 3.27bn in Q2 2025, negative KRW 4.387bn in Q3 2025, negative KRW 7.489bn in Q4 2025, negative KRW 4.387bn in Q1 2026. They sum to KRW 30.393bn ($21.9714m). Q2 2024, the quarter before the run, was a positive KRW 0.4bn.
Divide KRW 30.393bn by the KRW 1.745bn earned in Q2 2026 and you get 17.4172. The unit is quarters, which is the part I care about. It says this company needs seventeen more quarters exactly like its best recent one to work off the KRW 30.393bn the loss run consumed, and seventeen quarters is four years and four months.
What the division does not measure
It does not say the shares are cheap or expensive. No market value enters it and no equity enters it. It uses one line of the income statement twice, once as a historical sum and once as a current quarter. So the number only holds while the current quarter is the best guide to the next one, and I will put a figure on that condition at the end.
The revenue line is why anyone would argue the condition already broke. Q2 2026 revenue reached KRW 96.925bn ($70.068m). Set against KRW 67.433bn in Q1 2026 that is a gain of KRW 29.492bn, or 43.7353%, and set against KRW 67.414bn in Q2 2025 it is a gain of KRW 29.511bn, or 43.7758%. Nothing in this company’s recent series moved that fast.
Cash, meanwhile, has been going the other way for longer than one quarter. SeAH Besteel Holdings spent ten quarters with capital projects running ahead of operating cash, and the funding worked the same way there: borrowing filled the space. Here, capital spending ran KRW 53.538bn in 2024, KRW 80.739bn in 2025 and KRW 9.767bn in the first half of 2026, KRW 144.044bn ($104.1307m) in total, while operating cash across those same periods added to negative KRW 32.865bn. Liabilities went from KRW 192.553bn at the end of 2024 to KRW 309.991bn ($224.0953m) at 2026-06-30, up KRW 117.438bn ($84.897m) or 60.99%.
Running the Same Division on Alcoa
I wanted to know whether 17.4172 is a number anyone can put in context, so I ran the identical division on a US peer. Alcoa Corporation (NYSE: AA) posted an operating loss of $32m in Q1 2024 and an operating profit of $140m in Q2 2024. Across the ten quarters I pulled, that was its only negative quarter, so its run was one quarter against seven here. I did not go further back than Q1 2024, so I am describing the window I looked at and not the company’s whole history. Divide $32m by $140m and the recovery measure is 0.2286 quarters, which is under three weeks.
17.4172 divided by 0.2286 is 76.2. I am not putting that spread forward as a verdict on either company. A 76-fold gap stops being a comparison and becomes evidence that the two situations do not sit on one scale. What the Alcoa figure does is tell me what an ordinary recovery measure looks like in this industry when the loss run is short. Against that, 17.4172 is not a number about Q2 2026 at all. It is a number about the seven quarters before it.
The domestic case I wrote up separately, rather than pulled in here, is Dongwon Systems, which ranked second on sales and last on profit. Its figures are not on this page — different industry, different inventory definition — but it is the nearer example of a Korean manufacturer whose standing changes depending on which line you sort by.
I took no Alcoa multiple and no Alcoa margin into this piece. The only thing I borrowed was the length of its loss run, and I chose it for that single property.
Sam-A Aluminium Stock Multiples I Rebuilt Myself
There is no price-to-earnings figure to give. The trailing four quarters carry a net loss of KRW 22.554bn, so the lower half of that fraction is negative, and my screen leaves the field at zero. The asset side still works.
Equity attributable to owners at 2026-06-30 was KRW 221.562bn against 15,123,333 shares, which is KRW 14,650.3420 ($10.5909) of net assets per share. At KRW 60,100 that is 4.1023 times book. My screen carries KRW 14,814 per share and 4.05 times, and I could not establish where its per-share figure comes from, so I am using mine. Hana Securities was quoted in April 2026 putting the multiple near 5 times, which belongs to the price on that date and not to this one.
Liabilities of KRW 309.991bn over equity of KRW 221.562bn is 139.91%. That one matched my screen’s own gearing field to two decimal places, which is the only cross-check in this piece that came back clean on the first attempt. Young Poong showed me how much of a metals company’s bottom line can sit outside operations, and it is worth saying that this company’s problem is the opposite: its operations are the whole story and there is nothing else carrying it.
Where the sell-side estimate sits against the halves
Two named houses cover the forward view. SK Securities analyst Park Hyung-woo wrote on 2026-04-10 that 2026 revenue would reach KRW 372.2bn and operating profit KRW 8.8bn, with utilization moving from 60% to above 90% in the second half. The note carried no rating and no valuation target, and listed weak battery customer shipments and raw material supply disruption as the risks. Hana Securities analyst Park Seong-bong was quoted on 2026-04-29 with 2027 operating profit of KRW 19.6bn and a 2027 return on equity of 5.7%.
First-half operating profit was negative KRW 2.642bn. To reach KRW 8.8bn for the year, the second half has to produce KRW 11.442bn ($8.2715m), which is 6.557 times the KRW 1.745bn of Q2 2026. On the same note’s revenue line, KRW 372.2bn for the year less KRW 164.358bn ($118.8159m) in the first half leaves KRW 207.842bn for the second, so the implied second-half operating margin is 5.5051%. The best full-year operating margin in the four years I can reach, 2022 through 2025, is 7.233% in 2022, so 5.5051% is reachable. It is also 3.7047 percentage points above the 1.8004% of Q2 2026, inside six months.
Where Sam-A Aluminium Stock Sits With Me, and What Would Move It
No holding, no order, watching. The seven-indicator checklist I run passes this company on revenue scale alone and fails it on operating margin, earnings per share, return on equity, price-to-earnings, price-to-book and positive operating profit. Dividends per share went KRW 250 in 2022, KRW 100 in 2023, KRW 25 in 2024 and KRW 25 in 2025, so at KRW 60,100 the yield is 0.0416% and the income case is closed.
I have grouped what could make me wrong by the document that would settle it, because three of these are answered by one filing and the rest are not answered by any filing at all.
Settled by the Q3 2026 report, due 2026-11-16. If single-quarter operating profit clears KRW 6bn, the recovery measure drops below 5.0655 quarters and my central figure is retired outright and not revised. If operating cash turns positive, the KRW 19.929bn gap was one quarter’s event and not a condition. If the KRW 45.5bn of receivables converts, the cause of that gap was collection timing and my inventory reading was the wrong axis.
Settled by a revised estimate, on no schedule. If the KRW 8.8bn full-year figure comes down, the KRW 11.442bn second-half requirement stops existing and the size of the cut becomes the number worth reading instead.
Settled by nothing I can watch. If aluminium falls back from $3,571 per tonne, both the carrying value of the pile and the cost of making the next tonne fall together, and the direction of my inventory section reverses. If part of the KRW 117.438bn liability increase is refinanced into equity, gearing of 139.91% drops and the balance sheet passage needs rewriting from the first line.
What I Will Look Up First About Sam-A Aluminium Stock in November
I will close by saying when this piece’s arithmetic expires. That is a different question from when its conclusion expires. The conclusion may well hold. The division will not.
17.4172 only exists while there is exactly one profitable quarter to divide by. A second one changes the lower number and the whole figure moves: KRW 30.393bn over KRW 3bn is 10.131 quarters, over KRW 6bn it is 5.0655, over KRW 9bn it is 3.377. Average the two profitable quarters instead and KRW 3bn gives 12.8105. So the way this piece fails is not that four years and four months turns out to be three years. It is that the division stops being worth running, and I think that outcome is the more likely of the two.
The legal filing deadline for the third quarter of 2026 is 2026-11-16. The first line I will open is operating profit, and I will not be checking whether it is positive. I will be checking whether the division above still has one quarter in it or two. The second line is operating cash flow, because KRW 19.929bn of disagreement between two statements either closes in one quarter or turns out to be how this company now runs.
Figures I checked and left out
First-half interest expense of KRW 2.191bn is larger than the KRW 1.745bn of operating profit in Q2 2026, which I verified and then declined to build a passage on, because setting a six-month cost against a three-month profit invites the reader to a comparison that does not hold. The Korea Exchange designated these shares a caution issue on 2026-04-23 and released the designation on 2026-05-13 with a re-designation notice attached, per Topstar News reporting the exchange filing; the stated release condition turned on the 2026-05-12 close holding under two thresholds set from earlier closes, one five sessions back and one fifteen sessions back. At KRW 60,100 the shares sit at 57.457% of the KRW 104,600 high of the past 250 sessions and 3.1632 times the KRW 19,000 low. I kept all of that out of the valuation work and recorded it as what an outside institution noted about the speed of the move. Inventory composition by item and an aging schedule for the KRW 45.5bn of receivables both needed interim notes I did not open.
Financial figures come from Korean regulatory filings, with the Q2 2026 interim report carrying filing number 20260814003238; the wording is my own rendering of Korean-language filings and Korean press, not a quotation of an English original. Price and share count are Kiwoom data on the final close of 2026-09-18. Peer figures are Alcoa’s own quarterly filings as tabulated by the source linked above.
Related reading