Binggrae Earnings Seasonality: Two Summer Quarters Carry the Year
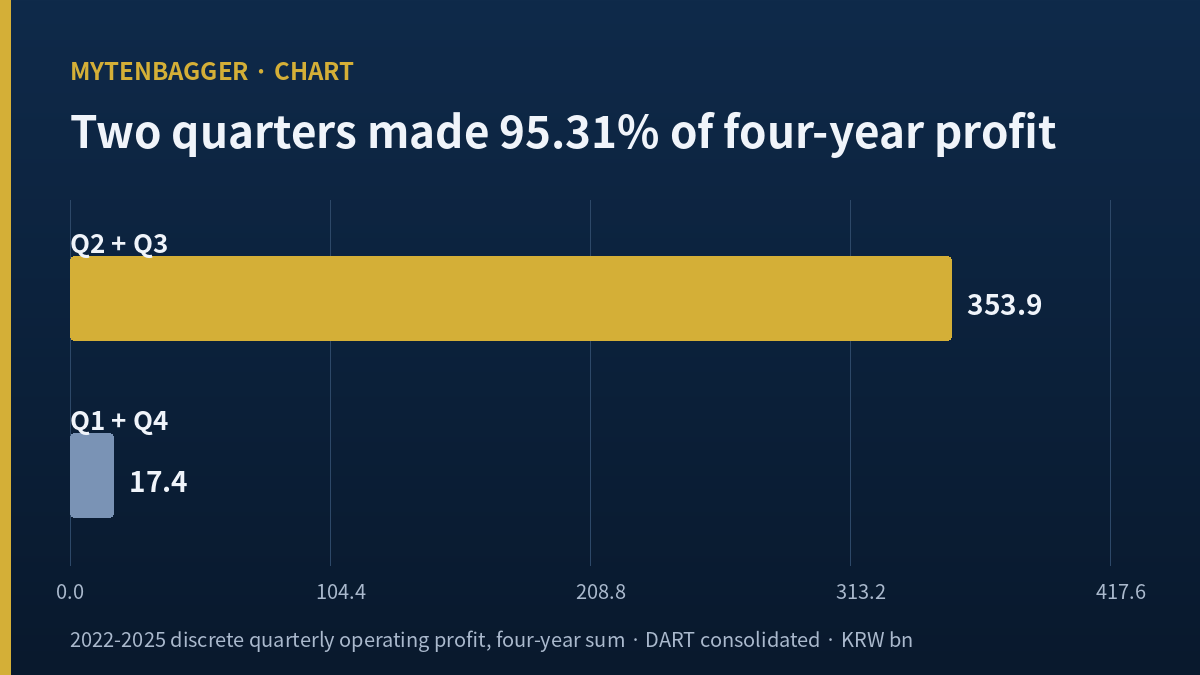
The most recent earnings figure anyone quotes about this company covers 15.6% of its year. That is the first thing I established before forming any view on Binggrae stock, and it changed what I bothered to look at. Binggrae (KOSPI: 005180) makes ice cream and dairy drinks in South Korea, and I had been reading its quarterly releases the way I read any other company’s, as if each one were a quarter of the story. For this business they are not. Over 2022 through 2025, the first and fourth quarters together produced KRW 17.4 billion of operating profit against a four-year total of KRW 371.3 billion. Half the elapsed time accounted for 4.69% of the profit (my calculation).
The rest came from the second and third quarters: KRW 353.9 billion, or 95.31%. So any statement about this company that is not a statement about its summer is a statement about 4.69% of its earnings. I built the rest of my reading around that.

Two halves of the same four years
Q1 + Q4, 2022 through 2025 | eight quarters | 50.0% of the elapsed time | KRW 17.4bn of operating profit | 4.69% of the four-year total
Q2 + Q3, 2022 through 2025 | eight quarters | 50.0% of the elapsed time | KRW 353.9bn of operating profit | 95.31% of the four-year total
Consolidated, from annual and quarterly filings on Korea’s DART electronic disclosure system. Korean quarterly income statements are cumulative, so I converted them to discrete quarters; Q4 is not filed separately and is derived as full year minus nine-month cumulative.
Contents
The four pieces I split Binggrae stock’s year into
Korea’s disclosure system publishes quarterly revenue and operating profit as year-to-date cumulatives. The KRW 99.2 billion of operating profit in the 2025 third-quarter filing is a nine-month figure; the three months of that quarter accounted for KRW 58.9 billion of it. To see discrete quarters I subtracted each prior cumulative, and for the fourth quarter, which Korean issuers do not file on its own, I took the audited full year and subtracted the nine-month cumulative. That derivation is the one number in this piece I could not check against an original filing, and I list it again among the ways I could be wrong.
| Operating profit, KRW bn | Q1 | Q2 | Q3 | Q4 | Full year | Q2+Q3 as % of year |
|---|---|---|---|---|---|---|
| 2022 | 1.59 | 21.07 | 25.77 | -9.02 | 39.41 | 118.86% |
| 2023 | 12.74 | 46.25 | 65.42 | -12.17 | 112.25 | 99.49% |
| 2024 | 21.05 | 44.91 | 64.68 | 0.63 | 131.28 | 83.48% |
| 2025 | 13.45 | 26.83 | 58.93 | -10.85 | 88.36 | 97.06% |
Four things stand out to me in that grid. The fourth quarter has been a loss in three of the four years. The first quarter has never once exceeded KRW 21.1 billion. The third quarter has never once fallen below KRW 25.8 billion. And in 2022 the off-season quarters were so negative that the summer had to produce 118.86% of the year to get the total back to positive.
Add the eight off-season quarters and you get KRW 17.4 billion. Divide by the four-year total of KRW 371.3 billion and you get 4.6921%, which I round to 4.69% (my calculation). At the exchange rate footnoted below, that is roughly USD 12.3 million of profit out of USD 261.8 million, produced across half of four years.
Where the 2025 shortfall actually sat
Consolidated 2025 revenue was KRW 1,489.6 billion, up 1.81%. Operating profit was KRW 88.4 billion, down 32.69%. In money, the top line grew KRW 26.5 billion in a year when operating profit fell KRW 42.9 billion. The operating margin went from 8.9727% to 5.9316%, a compression of 3.0411 percentage points (all consolidated, from Korean filings; ratios are my calculation).
| Quarter | 2024 | 2025 | Change, KRW bn | Share of the shortfall | Change, % |
|---|---|---|---|---|---|
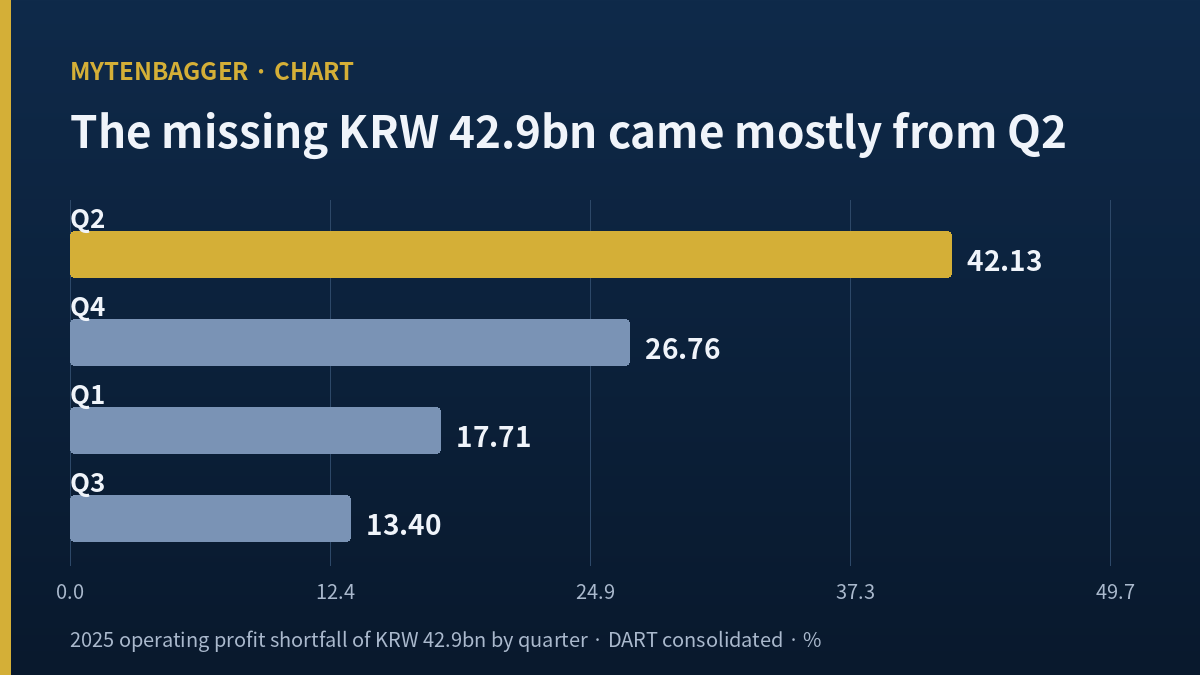
| Q1 | 21.05 | 13.45 | -7.60 | 17.71% | -36.10% |
| Q2 | 44.91 | 26.83 | -18.08 | 42.13% | -40.26% |
| Q3 | 64.68 | 58.93 | -5.75 | 13.40% | -8.89% |
| Q4 | 0.63 | -10.85 | -11.48 | 26.76% | to a loss |
The summer quarters together account for 55.53% of the shortfall (my calculation), and inside that, the second quarter alone carries 42.13%.
Now the part that cuts against me, which I want on the page before anyone else puts it there. A quarter that earns more will also lose more in absolute terms. Some of the 42.13% is arithmetic doing the work, and carries no information about the business. Measured in percentages the first quarter fell 36.10% and the second fell 40.26%, which is close to the same damage. Only the third quarter, down 8.89%, genuinely held up. So I cannot claim the summer broke while the rest of the year was fine.
What I can claim is that percentages are not what I would be buying. A 36% decline in the first quarter removes KRW 7.6 billion. A 40% decline in the second removes KRW 18.1 billion. Equal-looking damage lands with more than twice the weight depending on which piece of the year it happens in, and I would rather know which piece than know the average.
A full-year explanation for a year that was not even
When the 2025 results were released on January 23, 2026 (Fri), a company official said the decline came from “rising raw and subsidiary material prices and cost increases from the expanded scope of ordinary wages,” adding that this reflected “changes in the external environment commonly experienced across the industry.” That is Korean press reporting a Korean-language statement, and I am relaying it in translation, so treat the wording as mine and the substance as theirs (Etoday, January 23, 2026).
DS Investment Securities analysts Jang Ji-hye and Kang Tae-ho described the fourth quarter in a March 9, 2026 (Mon) note as reflecting “input cost burdens, the ordinary wage adjustment, higher gold prices, and a Homeplus impairment,” with the full year hit by “domestic consumption weakness, raw material burdens, and rising personnel-related costs through the year” (DS Investment Securities note, in Korean). Homeplus is a Korean hypermarket chain that entered court receivership, and the impairment refers to receivables from it.
I have no material with which to dispute either account. What I notice is that both are full-year descriptions. Input costs and a wage-scope change operate across twelve months; they are not switches that flip for three of them. Yet the damage was not spread evenly. The third quarter came through nearly intact and the fourth quarter went to a loss. When a full-year cause is set beside a quarterly grid, the grid tells me something the cause does not, which is when the money left.
One more item overlaps here, and I flag it as an allegation that has not been settled. On February 9, 2026 (Mon), Korea’s National Tax Service said it had examined 53 companies for profiteering that fed price instability, uncovering KRW 389.8 billion of evasion and assessing KRW 178.5 billion. This company was assessed in the KRW 20 billion range. The agency’s finding, as reported by Yonhap News Agency, was that it “overpaid KRW 25 billion in logistics fees to a related party to channel profit to it,” and that the resulting cost increase “led to a 25.0% product price increase” (Yonhap, February 9, 2026). Revenue that year grew 1.81%. A price increase on one side and almost no revenue growth on the other, in the same company over the same period, with a third of operating profit gone. I keep those three facts on one line and draw no conclusion from them yet.
Binggrae stock is priced on a quarter worth 15.6% of a year
The 2026 first quarter was filed on May 15, 2026 (Fri). Revenue was KRW 312.4 billion, up 1.26%. Operating profit was KRW 13.8 billion, up 2.28%. The operating margin was 4.4046% against 4.3604% a year earlier, an improvement of 0.0442 percentage points (Korean filings, consolidated; ratios are my calculation). The company said exports to the United States, China and Vietnam grew while the domestic market stayed soft, and that operating profit rose “on management efficiency and higher overseas profit despite short-term costs including higher personnel expenses from the Haitai Ice merger and continuing input cost pressure.” Domestic revenue was KRW 233.2 billion, down 2.4%; exports were KRW 53.4 billion, up 15.8%; and ice cream and other exports were KRW 32.5 billion, up 23.3% (ZDNet Korea, May 15, 2026).
There is real content in that quarter. Exports grew at a double-digit rate and margin held while domestic volume shrank. As news it reads well.
But KRW 13.8 billion is 15.57% of the 2025 full-year operating profit (my calculation), and the year-over-year improvement inside it was KRW 0.3 billion, or 0.35% of a year. A quarter of the calendar has passed and 15.6% of the profit has passed with it. I do not read that as a bad quarter. I read it as a quarter that cannot settle the year. And the export line comes with a limit I have run into before: revenue is disclosed by region while profit is not, so I cannot tell what the growth is worth. I ran into the same gap at Nongshim, where seven overseas markets appear on the revenue side and none on the profit side.
Two brokers, one quarter, a gap of KRW 6.1 billion
Two named Korean sell-side notes cover this company, and both are worth reading against the grid above.
IBK Investment Securities analyst Kim Tae-hyun published on November 17, 2025 with a buy view and a KRW 95,000 valuation, against a share price of KRW 75,300 on November 14, 2025. That note carried 2026 quarterly operating profit estimates of KRW 17.5 billion, KRW 32.6 billion, KRW 63.4 billion and negative KRW 0.3 billion, with a full year of KRW 1,606.0 billion of revenue and KRW 113.0 billion of operating profit.
DS Investment Securities analyst Jang Ji-hye published on March 9, 2026 (Mon), keeping a buy view while moving the valuation from KRW 130,000 to KRW 100,000, a KRW 30,000 markdown the note put down to “a reduction in 2026 estimates” (Alphabiz, March 9, 2026). The share price the note worked from was KRW 76,400 on March 6, 2026 (Fri), and the multiple applied was 12 times. That note put the 2026 first quarter at KRW 13.9 billion and the second at KRW 28.1 billion, with a full year of KRW 1,540.0 billion of revenue and KRW 96.8 billion of operating profit.
Between the two, on March 27, 2026 (Fri), IBK previewed the first quarter at KRW 310.9 billion of revenue and KRW 7.8 billion of operating profit, calling it “below consensus,” and kept the KRW 95,000 valuation (Etoday, March 27, 2026).
The quarter came in at KRW 13.8 billion. Set against that:
- IBK moved its own first-quarter estimate from KRW 17.5 billion in November 2025 to KRW 7.8 billion in March 2026, a reduction of 55.43% in about four months (my calculation).
- The actual result exceeded that reduced estimate by 76.40% (my calculation).
- DS, at KRW 13.9 billion, missed by 1.01% (my calculation).
- The two houses were KRW 6.1 billion apart on the same quarter, equal to 44.33% of what the quarter actually earned (my calculation).
I am not scoring the analysts. What interests me is the same thing that kept me cautious on HK inno.N: the figure everyone argues over is not always the figure that decides the outcome. The point here is about weight. A KRW 6.1 billion disagreement about the first quarter equals 6.9% of a full year of operating profit at the 2025 level (my calculation), so being badly wrong there barely moves the annual number. The same two houses are KRW 4.5 billion apart on the second quarter, and the second quarter produced 30.37% of the 2025 year (my calculation). Identical-sized errors carry very different consequences depending on which piece of the year they sit in. That asymmetry is why I built the grid instead of reading the headlines in sequence.
What August 14 settles for Binggrae stock
Korean issuers must file a half-year report within 45 days of the period end. This company filed its 2025 half-year report on August 14, 2025, and the statutory deadline for the 2026 edition is August 14, 2026 (Fri). Subtract the first-quarter cumulative from the half-year cumulative and the discrete second quarter falls out. That subtraction is the entire position described here.
| Second-quarter operating profit | KRW bn | Source |
|---|---|---|
| 2024 actual | 44.91 | Korean filings, discrete |
| 2025 actual | 26.83 | Korean filings, discrete |
| 2026 estimate | 28.10 | DS Investment Securities, March 9, 2026 |
| 2026 estimate | 32.60 | IBK Investment Securities, November 17, 2025 |
My thesis fails on a specific reading. If the discrete second quarter of 2026 comes in at or below KRW 26.83 billion, this company has lost two consecutive summers, and the question I should be asking stops being “the year is two quarters” and becomes “those two quarters are not what they were.” If it clears KRW 26.83 billion and lands inside the KRW 28.1 to 32.6 billion band the two houses set, the piece stands as an observation and I wait on the third quarter the same way.
Worth naming what is different about that test. I am not waiting on a full-year result. I have had the opposite problem before, at Studio Dragon, where a good quarter arrived and I could not separate what had caused it; here the separation is easy and the wait is the hard part. The unit I have chosen to be judged on is one quarter, because for this company the annual figure is four unlike things pressed into one cell, and a compressed number tells me direction without telling me origin.
Binggrae stock beside a maker whose summer carries different quarter numbers
For a global comparison I picked Morinaga & Co (TYO: 2201), and the reason is narrow. I did not want a company that resembles this one. I wanted a company that sells into the same season but starts its fiscal year at a different point, so the same weather is filed under different quarter numbers. Morinaga closes its books in March, which puts April to June in its first quarter and July to September in its second. Its summer is Q1 and Q2. Binggrae’s summer is Q2 and Q3.
| Morinaga operating profit, JPY m | Q1 (Apr to Jun) |
Q2 (Jul to Sep) |
Q3 (Oct to Dec) |
Q4 (Jan to Mar) |
Summer share |
|---|---|---|---|---|---|
| FY ended March 2025 | 6,738 | 7,109 | 5,566 | 1,830 | 65.18% |
| FY ended March 2026 | 7,099 | 6,244 | 6,256 | 2,800 | 59.57% |
Morinaga’s summer produces 59.57% and 65.18% of its operating profit (my calculation). Binggrae’s produced 97.06% and 83.48%. Seasonal concentration is a property of the category, and the Japanese company confirms that. What it also shows is that Binggrae sits at a far end of that distribution, a long way from where the Japanese company lands.
The off-season is where they separate most. Morinaga’s winter quarter contributed 8.61% and 12.50% of the year. Binggrae’s winter quarter subtracted 12.28% from the 2025 year (my calculation). One company earns a little in its quiet months; the other gives some back. Why that differs would take a breakdown of product mix and fixed-cost structure I do not have, so I am not using this table to rank the two businesses. I am using it to establish that the concentration figure has a range at all, and that Binggrae’s reading sits near the edge of that range.
Three limits on the comparison. The fiscal-year offset means the two companies’ quarters labeled “first” are different seasons, which is the point of the table and also the reason it should not be read column against column. Morinaga carries a larger confectionery mix while Binggrae is weighted to ice cream and dairy drinks, and mix changes how concentrated a year gets. And the Morinaga figures are screen values from a third-party financial data provider, and I did not check them against Japanese original filings. For scale, JPY 22,399 million of operating profit in the year ended March 2026 is roughly USD 141 million.
Numbers I left out of the Binggrae stock case
The P/E of 12.02, and the two share counts behind it
I removed the multiple entirely. On March 11, 2026 (Wed) the company resolved to cancel 286,672 treasury shares, about 3% of shares issued, worth roughly KRW 6.4 billion, with a cancellation date of March 26, 2026 (Thu) and no reduction in paid-in capital (Newsway, March 11, 2026). Add the canceled shares to the 9,268,786 on my data screen and you get 9,555,458 before the cancellation; 286,672 divided by that is 3.0001%, which matches the reported figure (my calculation).
The trouble is that the screen uses both counts at once. The KRW 641.4 billion market value reproduces exactly as KRW 69,200 times 9,268,786, the post-cancellation count. The screen’s precise earnings per share of KRW 5,757.07, however, sits within 0.02% of trailing twelve-month net income of KRW 55.0 billion divided by the pre-cancellation 9,555,458 shares, which gives KRW 5,755.87, and is about 3% away from the post-cancellation KRW 5,933.89. Recomputed on the current count the P/E comes out at 11.66 against the 12.02 on screen (all my calculation). A 3% difference does not reverse anything, but once two cells of the same screen are running on different share counts I will not build an argument on the multiple. I have passed on a multiple before for the opposite reason, when there was no net income to put underneath it at all. This time the number exists and I am still leaving it out.
The 4.71% dividend yield
Korean filings show the declared dividend at KRW 3,300 per share for both 2024 and 2025, after KRW 2,600 in 2023 and KRW 1,500 in 2022. Holding the cash amount in a year when net income fell 46% is information in itself, and IBK made that point in its March 27, 2026 briefing. But the dividend is a consequence of what the summer produced, and tells me nothing about how the summer went, so it sits outside this piece. The screen’s payout ratio also disagrees with itself across two fields, 57.3% against 51.9%, and I used neither.
Negative first-quarter cash flow
Operating cash flow in the 2026 first quarter was negative KRW 10.4 billion and free cash flow negative KRW 22.3 billion. I left both out because they say the same thing my grid already says. Across 2022 through 2025 the first quarter produced positive operating cash flow exactly once, in 2024, and only by KRW 0.06 billion. A negative first quarter is the seasonal norm at this company. For the full year 2025, operating cash flow was KRW 114.3 billion and free cash flow KRW 63.2 billion, both positive.
Market and sector returns
Over the 243 trading days from August 11, 2025 to August 10, 2026 the shares fell 11.17%. The KOSPI rose 96.45% and the Korean food sector, equal-weighted and excluding this name across 77 constituents, fell 10.94%. That is a 107.62 point deficit against the index and a 0.23 point difference against the sector, which is effectively a tie. Decomposing the excess return puts 99.8% of it on the sector and almost nothing on the company, the highest sector share I have measured. On a market-value-weighted sector basis the comparison flips to a 6.06 point deficit, so I am recording both weightings instead of picking the flattering one. Within the sector the name ranks 38th of 77, and the sector median return was negative 12.54%. Beta against the index was 0.135. None of this entered my case; a beta that low against an index that rose 96% mostly tells me the two are not moving together.
Seven places I could be wrong
- Four years is a thin sample, and 2022 was an outlier inside it. The 2022 operating margin was 3.11% against 8.05%, 8.97% and 5.93% in the three years after. Drop that year and the off-season contribution becomes KRW 24.9 billion against KRW 331.9 billion, or 7.49% (my calculation). The 4.69% headline moves with the sample.
- The fourth-quarter figures come from my own subtraction and were never filed on their own. Korean issuers do not file a discrete fourth quarter, so I computed full year minus nine-month cumulative. I did not reconcile that line by line against the annual report’s own quarterly statements, and it is the only figure here without an original-filing check.
- Large quarters lose large amounts by construction. The second quarter holding 42.13% of the shortfall is partly arithmetic. In percentage terms the first quarter’s 36.10% decline is close to the second quarter’s 40.26%.
- The Haitai Ice merger completed on April 1, 2026 (Food and Beverage News, in Korean). From the 2026 second quarter the comparison base itself may change, which would alter what KRW 26.83 billion means as a test.
- I could not confirm when the tax assessment was recognized. The KRW 20 billion range assessment was announced on February 9, 2026 (Mon) and the annual report was filed on March 18, 2026. I do not know whether it sits in the 2025 accounts or in 2026, and its relationship to the KRW 25.7 billion fourth-quarter net loss is unresolved.
- There are two 2025 net income figures. Reporting at the January 23 release put it at KRW 56.9 billion, down 44.9%; the March 18 annual report shows consolidated net income of KRW 55.6 billion, down 46.17%. I could not establish which one is the controlling-interest measure, so I am giving both.
- The share count moved within the last five months. That is why the multiples are out, and it is also why I excluded the brokers’ per-share earnings estimates from every calculation here, since I could not confirm which share count they were struck against.
Four corrections, and the one subtraction they leave
A screener I ran in April is what put this company in front of me, and the cell that caught my eye was a P/E near 12 on a company that had just reported a growing quarter. I spent a week on it before noticing that the growing quarter was worth 15.57% of a year and that the growth inside it was KRW 0.3 billion. That is the mistake I am documenting here: I let a quarterly headline stand in for an annual read, on a business where a quarter is not a quarter of anything. The direction is fine. The size is small.
The second correction is what the other six months actually do. Revenue continues; 2025 fourth-quarter revenue was KRW 292.2 billion. Profit is what stops. Fixed costs and payroll run through all twelve months while ice cream sales do not, which is why the off-season operating margin goes negative. That pattern belongs to the category more than it belongs to this company.
The third is the test itself, and it is narrow on purpose. Half-year cumulative operating profit minus the KRW 13.8 billion first-quarter cumulative. Whether that number is above or below KRW 26.83 billion is the whole test. Revenue and margin come afterward.
The fourth is the multiple I refuse to quote from the screen. The 12.02 P/E sits on earnings per share calculated on the pre-cancellation share count while the market value above it uses the post-cancellation count. Recomputed consistently the multiple is 11.66. The gap is around 3% and changes no conclusion, but I do not want a mixed-basis number holding up an argument.
I am watching, and what I am watching is one quarter. What changed for me on this company is not which document I wait for but how much of a year I am willing to let a single figure stand for. On August 14, 2026 (Fri) I will do one subtraction, and that subtraction is the entire position.
Prices, market value and multiples reflect the August 10, 2026 (Mon) close as I checked them at the time of writing, from a Korean market data vendor with a screen timestamp of 20:13 that evening. Earnings figures are consolidated, from annual and quarterly filings on Korea’s DART system, with discrete quarters converted from the cumulative filings. The Korean won is the currency this piece works in; USD amounts are approximate, at roughly KRW 1,418.4 per US dollar, the August 10, 2026 onshore session close reported by Financial News, which also carried the JPY cross used for the Morinaga conversion at KRW 895.31 per 100 yen. Sell-side valuations quoted here are those firms’ published judgments, reported here as fact; none of them are mine.
- Maeil Dairies Outlook as US Dairy Tariffs Reach Zero in Korea
- KT Corp Q2 Earnings: Five Ways to Score One Korean Telco Quarter