ENCell Earnings: Costs That Ignore Sales, Plus a Convertible Bond
A contract manufacturer with four billion dollars of annual revenue reported a net loss equal to 5.96 percent of that revenue. ENCell stock, which Korean filings also place under contract manufacturing, carries a net loss equal to 306.35 percent of its revenue. The gap between those two ratios is 51.39 times, and working out why it exists is what decided which tools I could use on this company and which ones I had to put down.
The Korean company closed at KRW 5,970 on Tuesday, August 18, 2026, for a market value of KRW 65.8 billion, or about USD 46.57 million. It trades on KOSDAQ, the junior board of the Korea Exchange, which lists smaller and earlier stage companies than the main KOSPI board and carries the volatility that goes with that. The stock sits 71.5036 percent below its 250 day high of KRW 20,950.
| Range across six quarters | Low | High | Ratio |
| Revenue | KRW 0.308bn | KRW 2.092bn | 6.7922x |
| Operating loss | KRW 3.721bn | KRW 5.509bn | 1.4805x |
| Net loss over revenue, FY2025 | CRL 5.9615% | ENCell 306.3522% | 51.3884x apart |
Separate financial statements, six quarters from the fourth quarter of 2024 through the first quarter of 2026. Quarterly flow items were converted from cumulative DART filings back to single quarter figures, and the two fourth quarter columns are annual totals less nine month cumulative figures. Peer data from stockanalysis.com as of August 18, 2026. All KRW to USD conversions in this article use KRW 1,413.0 per dollar, the Seoul session close on August 18, 2026.
Contents
What ENCell Stock Actually Sells
ENCell listed on KOSDAQ in August 2024. It runs two things at once. The first is a contract development and manufacturing business that produces other companies’ cell and gene therapies on its own culture platform. The second is a proprietary pipeline built around EN001, a candidate for Charcot Marie Tooth disease type 1A, which holds orphan drug designation from both the US Food and Drug Administration and the European Medicines Agency.
Full year 2025 revenue was KRW 5.258 billion, about USD 3.72 million. That is not a typo carried over from a quarterly column. It is the annual figure for a company the market values at USD 46.57 million.
| Quarter | Revenue | Operating loss | Operating cash flow |
| Q4 2024 | KRW 2.092bn | KRW 5.509bn | minus KRW 2.769bn |
| Q1 2025 | KRW 1.093bn | KRW 4.767bn | minus KRW 1.814bn |
| Q2 2025 | KRW 1.178bn | KRW 4.475bn | minus KRW 3.325bn |
| Q3 2025 | KRW 1.546bn | KRW 3.721bn | minus KRW 1.627bn |
| Q4 2025 | KRW 1.441bn | KRW 4.940bn | minus KRW 3.432bn |
| Q1 2026 | KRW 0.308bn | KRW 4.870bn | minus KRW 2.998bn |
ENCell Stock Costs Ignore the Sales Line Entirely
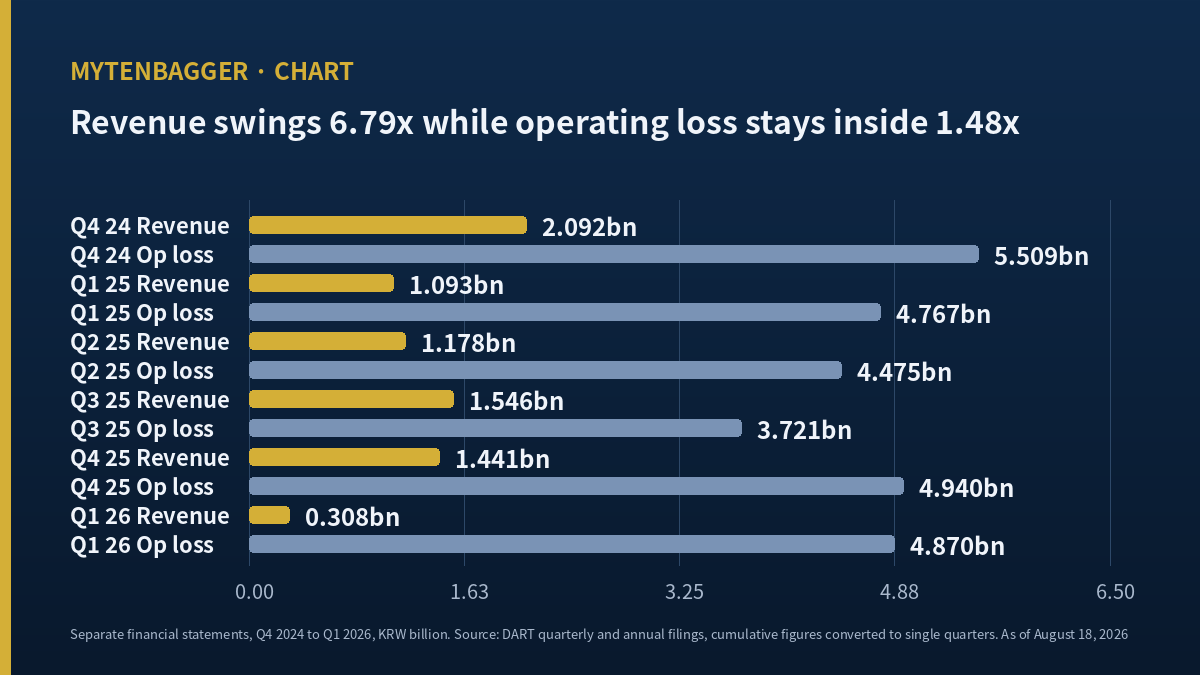
Set the six quarters side by side and two ranges appear. Revenue moved between KRW 2.092 billion at the high and KRW 0.308 billion at the low, a 6.7922 times range. Over the same six quarters the operating loss moved between KRW 5.509 billion and KRW 3.721 billion, a 1.4805 times range. The coefficient of variation is 42.2663 percent for revenue and 11.4685 percent for the operating loss.
I sat with 6.7922 and 1.4805 for a while. If the top line of an income statement moves almost seven fold while the result underneath it stays inside one and a half, the top line is doing very little of the work. Whatever quarterly spending this company does, it goes out at roughly the same size whether KRW 2 billion of revenue arrives or KRW 0.3 billion does.
The annual figures say the same thing more plainly. Revenue fell 27.0634 percent in 2025, from KRW 7.209 billion to KRW 5.258 billion. Operating cash flow over the same two years moved from minus KRW 10.099 billion to minus KRW 10.198 billion, a change of KRW 0.099 billion or 0.9803 percent. A quarter of the revenue disappeared and the cash leaving the operating line barely noticed.
Contract manufacturing normally works the other way around. An order arrives, materials and labor go in, a margin comes out, and when orders thin the variable costs thin with them. Korean trade press reported in April 2025 that the company attributed a drop in domestic contract manufacturing orders to a prolonged doctors’ strike and to client trial delays, and put 2024 contract manufacturing revenue at KRW 6.6 billion domestic and KRW 0.5 billion overseas. If order flow really does swing with client trial calendars, then the revenue line here is a schedule artifact and a poor instrument for reading the business.
ENCell Stock Next to a US-Listed Contract Manufacturer
To see how unusual that pattern is I put the company next to Charles River Laboratories, a New York listed research and manufacturing services group that runs its own cell and gene therapy manufacturing arm. I chose it on a basis I had not used before in this journal, which is that both companies describe themselves the same way and the degree to which revenue covers the loss differs by two orders of magnitude.
| As of August 18, 2026 | Charles River (NYSE CRL) | ENCell (KOSDAQ 456070) |
| Market value | USD 13.73bn | USD 46.57m |
| Revenue | USD 4.00bn trailing | USD 3.72m FY2025 |
| Net loss | USD 238.46m | USD 11.40m |
| Net loss over revenue | 5.9615% | 306.3522% |
Charles River figures from stockanalysis.com, quoted as of 10:36 AM EDT on August 18, 2026: share price USD 287.53, shares outstanding 47.74 million, trailing EPS minus USD 4.88, trailing revenue growth minus 0.7 percent. Price times share count reproduces the USD 13.73 billion market value. The reported net loss divided by the current share count gives minus USD 4.995 per share against the quoted minus USD 4.88, a 2.30 percent difference that most likely reflects a weighted average share count in the earnings figure. ENCell figures are DART filings converted at KRW 1,413.0 per dollar.
Charles River is 294.84 times the market value of the Korean company and roughly 1,075 times its revenue. Neither company has a trailing price to earnings ratio, because both posted a net loss. The difference that matters to me is the last row. At Charles River the loss is a dent in a revenue base that funds the business. Here the revenue base is a rounding item against the loss.
That single row tells me which instrument to put down. A revenue multiple is a reasonable starting point for the first company. For the second, the only multiple I can compute is market value over sales, which comes to 12.5143 times on FY2025 revenue by my own division, and it rests on a line that swings 6.79 fold between quarters. I have written before about license revenue that arrives in lumps and cannot be annualized, in my Yuhan Corporation entry, and about a royalty rate that capped a whole valuation in my Alteogen entry. Both of those companies at least had a revenue line worth arguing about. This one does not give me that much.
ENCell Stock Equity Fell About KRW 2.6 Billion a Quarter
So I look at the balance sheet instead. Where revenue moved 6.79 fold, this line moved with far more regularity.
| Date | Total equity | Change from prior quarter |
| December 31, 2024 | KRW 48.168bn | starting point |
| March 31, 2025 | KRW 43.888bn | minus KRW 4.280bn |
| June 30, 2025 | KRW 40.131bn | minus KRW 3.757bn |
| September 30, 2025 | KRW 36.446bn | minus KRW 3.685bn |
| December 31, 2025 | KRW 39.403bn | plus KRW 2.957bn |
| March 31, 2026 | KRW 34.957bn | minus KRW 4.446bn |
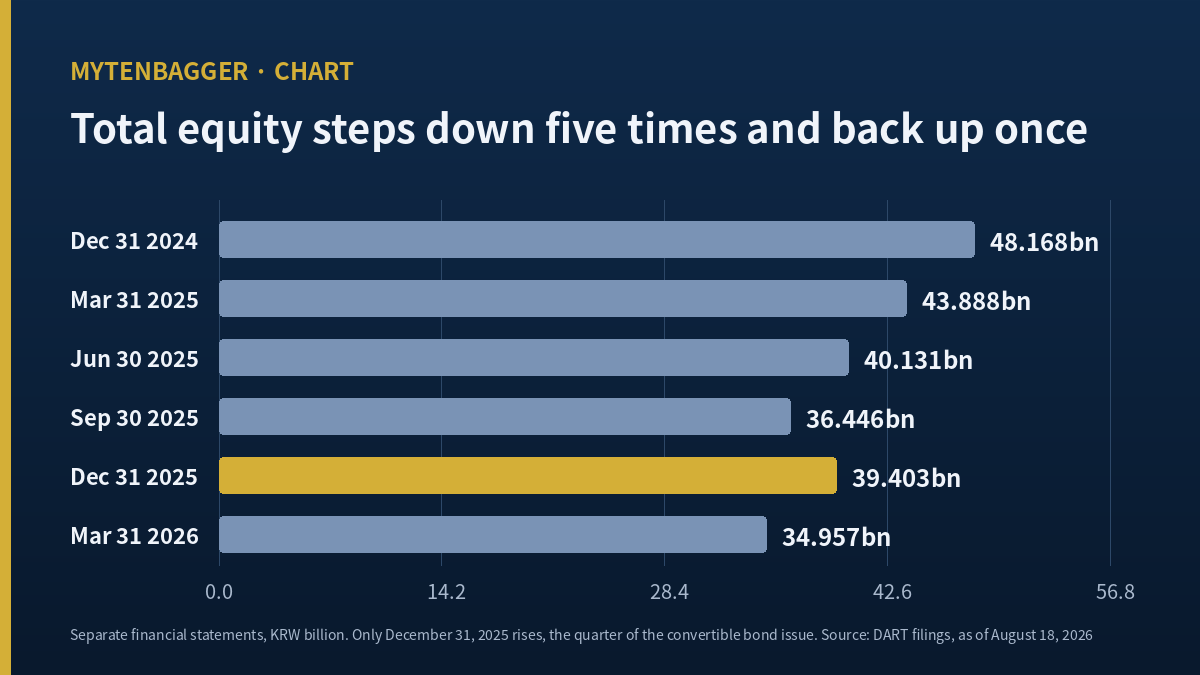
Total equity fell from KRW 48.168 billion at the end of 2024 to KRW 34.957 billion at the end of the first quarter of 2026. That is KRW 13.211 billion over five quarters, an average of KRW 2.6422 billion per quarter, or about USD 1.87 million. Divide the KRW 34.957 billion that remains by that average and the answer is 13.23 quarters, roughly 3.31 years.
The division has an obvious limit. Total equity is not cash. Of KRW 60.355 billion in total assets I could not confirm how much sits in cash and equivalents, because I was unable to open the quarterly filing itself. So 13.23 quarters is an arithmetic ceiling on how long equity lasts at the observed pace, and it is not a cash runway. I still prefer it to a sales growth rate for this company, for the plain reason that this line moves by a similar amount each quarter and the revenue line does not.
A Convertible Bond Priced at 2.39 Times the August 18 Close
One date in that table runs the other way. Equity at December 31, 2025 was KRW 2.957 billion higher than three months earlier, in a quarter that produced a net loss of KRW 3.526 billion. Covering that loss and still finishing higher requires roughly KRW 6.483 billion of inflow. I did not read that figure in a filing. I backed it out of two equity balances and the quarterly result.
Total liabilities moved in the same quarter, from KRW 7.647 billion at the end of September to KRW 24.309 billion at the end of December, an increase of KRW 16.662 billion. Add the liability increase to the equity inflow I backed out and the total is KRW 23.145 billion, which sits KRW 0.645 billion away from the KRW 22.5 billion convertible bond that Korean press reported on December 4, 2025. Other capital movements in that quarter make an exact match unlikely, and I take the two as pointing at the same event.
The reported terms are a first series unsecured private placement convertible bond, KRW 22.5 billion in size, conversion price KRW 14,295, 1,573,976 shares issuable on conversion, a conversion window running from December 12, 2026 to November 12, 2030, and maturity on December 12, 2030. The coupon, the yield to maturity, the subscribers, and any early redemption schedule were absent from that report and I did not confirm them elsewhere.
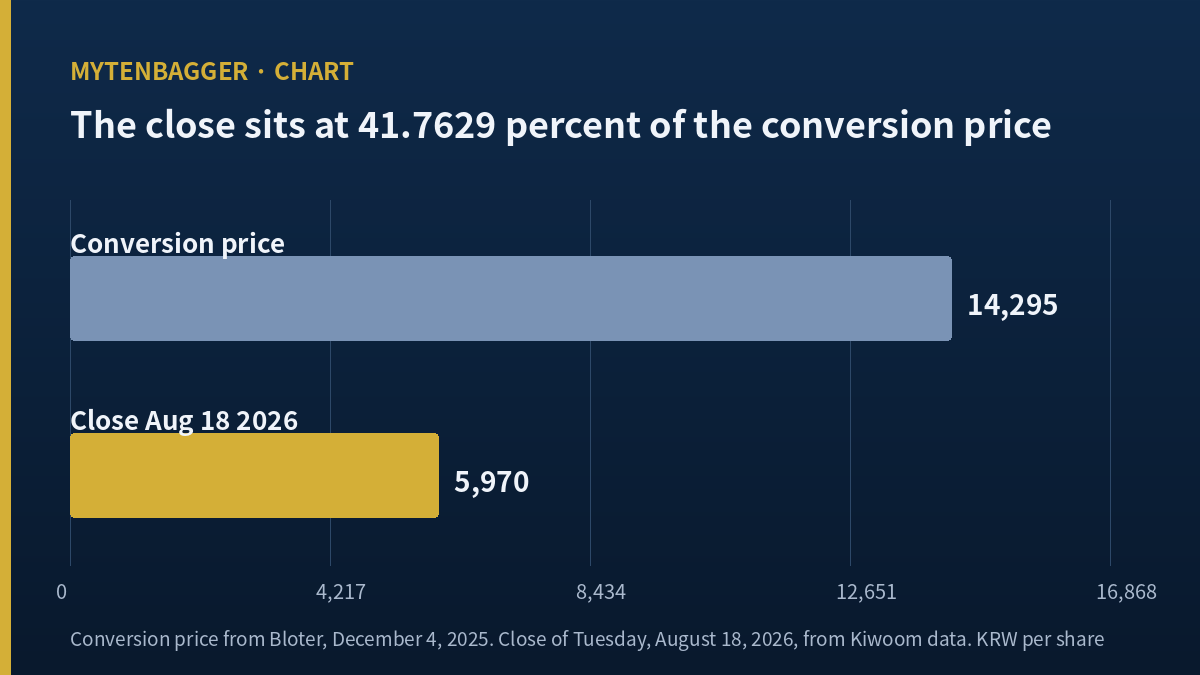
The conversion price is where my attention went. KRW 14,295 is 2.3945 times the August 18 close of KRW 5,970, which puts the close at 41.7629 percent of the conversion price. In dollar terms that is USD 10.12 against USD 4.23. The conversion window does not even open until December 12, 2026, and if the share price is anywhere near where it sits now when it does, holders have little reason to convert. The KRW 22.5 billion therefore stays in the liability column for the time being, which is where the first quarter of 2026 interest expense of KRW 0.604 billion comes from. That single quarter reached 90.4192 percent of the KRW 0.668 billion the company paid in interest across all of 2025.
The 1,573,976 shares are 14.2806 percent of the 11,021,776 shares outstanding by my own division. The press report used 12.62 percent, which is closer to a count taken after conversion. Either way the dilution is double digit, and I note it mainly so I remember that every multiple quoted above is a pre-dilution figure.
No Analyst Covers ENCell Stock at All
This is the part of the work I spent longest on. I keep a rule that I want forward estimates from at least two named brokerages before I write, and here I found zero.
What I checked
The consensus block on the Korean company data service returns a line stating, in translation, that no opinion has been issued within the past three months. There is no consensus valuation and no estimated revenue or operating profit. The three forward fields in the indicator data I use, forward earnings per share, forward price to earnings, and peer multiple, are all empty. I widened the date filter to twelve months, went past the financial dailies into trade press and English language outlets, and searched under the Korean name, the English name, and the six digit code. No named analyst estimate for 2026 came back.
So this article contains no forward multiple. It contains no trailing price to earnings ratio either, because the company is loss making and there are no earnings to divide into. The zero shown on data screens means the ratio cannot be computed. The only multiple available to me is market value over sales, and I computed it myself.
What the absence means
An absence of coverage says nothing bad about a company. It is ordinary for a second year KOSDAQ listing of this size. It does mean that one check I run everywhere else is missing here. I usually look for questions in the places where sell side estimates and my own arithmetic disagree, and with nothing to disagree with, only my arithmetic is left standing. I would rather write that down than let the reader assume I had a consensus to lean on.
Seven Things That Would Break What I Wrote
Everything above comes from cutting an income statement and a balance sheet into six quarters. The material pointing the other way is real and there is a good deal of it.
- EN001 holds orphan drug designation in both major markets. Korean press reported on May 22, 2026 that the European Medicines Agency granted the designation for Charcot Marie Tooth disease, carrying ten years of market exclusivity on approval along with scientific advice and fee reductions. The same report described it as following the earlier US designation.
- A phase 2a trial opened at three centers at once. Korean trade press on July 8, 2026 described placebo, low dose, and high dose arms running at Samsung Medical Center, Kyung Hee University Hospital at Gangdong, and Dongguk University Hospital in Gyeongju, with change in the CMT neuropathy score at week 24 as the primary endpoint. Enrollment progress since that date is something I could not confirm.
- A Japanese manufacturing route opened. Korean press reported on May 28, 2026 that the company cleared a Pharmaceuticals and Medical Devices Agency inspection for a specified cell processing facility and signed a contract manufacturing agreement with Ingenium Therapeutics for a natural killer cell therapy targeting acute myeloid leukemia. The contract value and term were absent from that report.
- One deal erases the burn rate I calculated. A single licensing agreement with an upfront payment would make the KRW 2.6422 billion quarterly average meaningless. The company said in the May 22 report that it intended to widen partnering and technology transfer discussions with global pharmaceutical companies.
- Leverage is still modest. The debt to equity ratio was 72.65 percent at March 31, 2026. It climbed sharply from 20.98 percent at the end of September 2025 when the bond landed, but with maturity in December 2030 there is no near term repayment wall.
- Six quarters is a small sample. Six observations are thin for any claim about variance, and two of the six are annual totals less nine month cumulative figures. Separating the range difference from coincidence needs a longer window, and this company has not been listed long enough to give me one.
- I came at this from a screen, not from the science. I reached this company through a search demand keyword and stayed because a table interested me. I cannot assess the probability that a phase 2a trial in a rare neuropathy succeeds, and that probability is most of what this equity is.
Where I Stand on ENCell Stock and What Would Prove Me Wrong
A market value of KRW 65.8 billion puts this outside the top hundred KOSDAQ names, where my default is to watch, and I found nothing here that moved me off that default.
My reason for watching has little to do with the losses. A development stage company posting losses is behaving normally. What stops me is that the line which explains this company’s economics is absent from its income statement. Revenue arrives somewhere between KRW 0.3 billion and KRW 2.1 billion a quarter on a client’s calendar, spending leaves at its own pace regardless, and so the value of the equity at this price rests almost entirely on EN001. I cannot price that trial. What I can count is how much equity remains while it runs, and that answer is the 13.23 quarters above, which is itself a ceiling.
What would prove me wrong
If the 2026 half year report shows first half revenue above KRW 2.271 billion and, in the same statement, a first half operating loss smaller than KRW 9.242 billion, then the claim that spending here ignores sales does not hold. Those two figures are the first half 2025 cumulative revenue and operating loss. Revenue rising on its own leaves my reading intact. The two of them moving together is what closes it.
What I could not check
- Whether the 2026 half year report has been filed. The statutory deadline was August 15, 2026 and I was unable to open the document, so the most recent results in this article are from the first quarter of 2026.
- Cash and cash equivalents at March 31, 2026, which is why I described 13.23 quarters as an arithmetic ceiling.
- The coupon, yield to maturity, subscribers, and early redemption schedule of the convertible bond.
- The specific reason first quarter 2026 revenue fell to KRW 0.308 billion. The company does not publish a quarterly revenue breakdown.
- The value and term of the Ingenium Therapeutics manufacturing agreement.
Sources
- Financial figures from DART filing based data. FY2025 annual report receipt number 20260320000954 and Q1 2026 quarterly report receipt number 20260515001470, separate financial statements.
- Price, market value, and 250 day range from Kiwoom data, on the August 18, 2026 close.
- Bloter, December 4, 2025, on the KRW 22.5 billion convertible bond terms (Korean language)
- Sisa Journal e, April 3, 2025, on first year revenue decline and manufacturing revenue split (Korean language)
- Newspim, May 22, 2026, on European orphan drug designation for EN001 (Korean language)
- Edaily, May 28, 2026, on the Ingenium Therapeutics agreement and Japanese facility certification (Korean language)
- The Bio, July 8, 2026, on phase 2a dosing at three centers (Korean language)
- Newspim, July 8, 2026, on phase 2a design and endpoint (Korean language)
- WiseReport company consensus page, confirming the absence of any brokerage opinion within three months (Korean language)
- stockanalysis.com, Charles River Laboratories page, as of August 18, 2026
- KB Kookmin Bank, August 18, 2026, Seoul session USD KRW close of 1,413.0 (Korean language)
- Korean Flex Circuit Maker BH Co: Profit Barely Covers Interest
- Nature Cell Convertible Bond Pricing After an 8-Year Court Win
- Cosmo AM&T Earnings and a Battery Customer That Bought Elsewhere