Why Foosung Traded 30% of Its Shares in a Single Session
I did not come to Foosung stock through a screen or a broker note. I came to it through a volume figure. On June 10, 2026 (Wed) this company traded 32,761,114 shares in one session against a share count of 107,255,330. That is 30.55% of the entire register changing hands between the opening bell and the close, calculated back from the two figures. Three trading days later the close reached 22,400 won, the highest in a year. Thirty-two trading days after that it closed at 6,930 won. In the whole stretch the company filed no regular report.
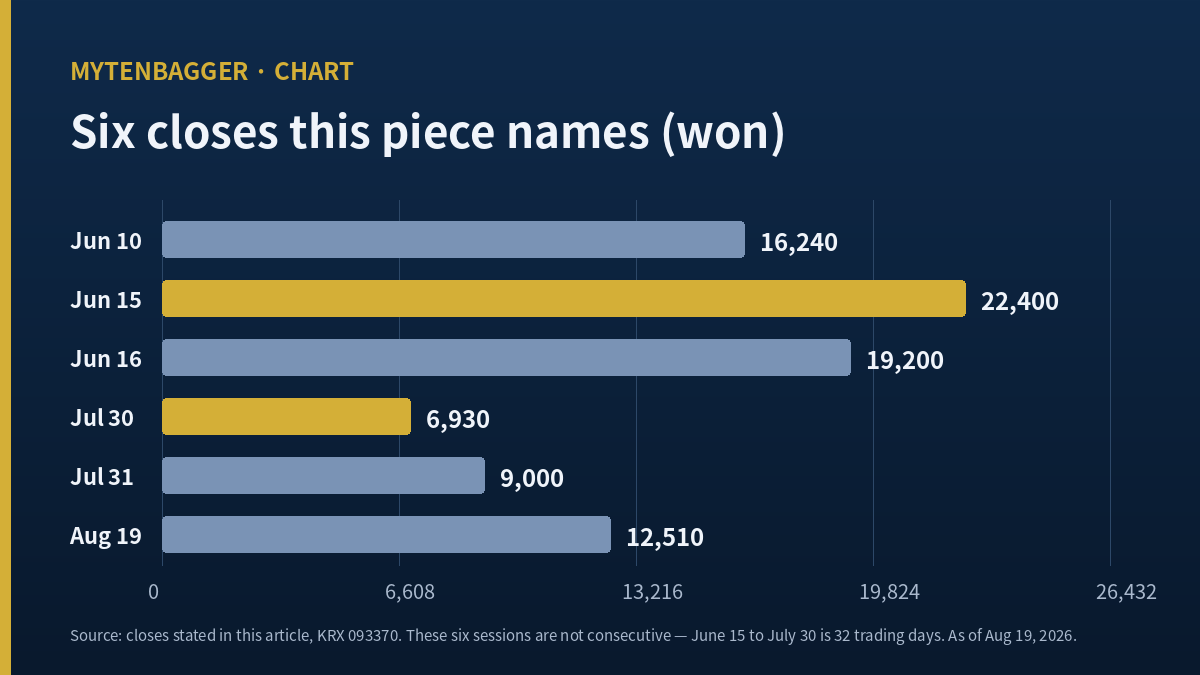
Jun 10, 2026 (Wed) close 16,240 won, volume 32,761,114 shares, 30.55% of shares outstanding
Jun 15, 2026 (Mon) close 22,400 won, the highest close in 250 sessions
Jun 16, 2026 (Tue) close 19,200 won, down 14.29%, exchange caution designation in force
Jul 30, 2026 (Thu) close 6,930 won, down 69.06% from the June 15 close
Aug 19, 2026 (Wed) close 12,510 won, up 80.52% from July 30, down 44.15% from June 15
All percentages calculated back from the closes shown. Won is the reference currency here.
Contents
What made me open Foosung stock again
Foosung (KRX code 093370) is listed on KOSPI, the senior board of the Korea Exchange, where the country’s larger and older companies trade. The junior board is KOSDAQ, which carries most of the smaller technology names. Foosung sits on the senior board but is not a large company by its standards. At the August 19, 2026 (Wed) close of 12,510 won its market value was 1,341.76 billion won, roughly USD 960 million at 1,397.7 won to the dollar on the same date. That places it well outside the top 100 Korean listings. What I do here is watch, and write down why.
The business is fluorine chemistry. Three product families matter: specialty gases for semiconductor fabrication, of which tungsten hexafluoride (WF6) is the best known; lithium hexafluorophosphate (LiPF6), the salt that goes into lithium-ion electrolyte; and refrigerants. A consolidated subsidiary called Hantech, which builds chemical process equipment, sits inside the reported numbers and matters more than most people assume. I will come back to that.
The thing I got wrong before I started
My first instinct with a chart like this was to look for a filing. Companies that move 30% of their register in a session usually have a document behind them. I spent an hour looking for one and there was nothing in the window. The second-quarter results did not arrive until August 18, 2026 (Tue), 47 trading days and 69 calendar days after the June 10 session. So the sequence I had assumed, where information arrives and price responds, runs backward here. The price moved first, by a lot, and the information came later. I had to rebuild the piece around that, and it changed which questions I thought were worth asking.
The session that moved 30.55% of the register
June 10, 2026 (Wed) was the heaviest session in the hundred trading days I pulled. The stock closed at 16,240 won on 32,761,114 shares. Three sessions later, on June 15, 2026 (Mon), it closed at 22,400 won on 17,639,508 shares, which is 16.45% of the share count, with an intraday high of 23,550 won that stands as the highest print in 250 sessions. Those two days together turned over 50,400,622 shares, which is 46.99% of the register, calculated back from the volumes and the share count.
Korean company monitoring service WISEfn puts the largest shareholder and related parties at 46.04% of the company. If that block did not move on June 10, the share of freely tradable stock that changed hands was considerably above 30.55%. I did not push that calculation through, because I could not confirm whether the block moved, and a ratio built on an unverified assumption is worse than no ratio.
What the exchange did about it
Korean outlet Polytimes reported on June 16, 2026 (Tue) that the Korea Exchange designated the shares an investor caution issue on the grounds of a short-term price surge, which blocked margin lending and lifted the required deposit ratio to 100%. A Samsung Securities note published the day before also recorded the designation. The close fell from 22,400 won to 19,200 won that day, down 14.29% calculated back from the two closes.
Then the whole thing came off
From the June 15, 2026 (Mon) close of 22,400 won to the July 30, 2026 (Thu) close of 6,930 won is 32 trading days and a decline of 69.06%. The very next session, July 31, 2026 (Fri), the close rose 29.87% in one day to 9,000 won, which is close to the daily limit on the Korean market. I have not found a company filing or a news item that lines up with either end of that. One Korean outlet carried a headline about a decline of roughly 13% on July 1, 2026 (Wed), and I was unable to open the body of that article, so I do not know what it said.
Foosung stock between two explanations
Two accounts of the June move exist in print. They are not variations on each other. They come from different worlds and they imply different things about whether the move was worth anything.
Account one, a metal price in Rotterdam
Samsung Securities analyst Jang Jung-hoon published a note on June 17, 2026 (Wed) putting the rally down to three inputs: the WF6 price, the hydrofluoric acid price, and utilization of the company’s LiPF6 lines. The note put WF6 at around 30% of the parent company’s revenue. That summary reached me through Asia Economy, a Korean daily, on the same date, since I could not read the note itself.
The raw material story behind it is easier to check. Korean trade outlet The Guru reported on June 10, 2026 (Wed) that WF6 prices had risen 232.7% from a year earlier, with Japanese producers, who supply about a quarter of the world’s WF6 by that account, signaling output cuts and contract price increases. The Public reported on August 18, 2026 (Tue) that ammonium paratungstate in Rotterdam moved from under USD 400 per ton in early 2025 to above USD 3,000 per ton by the end of April 2026. Behind all of it sits Chinese export licensing on tungsten.
Account two, an account with 840,000 followers
The same Asia Economy article reports that an overseas trader with 840,000 social media followers was named as the force behind the surge. I want to be precise about what I did with this. I could not identify the account. I could not line up the timing of any post with the timing of the volume. So what I am recording is that the claim was published in a Korean daily, and nothing beyond that. I am not treating it as a fact about the company, and I did not use it anywhere in my valuation work.
The two accounts sit badly together. If a tungsten export license regime drove the move, the move was about industrial pricing and should survive. If a trading account drove it, the move was about flow and should not. The 69% decline that followed is consistent with either one, which is exactly why it settles nothing.
What the June quarter actually showed
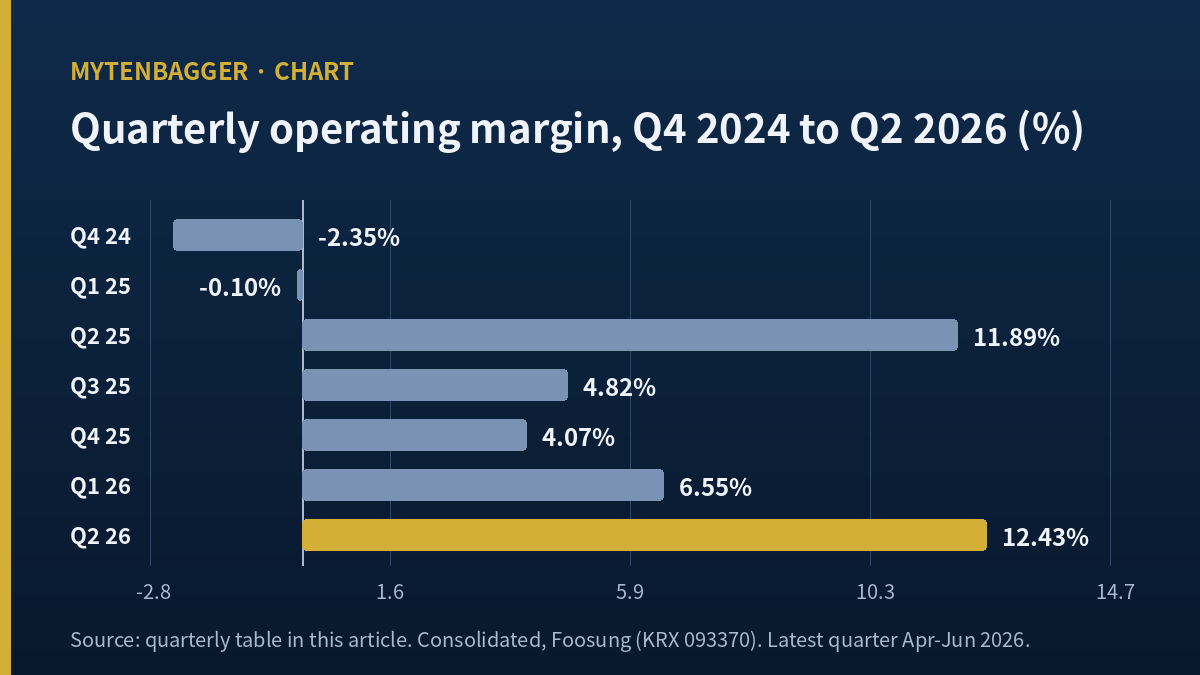
The half-year report filed on August 14, 2026 (Fri), Korean filing receipt number 20260814003359, lets me build discrete quarters instead of the cumulative figures Korean filings default to. For the three months to June 2026: revenue 188.22 billion won, operating profit 23.40 billion won, an operating margin of 12.43%. In dollars at the same reference rate that is about USD 134.7 million and USD 16.7 million.
| Quarter | Revenue (bn won) | Operating profit (bn won) | Operating margin |
|---|---|---|---|
| Q4 2024 | 110.42 | -2.60 | -2.35% |
| Q1 2025 | 107.12 | -0.11 | -0.10% |
| Q2 2025 | 124.21 | 14.77 | 11.89% |
| Q3 2025 | 120.99 | 5.84 | 4.82% |
| Q4 2025 | 119.25 | 4.85 | 4.07% |
| Q1 2026 | 141.45 | 9.26 | 6.55% |
| Q2 2026 | 188.22 | 23.40 | 12.43% |
That 12.43% is the best discrete quarter since the third quarter of 2022, when the margin was 16.22% on the same calculation. Across the fourteen quarters in between, twelve came in below 5% or in loss. So the June quarter is a genuine outlier in this company’s recent history, and I want to say that plainly before I start qualifying it.
Where 45% of that profit came from
Eugene Investment and Securities analyst Han Byung-hwa published a breakdown on August 18, 2026 (Tue), carried by Korean financial outlet Newspim, separating the consolidated result from the parent. Consolidated revenue of 188.2 billion won includes 141.9 billion won at the parent; consolidated operating profit of 23.4 billion won includes 12.8 billion won at the parent. Calculated back, the Hantech subsidiary contributed 46.3 billion won of revenue and 10.6 billion won of operating profit, which is 45.30% of the group’s operating profit for the quarter.
Anyone buying this company for semiconductor gas exposure is buying a quarter in which nearly half the operating profit came from chemical process equipment. That is not a criticism of Hantech, which appears to be doing well. It is a statement about what the headline number contains.
I keep running into the same problem from a different angle in Korean materials names. With KCTech, where two 2026 forecasts sat 2.3 times apart, the disagreement was between analysts about the same company. Here the disagreement is inside the company, between the segment people think they are buying and the segment that produced the profit.
The interest line I look at before anything else
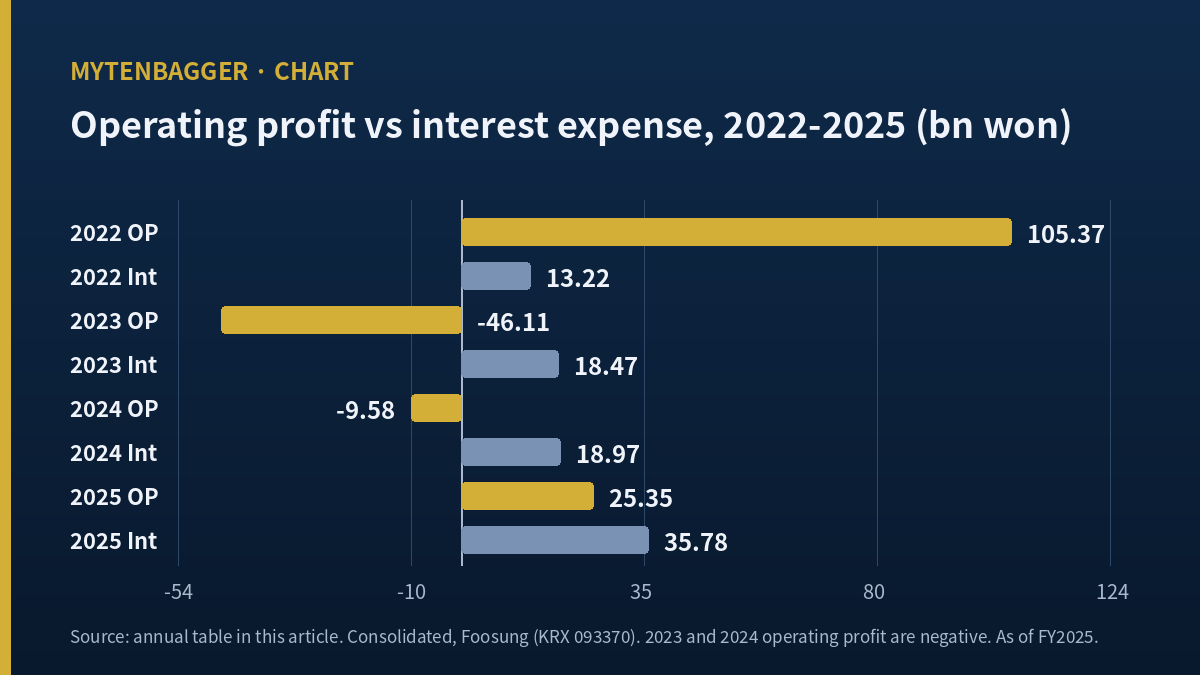
In the annual report filed March 18, 2026 (Wed), receipt number 20260318001491, consolidated operating profit for 2025 was 25.35 billion won and interest expense for the same year was 35.78 billion won. Interest coverage of 0.71 times. The company did not earn enough at the operating line to pay its interest for a full financial year. Against 2022 interest expense of 13.22 billion won, the 2025 figure is 2.71 times as large.
| Year | Revenue (bn won) | Operating profit (bn won) | Interest expense (bn won) | Profit to owners (bn won) |
|---|---|---|---|---|
| 2022 | 610.56 | 105.37 | 13.22 | 97.05 |
| 2023 | 523.19 | -46.11 | 18.47 | -53.92 |
| 2024 | 437.80 | -9.58 | 18.97 | -69.36 |
| 2025 | 471.56 | 25.35 | 35.78 | 5.31 |
For the first half of 2026 the same two lines read 32.66 billion won of operating profit and 7.75 billion won of interest, giving coverage of 4.22 times. That is a very large swing in six months, and I treat it as the most important improvement in the whole file. Doubling the half-year interest figure gives 15.49 billion won for the year, which sits so far below the 2025 figure that I declined to use the annualization for anything. I do not know what changed in the debt structure, and the half-year report detail I would need to find out was not available to me.
Cash did not follow
The clearest version of what happens when this line stays broken is Cosmo AM&T, where interest expense exceeded operating profit for six straight quarters. Foosung spent a whole financial year in that condition and then climbed out of it in two quarters, which is the fastest exit from it I have written up.
Cumulative operating cash flow for the first half of 2026 was negative 8.68 billion won and free cash flow was negative 24.55 billion won, in a half-year that produced 32.66 billion won of operating profit. I could not obtain the working capital detail that would explain the gap. Inventory rose from 74.96 billion won at the end of 2025 to 103.21 billion won at the end of June 2026, which covers part of it, and I stopped there instead of guessing at the rest.
Foosung stock against its closest Japanese peer
The most useful comparison I found is Kanto Denka Kogyo, listed in Tokyo under code 4047. It makes fluorine specialty gases for semiconductor manufacturing, which is the same shelf Foosung’s best-known product sits on, and it reported a quarter covering the same three months.
| April to June 2026 | Foosung (KRX 093370) | Kanto Denka Kogyo (TSE 4047) |
|---|---|---|
| Revenue | 188.22 bn won | 15,143 mn yen |
| Operating profit | 23.40 bn won | 779 mn yen |
| Operating margin | 12.43% | 5.14% |
| Twelve-month share performance | +159.01% (Kiwoom, adjusted) | +302.48% total return |
I left the two revenue figures in their own reporting currencies on purpose. Running won and yen through one exchange rate to make them look comparable adds error without adding meaning, and the margin column already carries the comparison. Kanto Denka’s quarter is from its filing summary as published by Japanese brokerage Matsui Securities; the total return and its valuation figures come from a Simply Wall St piece dated May 25, 2026 (Mon), which put the shares on about 50.1 times earnings against roughly 12.7 times for the Japanese chemicals sector.
Why I picked this peer and what it costs my argument
I chose it because it is the peer that rose more, on the same theme, in the same window, while posting the weaker quarter of the two. Its margin in the June quarter was less than half of Foosung’s. It trades at roughly four times its sector’s earnings multiple. And nobody, in anything I read, offered a social media account as the explanation for its move. On the performance line I have to be careful: the Kanto Denka figure is a total return as of May 25, 2026 (Mon) and the Foosung figure is an adjusted price return as of August 19, 2026 (Wed), so the two are on different bases and different dates. The comparison is directional and I would not put a ratio on it.
That is uncomfortable for the way I have been framing this. If the same theme repriced a Japanese company harder than a Korean one, and the Japanese move needs no story about flow to explain it, then the flow story on the Korean side is probably doing less work than the headlines suggest. I am recording that against myself. I also did not check Kanto Denka’s cash flow or leverage, so this comparison covers margin and price only.
The same comparison run across seven electrolyte-materials makers puts three Korean names at the bottom of the margin column. Chunbo grew first-half revenue 33.70 percent and still closed the half at a negative 7.87 percent operating margin, and Foosung sits above it in that table. Worth holding in mind before reading either company’s margin as an industry-wide story.
Foosung stock and the earnings window you divide by
The vendor screen shows a price to earnings ratio of 252.63. Dividing the market value of 1,341.76 billion won by 252.63 returns 5.31 billion won, which is exactly what the parent’s own shareholders earned in 2025. So that multiple divides today’s price by one calendar year of profit that ended eight months ago.
Adding the four discrete quarters from the third quarter of 2025 through the second quarter of 2026 gives 36.45 billion won of profit to owners, calculated as 13.54 plus 11.46 minus 9.96 plus 21.41. Divide by that instead and the multiple is 36.81. The gap between the two figures is 215.82 points and every point of it comes from where the twelve months were cut.
A second screen, Korean data service Valueline, showed the multiple as negative 293.72 and earnings per share as negative 43 won on the same date. The four quarters from the second quarter of 2025 through the first quarter of 2026 sum to negative 4.57 billion won of profit to owners, or negative 42.6 won per share, so that screen is running a window that closes before the August 14 half-year filing. None of these is wrong. This company’s bottom line has been crossing zero, and where you cut decides the sign.
Book value, for what it is worth
On the vendor book value per share of 3,118 won the price to book ratio is 4.01. Using the 365.52 billion won of equity held by the parent’s own shareholders at the end of June 2026, divided by the share count, gives 3,407.98 won per share and a ratio of 3.67. Either figure fails the same screening test I apply, so the choice changes the distance and not the verdict.
Seven arguments against how I read Foosung stock
- The peer comparison undercuts my flow story. Kanto Denka rose further with no social-media narrative attached, which suggests the theme did the work in both places.
- The June quarter margin is genuinely good. 12.43% is the best in fourteen quarters and the direction is against my caution.
- Interest coverage went from 0.71 to 4.22 times in six months. Half of any balance sheet worry I might raise has already been answered by the company.
- The sell-side raised its 2026 operating profit estimate by 44.89% from 52.8 billion won to 76.5 billion won on August 18, 2026 (Tue), calculated back from the two figures, and kept a 20,000 won valuation on the shares. I did not read either note in full, and they did.
- Chinese LiPF6 pricing is falling. ChemAnalyst puts the second quarter of 2026 Chinese FOB Qingdao price at USD 13,844.67 per metric ton, down 17.29% quarter on quarter, while North American pricing held up. This cuts one bull argument, and because I never established the company’s regional mix, I cannot say by how much.
- I never found the cause of the June rally or the July collapse. An unexplained rise pairs with an unexplained fall, and my discomfort with one should apply to the other.
- The convertible bond overhang may already be gone. A 27.0 billion won convertible issued October 23, 2025 carries a conversion price of 6,857 won and would create 3,937,582 shares, which is 3.54% of the enlarged count. A conversion notice was filed March 24, 2026 (Tue) but the share count is unchanged, so I do not know how much remains outstanding. If the answer is none, one of my concerns disappears.
Where I stand on Foosung stock and what breaks it
The checklist I run scores it 57 out of 100, passing four of seven tests. Revenue scale, operating margin, positive earnings per share and positive operating profit clear. Return on equity at 1.6%, the earnings multiple at 252.63 and the price to book at 4.01 do not.
The closest thing I have to a template here is TCK, which quadrupled off its low. That one had a clean moat and a price that had already booked the good news. This one has a recovery I believe and a price that has already travelled the round trip once, which is a different reason to stay out and, I think, a weaker one.
My working view is that the June quarter is real and the price already spent the summer arguing about how real. I set two thresholds on the same quarter, and they lead to opposite conclusions instead of to one conclusion with a margin of error.
If discrete third-quarter 2026 operating profit comes in at or above 23.40 billion won, the June quarter was not a single-quarter event, my caution loses its basis, and I drop it. If discrete third-quarter operating profit comes in below 9.26 billion won, which is what the first quarter of 2026 produced, the June quarter rested on a pricing window that has closed, and I take the name off the watch list entirely. Anything between those two and I wait one more quarter without changing anything. The data service I use lists the statutory filing deadline for the third quarter as November 15, 2026, though provisional results arrived ahead of the formal filing in each of the last two quarters, so the test will resolve before then.
Basis and margin of error
Prices, volumes and multiples reflect the August 19, 2026 (Wed) close as checked at the time of writing. Market value, the earnings multiple and the price to book were checked by calculating back from that close and a share count of 107,255,330, a figure confirmed at two Korean data services, and the par value of 500 won multiplied by that count gives 53.63 billion won, matching the reported paid-in capital. Financial figures are as filed with the Korean regulator, with receipt numbers given in the text. Dollar amounts are approximate, converted at roughly 1,397.7 won per dollar as of the same date. Japanese and Chinese figures are left in the currency their sources reported them in.