ENF Technology Stock Beat the KOSDAQ but Lagged Its Chip Peers
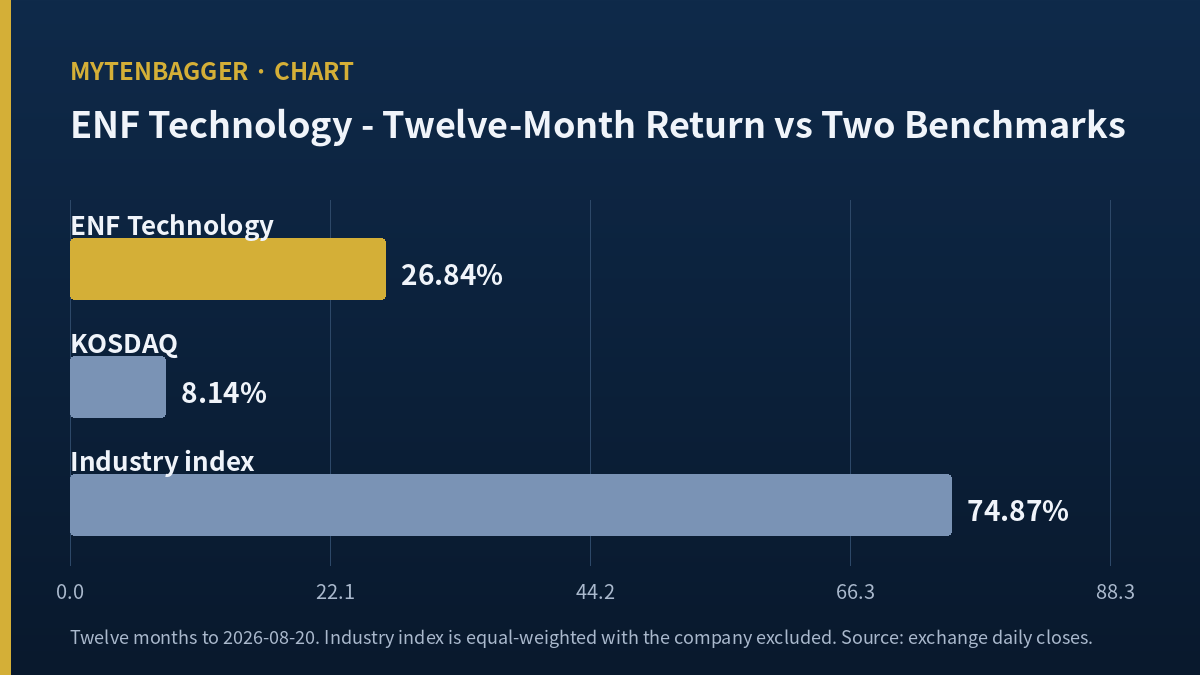
I opened ENF Technology stock expecting to look at earnings, and ended up looking at three return numbers instead. Over the twelve months to 2026-08-20 (Thursday) the shares returned 26.84 percent. The KOSDAQ returned 8.14 percent. The Korean semiconductor and semiconductor-equipment index that this name sits inside returned 74.87 percent. I sat with those three for a while before I wrote anything else.
Twelve months to 2026-08-20 (Thursday), 244 trading days
Versus the KOSDAQ +18.70 points (26.84 less 8.14)
Versus its own industry index −48.03 points (26.84 less 74.87)
Industry lift available +66.73 points (74.87 less 8.14)
Industry index is equal-weighted with the company itself removed, so the comparison does not fold the stock into its own benchmark. Point differences are my arithmetic.
Contents
What ENF Technology stock did over the last twelve months
ENF Technology (KOSDAQ: 102710) makes the wet chemicals that semiconductor and display fabs run through their process lines. Etchants, thinners, developers, strippers, photoresist feedstock, color-filter paste for panels. It does not make chips or wafers. It makes the liquids that clean, strip and cut them.
The closing price I am working from is KRW 47,500 on 2026-08-20 (Thursday). At 14,287,836 shares that puts the market value at KRW 678.67 billion, roughly USD 480 million at the approximate rate noted at the foot of this piece. In Korean market terms this is a small cap. It is not in the top hundred names on the KOSDAQ, the smaller of Korea’s two main boards and the one that carries most of the country’s component and materials suppliers.
Twelve-month return of 26.84 percent looks fine in isolation. It looks less fine once you know what the neighbours did.
Up 18.70 points on the index, down 48.03 on the industry
Those two sentences describe the same twelve months and the same closing prices. Both are true. They point in opposite directions, and which one a person quotes tells you more about the person than about the company.
The arithmetic that ties them together is simple. Take the gap between the stock and the broad market, +18.70 points. Split it in two. The first piece is the gap between the industry and the broad market, +66.73 points, and that piece has nothing to do with this company. The second piece is the gap between the stock and its industry, −48.03 points, and that piece is the only part that belongs to the company. Add them and you get 18.70 back.
So the honest sentence is this. Over the past year, being in Korean semiconductor materials was worth 66.73 points more than being in the KOSDAQ generally. Being in this particular Korean semiconductor materials company gave back 48.03 of them. What survived to the shareholder was 18.70 points of outperformance that the industry handed over, minus what the company failed to hold.
Where the 66.73 points of industry wind went for ENF Technology stock
By the decomposition above, roughly 58 percent of the stock’s excess over the KOSDAQ traces to the industry it belongs to and the remainder to the company itself, with the company’s own contribution being negative. That is the whole of my starting position. I am looking at a name whose one-year chart flatters it against the broad market and indicts it against its peers.
I want to be careful about what this does and does not prove. It does not prove the business underperformed. Index membership, free float, foreign ownership and the sheer weight of the largest names in a sector index all move these numbers without anything happening at the company. The industry index here holds 159 names that traded through the whole window, and the single largest constituent carries 53.64 percent of the sector’s market value. That one name’s year effectively sets the sector figure. What the decomposition proves is narrower and still useful: whatever lifted the industry over the past year did not lift this company by nearly as much.
Ranked 87th out of 159 names in the same industry
Percentile ranking is the check I run when a weighted index number looks too strong to trust, because a rank survives changes in weighting method. Of the 159 industry names that traded the full window, this one placed 87th. The industry median return was 39.03 percent against this company’s 26.84 percent, a shortfall of 12.19 points. Seventy-two names did worse.
I find the rank more useful than the index gap. The −48.03 point figure is dominated by whatever the sector’s largest constituent did. The rank says something plainer: put every company in this industry in a line by twelve-month return, and this one lands just past the middle, in the slower half. Not broken. Not a leader. A little behind the typical name in its own business.
Both of those answers come from a single window that begins on 2025-08-20 (Wednesday) and ends on 2026-08-20 (Thursday). Move the window and the answer moves with it. Which is what the next section is about.
The drawdown window answers the ENF Technology stock question differently
| Twelve-month window | Peak to trough | Trough to 08-20 | Ground regained |
|---|---|---|---|
| This company | −44.34% | +36.10% | 75.8% |
| KOSDAQ | −47.42% | +30.42% | 68.6% |
| Industry index | −48.69% | +40.05% | 71.9% |
All three peaked in spring and all three bottomed on the same day, 2026-07-30 (Thursday). This company topped out at KRW 62,700 on 2026-04-24 (Friday), fell to KRW 34,900 on 2026-07-30 (Thursday), and closed 2026-08-20 (Thursday) at KRW 47,500. The KOSDAQ peaked three sessions later on 2026-04-27 (Monday); the industry index held up longest and peaked on 2026-05-26 (Tuesday).
In that window the company comes first. It fell the least of the three and it has climbed back to 75.8 percent of its own peak, ahead of both benchmarks. Its bounce off the low, +36.10 percent, is smaller than the industry’s +40.05 percent, but it had less ground to make up.
So one window says this name lagged its industry badly and the other says it held up better than its industry through the worst quarter either of them had. I do not think either is a trick. The twelve-month figure captures the whole run-up, when the sector’s leaders ran and this company did not run with them. The drawdown figure captures only the fall and the recovery, and in a fall the stock that never fully joined the rally has less to give back. Both facts have the same underlying cause. What that cause means for the next twelve months is the part I cannot settle from price data.
What this company sells, and what KOSDAQ means for it
KOSDAQ is Korea’s junior board, the rough counterpart to the Nasdaq in structure if not in scale, and it is where most Korean semiconductor materials and equipment suppliers list. It is a more volatile board than the main KOSPI, and small caps on it can move a long way on order news from a single fab customer.
Three product lines carry this company, by its own description. Process chemicals for semiconductor and display manufacturing are the largest. Fine chemicals supplies feedstock for photoresist. Color paste goes into display color filters. Head office is in Giheung, south of Seoul, with plants at Ulsan, Asan and Cheonan, an American plant in Kyle, Texas, and Chinese operations in Guangzhou and Wuhan. Headcount was 639 as of December 2025.
Two operational items from 2026 matter more than the product list. On 2026-06-16 (Tuesday) the Korean trade outlet TheElec reported that the company had cleared quality qualification and shipped its its first high-purity hydrofluoric acid volumes to SK hynix from the Cheonan plant, with cumulative investment in that product above KRW 100 billion since 2020. Earlier, on 2026-05-18 (Monday), the same outlet reported the purchase of Japan’s Morita Chemical’s entire 32.44 percent holding in affiliate Pam Technology for KRW 7.21 billion, lifting ownership to 78.87 percent from 46.43 percent and consolidating a maker of buffered oxide etchant and ammonia water. Read together, those two are one move: make the acid in-house, then own the company that turns the acid into etchant.
ENF Technology stock beside the Japanese firm it wants to displace
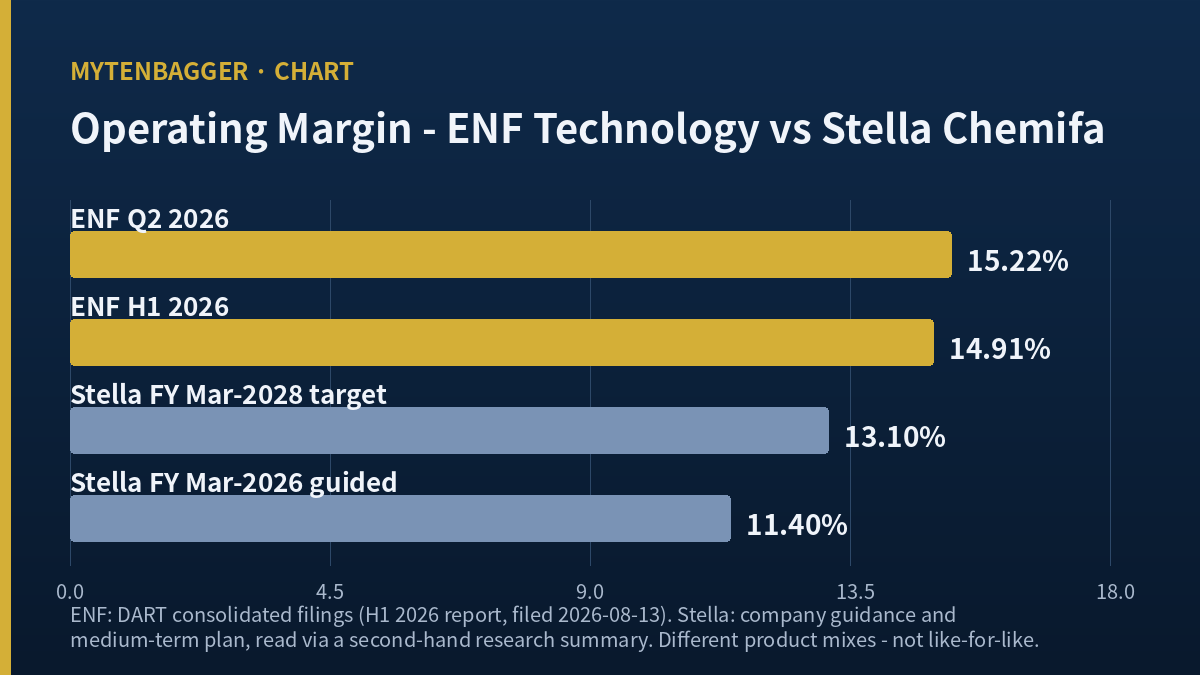
High-purity hydrofluoric acid for semiconductors has been a Japanese business for decades, and the clearest listed comparison I can find is Stella Chemifa (Tokyo: 4109), one of the two Japanese suppliers Korean fabs have historically bought this material from. For the fiscal year ending March 2026 Stella guided to net sales of JPY 36.0 billion, down 0.8 percent, and operating profit of JPY 4.1 billion, down 5.5 percent, which works out to an operating margin near 11.4 percent. Its own medium-term plan targets JPY 42.0 billion and JPY 5.5 billion by the fiscal year ending March 2028, a 13.1 percent margin. Semiconductors account for 67 percent of sales in its high-purity chemicals business.
I am comparing margins only, never the money amounts. Putting yen and won on the same line would require me to invent a cross rate, and I would rather leave the comparison narrow and correct. On margin: this Korean company’s first-half 2026 operating margin was 14.91 percent and its second-quarter figure was 15.22 percent. Stella’s three-year ambition, 13.1 percent by March 2028, sits below what the Korean firm printed in the quarter that ended 2026-06-30.
Two caveats sit on that comparison and I will not bury them. First, I read Stella’s guidance through a Japanese research summary; I did not open the company’s own filing, so treat those figures as second-hand. Second, the two firms have different product mixes; Stella is concentrated in fluorine chemistry while this company spans etchants, thinners, developers and paste. A margin line between them is suggestive and it is not a like-for-like read. For a Korean materials supplier where the dominance is easier to see and the price already reflects it, see TCK, the SiC ring leader I watch.
Two sell-side marks that have not moved since May 15
I found two named Korean brokers with published views. On 2026-05-15 (Friday), NH Investment and Securities analyst Yang Jung-hyun put the stock at KRW 67,000, having cut to that from KRW 72,000 four days earlier on 2026-05-11 (Monday), a reduction of 6.94 percent by my arithmetic. The same day Korea Investment and Securities analyst Hwang Jun-tae carried a KRW 65,000 mark with a buy rating. A wire summary published that day put the six-month broker average at KRW 64,667. In dollars those marks sit near USD 47.42 and USD 46.00 against a closing price near USD 33.62.
Every one of those marks is above where the stock trades. Both desks are constructive and I am watching from the outside. I put that disagreement in the body instead of a footnote because it is the most direct evidence that I am wrong.
What holds my attention is the date more than the number. Both views were published on 2026-05-15 (Friday). Since then the company has shipped first hydrofluoric acid volumes in June and printed its highest quarterly operating margin in August. I confirmed that Korea Investment and Securities published a second-quarter review piece on 2026-08-14 (Friday); I could not confirm what value or rating it carried. I read none of these three pieces in the original. All three reached me through secondary coverage, and I am not going to pretend otherwise.
The quarter I keep going back to
There is one print I have not been able to explain and it keeps pulling me back. In the fourth quarter of 2025 this company posted its largest quarterly revenue to that point, KRW 176.78 billion, and its operating margin fell to 6.29 percent from 12.78 percent the quarter before. The two quarters since came in at 14.58 and 15.22 percent, the best pair in the company’s recent history.
My first instinct was to call the weak quarter a one-off and move on, because the recovery was so clean. Then I noticed I wanted it to be a one-off, which is a different thing from having evidence that it was. I could not find the cause in any public source I could reach. Year-end compensation, an inventory charge, something at the American subsidiary; each is plausible and none is confirmed. So the weak quarter stays unexplained in my notes, and an unexplained collapse followed by two good quarters is exactly the pattern where I am most likely to talk myself into a story.
Eleven ways my read on ENF Technology stock could be wrong
- Both brokers disagree with me. KRW 67,000 and KRW 65,000 against a KRW 47,500 close, both with buy ratings. That is the first and largest reason to doubt what I have written.
- The industry index is dominated by one name. Its largest constituent holds 53.64 percent of sector market value. My −48.03 point gap is mostly a statement about that one company’s year.
- The percentile rank is kinder than the index gap. 87th of 159 is mid-pack and some way short of a failure, and the rank is the more robust of the two measures.
- The drawdown window flatly contradicts the annual one. Best recovery ratio of the three at 75.8 percent. If a reader weights recent months more heavily, my conclusion inverts.
- Survivorship sits inside the ranking. Delisted names never enter the 159. The industry median of 39.03 percent is the median of companies that made it to the end of the window.
- Operating results are improving on every line. First-half revenue up 8.65 percent, operating profit up 16.04 percent, interest expense down 23.59 percent, debt-to-equity at 60.77 percent as of 2026-06-30. None of that is in my price decomposition.
- The hydrofluoric acid rollout has barely touched revenue. First deliveries went out in June and the quarter closed on 2026-06-30. If that product ramps, 15.22 percent is where that product’s contribution starts, with the peak still ahead.
- The Texas plant is spending ahead of revenue. TheElec reported on 2026-04-14 (Tuesday) that cumulative investment there exceeds USD 68 million with volume production revenue expected from 2027. Judging that subsidiary on today’s losses gets the timing wrong.
- Consolidation muddies the first-half comparison. Pam Technology entered the consolidation in February 2026, so the prior-year base covers a different set of companies. I could not separate organic growth from the accounting effect.
- Beta and correlation say this name mostly follows the market. Beta of 1.135 and correlation of 0.746 against the KOSDAQ over the window. A stock that tracks the market this closely is a weak candidate for a story about company-specific behavior, which is what I have been telling.
- The hardest one: my entire frame rests on an index I did not build. The industry index here is a synthetic construction, equal-weighted with the subject removed, assembled from a sector classification I did not audit. Change the classification boundary and the 159 names change, the median changes, and the 48.03 point gap changes with them. I used that number as the spine of this piece and I cannot independently verify the taxonomy underneath it.
Numbers I checked and left out of the ENF Technology stock call
Two share counts, and which one I used
The market data screen carries 14,288,421 shares. Paid-in capital of KRW 7,143,918,000 divided by the KRW 500 par value gives 14,287,836. The 2025 dividend total of KRW 2,857,567,200 divided by the KRW 200 per share payout gives the same 14,287,836. Two independent routes agree, so I used that figure throughout. The 585-share difference moves market value by 0.004 percent, which changes nothing except my ability to explain a discrepancy later.
Multiples that split by which period you pick
Price to earnings reads 13.07 on 2025 full-year profit for owners of the parent and 11.86 on the last four reported quarters. Price to book reads 1.52 against year-end 2025 owners’ equity and 1.41 against the 2026-06-30 figure. Neither pair is wrong; they answer different questions, and quoting one without saying which is how a reader ends up with a number they cannot reproduce. My valuation view does not rest on either. The same split shows up one layer out in the supply chain: KCTech has two 2026 forecasts that differ by 2.3 times.
Things I could not confirm at all
Product-line revenue split for 2026, because the filings present a single segment. The cause of the fourth-quarter 2025 margin collapse. Why second-quarter net profit fell 22.04 percent from the first quarter while operating profit rose 9.37 percent, given that interest expense fell over the same span. The filer and holding change behind a 2026-08-07 (Friday) major-shareholding notice. Convertible bond balances and unexercised option counts. Each of those would have changed something in this piece if I had it.
What would break my read on ENF Technology stock
At KRW 679 billion this is outside the top hundred KOSDAQ names, and watching is my default for names that size. The read I am carrying is that the last twelve months of price action were mostly industry lift that this company captured only part of, and that the company-specific question is still open.
The number I will check is the gap to the industry index over a rolling twelve months. It stands at −48.03 points now. If that gap widens past −60 points at the next two quarterly checkpoints, the “it simply did not catch the wind” reading fails and I will have to accept that something company-specific is driving it. Sixty points is where I drew the line because the industry lift over this window was 66.73 points; a gap that wide would mean the company kept under a tenth of what was available to it. The first checkpoint is the third-quarter filing, statutory deadline 2026-11-15 (Sunday). The second is the annual report the following spring. One bad checkpoint is noise, so I need both.
Semiconductor and display sit in one segment
The company is both, and the filings do not let an outsider split them. Regulatory disclosure presents the business as a single segment covering semiconductor and display electronic materials. A 2025 broker note put semiconductor materials at 65 percent of revenue, but that figure is more than a year old and I would not carry it into a 2026 view.
The control block
Korea Alcohol Industrial, a listed Korean chemicals maker, holds 26.13 percent as of 2026-08-07 (Friday), with the largest-shareholder group at 35.48 percent. Two five-percent holders appear alongside them, one American and one Korean asset manager. The chairman holds 7.04 percent directly.
The dilution record
There is nothing in the public record since a 30,000-share option exercise on 2021-03-05. Paid-in capital has been unchanged since then, and the dividend arithmetic above implies treasury holdings of essentially zero. I could not verify convertible bond balances directly, so I would call the risk low without calling it zero.
Prices, returns and multiples here are as at the 2026-08-20 (Thursday) close, checked before the Seoul open on 2026-08-21 (Friday). Dollar figures are approximate, converted at roughly KRW 1,413 per dollar; that rate is carried over from a recent check and I was unable to refresh it while writing. Korean won is the reference currency throughout, and dollar amounts are a convenience for readers outside Korea. Financial figures come from consolidated regulatory filings; any ratio or percentage change the company did not publish itself is my own arithmetic and is described as such in the text.
Sources: TheElec on first high-purity hydrofluoric acid volumes to SK hynix, 2026-06-16 / TheElec on the Pam Technology stake purchase, 2026-05-18 / TheElec on the Texas plant expansion, 2026-04-14 / Newspim summary of the NH Investment and Securities note, 2026-05-15 / Newspim summary of the Korea Investment and Securities note, 2026-05-15 / DigitalToday on the March 2026 annual meeting resolutions / FISCO research summary on Stella Chemifa guidance and mid-term plan / WiseReport capital history and subsidiary listing / Company site
- Binex Exchangeable Bond Priced at Nearly Triple the Share Price
- Dongsung Finetec Margin Climbed to 16% Over Eighteen Quarters
- Solbrain Earnings: Five Quarters of Profit Growth, Thinner Margin