Hanwha Life Stock: A 76% Estimate, One Sixth Retained
I keep two numbers side by side when a Korean insurer beats its own history. The first is what the sell-side does to next year’s earnings. The second is what happened to the balance of future margin sitting on the balance sheet. For Hanwha Life stock in the first half of 2026, those two numbers went in directions I did not expect to have to explain.
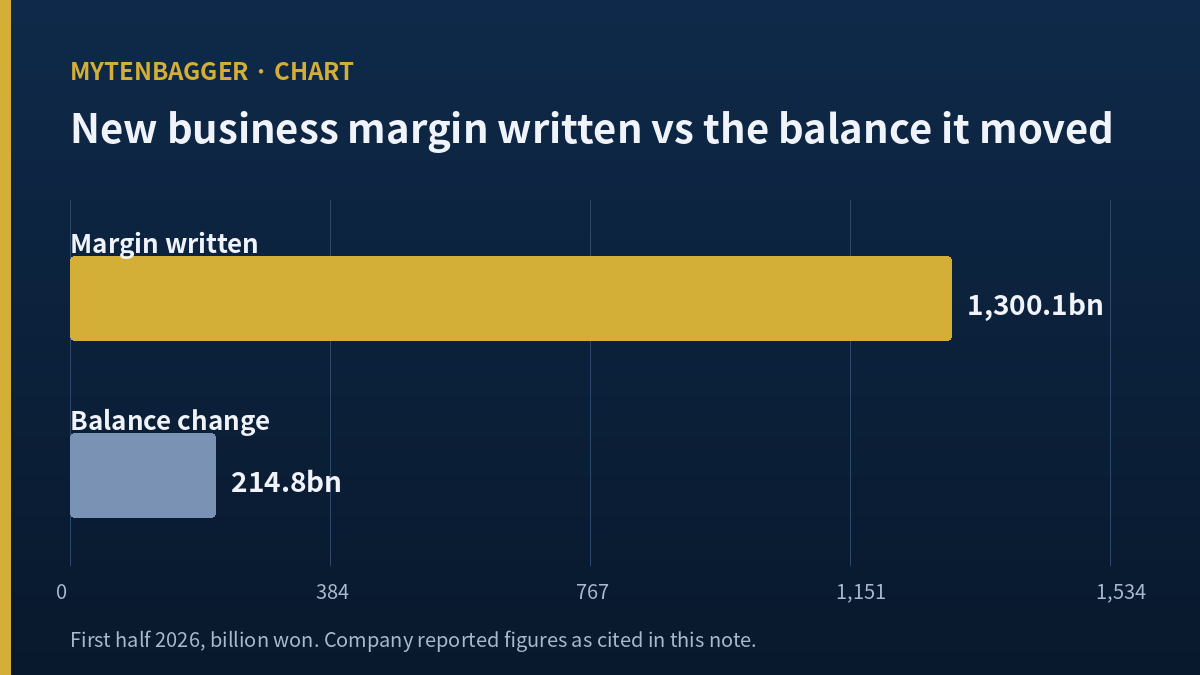
Eleven Korean brokerages now carry a 2026 estimate of 1,302 won of earnings per share. The 2025 actual was 738 won. That is 1.7642 times, or a lift of 76.42 percent (my calculation from the two published figures). Over the same six months the company wrote 1,300.1 billion won of new business contractual service margin, the largest first half since Korea adopted IFRS 17. And the stock of contractual service margin it carries rose by 214.8 billion won.
I do not own this company and I have no order working. Hanwha Life is a KOSPI-listed life insurer, which is the Korea Composite Stock Price Index, the main board in Seoul, and it sits outside the top hundred names by market value, so I treat it as an observation and not as a position. What follows is my arithmetic on published numbers, and where that arithmetic stops.
Contents
Hanwha Life stock and an estimate that ran ahead
Start with the estimate itself, because it is doing most of the work in any bullish reading of this name. The 2025 earnings per share of 738 won and the 2026 consensus of 1,302 won are both taken from the same vendor screen I use for Korean names, read on September 11, 2026. Multiply the 738 won by the 868,530,000 shares in issue and you get 640.98 billion won of profit belonging to controlling holders for 2025 (derived). The reported consolidated figure for that year was 836.3 billion won, so 195.3 billion won belonged to minority holders of the subsidiaries (derived). Those two results reconcile, which is the first thing I check before I lean on a per-share number.
At the September 11 close of 5,980 won, the trailing earnings multiple is 8.10 and the forward multiple is 4.59. I reproduced both from the close and the two earnings figures, and they match the screen to two decimals. So the forward multiple is not a vendor artifact. It is simply what happens when the market price stands still and the estimate rises by more than three quarters.
What the first half actually delivered
The half-year report, released on August 12, 2026 (Wed), is genuinely strong and I want to say so plainly before I complicate it. Consolidated net profit was 904.5 billion won, up 96.0 percent year on year. Profit belonging to controlling holders was 771.9 billion won, up 119.8 percent. On a separate-entity basis the company earned 510.2 billion won, up 183.9 percent, split into 285.3 billion won of insurance result (up 62 percent) and 354.8 billion won of investment result (up 776 percent). These figures come from the Korean press coverage of the company’s own release; I have not read the audited statements.
The quarterly split is worth having. First quarter consolidated profit was 381.6 billion won, up 29 percent, so the second quarter carried 522.9 billion won (derived), or 1.3703 times the first (derived). Subsidiaries contributed 500.9 billion won in aggregate, of which Hanwha General Insurance provided 215.3 billion won, Hanwha Investment and Securities 55.7 billion won, and the overseas units 103.0 billion won.
Here is a small arithmetic point that I did not see flagged anywhere. The separate-entity result of 510.2 billion won plus the 500.9 billion won from subsidiaries comes to 1,011.1 billion won, which is 106.6 billion won more than the consolidated 904.5 billion won (derived). Consolidation eliminations account for that gap. I mention it because adding a parent result to a list of subsidiary results is an easy way to overstate a group, and I nearly did it myself.
The margin balance that did not follow
Under IFRS 17, an insurer’s contractual service margin is the unearned profit on policies already sold. It is released into earnings over the life of those policies. So it is the closest thing a life insurer publishes to a stock of future profit, and it is the number I want to see rise when a company tells me its new business is the best it has ever written.
Hanwha Life wrote 1,300.1 billion won of new business margin in the first half, up 40.5 percent year on year, split 610.9 billion won in the first quarter and 689.2 billion won in the second. Those two add exactly to the half-year figure, which is a small check I run on every pair of published subtotals. New business profitability was reported at 11.0 times, against 7.2 times a year earlier, and the thirteenth-month persistency ratio at 90.0 percent.
What 214.8 billion won means against 1,300.1
The carried balance of contractual service margin finished the half at 8,928.5 billion won, up 214.8 billion won from the end of 2025. So the opening balance was 8,713.7 billion won (derived). Set the 1,300.1 billion won written against the 214.8 billion won increase and 1,085.3 billion won is missing from the balance, which is 83.48 percent of what was written (derived).
I want to be careful about what that difference is and is not. A margin balance moves for several reasons at once: new business adds to it, accretion of interest adds to it, release into the current period’s earnings takes from it, and experience adjustments and lapses move it either way. The company publishes the roll-forward of those components in its supplementary disclosure, and I did not read that document. So I can tell you the net difference and I cannot tell you its composition. Anyone who tells you the whole 1,085.3 billion won was released into earnings is guessing, and so would I be.
Two more ratios out of the same figures, because they sharpen the point. New business margin of 1,300.1 billion won was up 40.5 percent year on year, which puts the prior first half at 925.3 billion won (derived). The carried balance meanwhile went from 8,713.7 to 8,928.5 billion won, a rise of 2.47 percent (derived). So production grew at roughly sixteen times the rate of the reservoir it feeds. Within the half itself the second quarter wrote 689.2 billion won against the first quarter’s 610.9, a gain of 12.82 percent (derived), so the production trend is intact and accelerating. It is only the retained stock that is not keeping pace.
The asset and liability durations give me one reason the investment line swung so hard. The company reported asset duration of 11.36 years against liability duration of 10.10 years, a gap of 0.93 years after its own adjustment. A positive gap of that size means the asset side reprices more slowly than the liability side, so a move in the Korean curve lands on the two sides at different speeds and shows up in the investment result before it shows up anywhere else. That is consistent with a 776 percent year-on-year move in a single line, and it is also why I treat that line as the least repeatable part of the half.
What I can say is what the difference does to the estimate. If the 2026 earnings lift rests on the insurance result, and the insurance result is fed by margin released from that balance, then a balance that grew by one sixth of what was written is a slower-building reservoir than the new business headline suggests. I have looked at the same pair of numbers for another Korean insurer and found the same reporting gap for an outside reader, which I wrote up in a piece on Hyundai Marine and the two lines US filings lack. That article was about the absence of a US disclosure equivalent. This one is about what the Korean disclosure does publish and how far it gets me.
Hanwha Life stock against eleven sell-side numbers
Eleven Korean houses carry estimates on this name. Their published valuations, with the dates I read them, run as follows: Hana 7,300 won on August 13, 2026 (Thu); Meritz 7,000 won on September 2, 2026 (Wed); Daol 7,000 won on August 18, 2026 (Tue); Kyobo 7,000 won on August 13; NH Investment 6,300 won on August 13; Hanwha Investment 6,100 won on July 14, 2026 (Tue); Shinhan Investment 6,000 won on August 18; iM 5,900 won on August 13; LS 5,800 won on August 13; KB 5,700 won on August 12; and Samsung 5,500 won on August 13, the only one of the eleven carrying a hold instead of a buy. The average of the eleven works out to roughly 6,354 won, which is 6.25 percent above the close (derived).
That last figure is the one I find strange. I read a lot of Korean coverage and the usual pattern is an average valuation sitting 30 to 90 percent above the market. Here the market is 6.25 percent below the average, the top of the range at 7,300 won is 22.07 percent above the close, and the bottom at 5,500 won is 8.03 percent below it (all derived). The spread from bottom to top is 1,800 won, which is 32.73 percent of the lower number (derived). Eleven houses raised their earnings estimates by three quarters and left their valuations within shouting distance of the price. I am reporting their numbers as market information; I have not adopted any of them as my own view.
Hanwha Life stock and a forward multiple moving down
The two facts fit together once you write them out. When estimates rise and the price does not, the forward earnings multiple falls mechanically. Hanwha Life’s went from 8.10 trailing to 4.59 forward. That decline is a statement about the estimate, and only indirectly about the company.
The half-year separate-entity profit of 510.2 billion won is already 1.6285 times the whole of 2025’s separate-entity profit of 313.3 billion won (derived), which tells you how much of the lift is simply the investment result recovering from a weak base. An investment result that rises 776 percent year on year is not a run rate. It is a comparison against a period when that line was close to nothing.
Aflac, where the same multiple moves the other way
For a peer I wanted a listed life insurer whose earnings are genuinely exposed to East Asian rates, and Aflac Incorporated (NYSE: AFL) is the cleanest one available to a US investor, since the majority of its insurance operations sit in Japan. On September 11, 2026 it traded at 114.60 dollars for a market value of 57.45 billion dollars across 501.34 million shares, on trailing earnings of 9.37 dollars per share and revenue of 18.07 billion dollars, with net income of 4.86 billion dollars, equity of 30.31 billion dollars and a return on equity of 16.91 percent. It pays 2.44 dollars a share, a yield of 2.13 percent, and its beta is 0.58 against Hanwha Life’s 0.50.
Only the items where the two disagree
Most of what I checked moved the same way for both companies, which is what you would expect from two life insurers in a rising rate environment: both grew earnings year on year, both carry low betas, both are priced well under the market’s average earnings multiple. Putting those side by side would fill a table without telling me anything. So I kept only the rows where the two point in opposite directions.
| Item | Hanwha Life | Aflac |
|---|---|---|
| Direction of this year’s earnings estimate | Rising: 738 won to 1,302 won | Falling: 9.37 dollars to about 7.31 (derived) |
| Direction of the forward earnings multiple | Down: 8.10 to 4.59 | Up: 12.22 to 15.68 |
| Cash paid to holders in the last two fiscal years | None declared | 2.44 dollars per share, 2.13 percent |
The implied forward earnings figure for Aflac in the first row is my own: 114.60 dollars divided by the 15.68 forward multiple gives 7.31 dollars, which is 22.00 percent below the trailing 9.37 (derived). I have not seen a published consensus in that form, so treat it as arithmetic on two screen values and nothing more. The trailing multiple reproduces cleanly, at 12.23 against the screen’s 12.22, a rounding difference.
What the three rows say together is that the two markets are doing opposite things with similar businesses. One set of analysts is marking earnings up and the price has not followed. The other set is marking earnings down and the price has held. I find the first situation more interesting to watch and considerably harder to trust, because a falling forward multiple looks like value and is produced by an estimate that has not yet been tested against a full year.


My stance on Hanwha Life stock and what breaks it
I am not holding this and I have no order working. My interest is in how the mismatch sits: an estimate that has moved a long way, a margin balance that has moved a short way, and a sell-side that raised the first without meaningfully raising its valuations. I would want to see the second half before I decided which of those three is the outlier.
There is a Korean life insurer I do hold a view on, and for a different reason entirely: I wrote up Samsung Life as a discounted proxy for its Samsung Electronics stake. That case rests on an asset I can value from outside the company. This one rests on a disclosure I have not fully read. The two are not substitutes for each other, and I am deliberately keeping my confidence in them at different levels.
- The margin roll-forward is unread. I have the net change and not its components. If the release into earnings is a smaller part of that 1,085.3 billion won than I assume, my framing is too severe.
- The investment result is a base effect. A 776 percent increase implies a prior period near zero on that line. Extrapolating it into 2027 would be an error, and some part of the 1,302 won estimate may be doing exactly that.
- The most cautious house is below the market. Samsung’s 5,500 won sits 8.03 percent under the close with a hold attached. That is a real disagreement from someone reading the same disclosure I am.
- Persistency is a lagging comfort. A 90.0 percent thirteenth-month ratio describes policies sold a year ago. It says nothing about how the record first-half production will persist.
- My own reading may be backwards. A margin balance that grows slowly while new business grows fast is also what a maturing portfolio releasing profit looks like, which is the benign reading of the same figures. I cannot separate those two stories from published figures alone.
So the conditions that end my interest are these. First, if the third quarter shows new business margin at or above the second quarter’s 689.2 billion won while the carried balance again rises by less than a fifth of what was written, then the pattern is structural and the earnings estimate is leaning on a reservoir that is not filling. Second, if the full-year separate-entity result lands below 1.6285 times the 2025 figure despite the first half already being at that level, then the second half reversed, and the 4.59 forward multiple was measuring a number that never arrived.
Prices and multiples reflect the September 11, 2026 close as I checked them at the time of writing. Korean won is the reference currency throughout and the one dollar conversion is approximate, at about 1,347.63 won per dollar on that date. Screen data for the Korean name is from WiseReport; half-year results are from Korean press coverage of the company release, including The Herald Business and Seoul Economic Daily, with the contractual service margin detail from Herald Corp’s Korean edition; peer figures are from StockAnalysis; the exchange rate is from Investing.com. Figures marked derived are my own arithmetic on those published numbers.
Related reading