
Korea’s PHA: 40% of Pre-Tax Profit Is Below the Operating Line
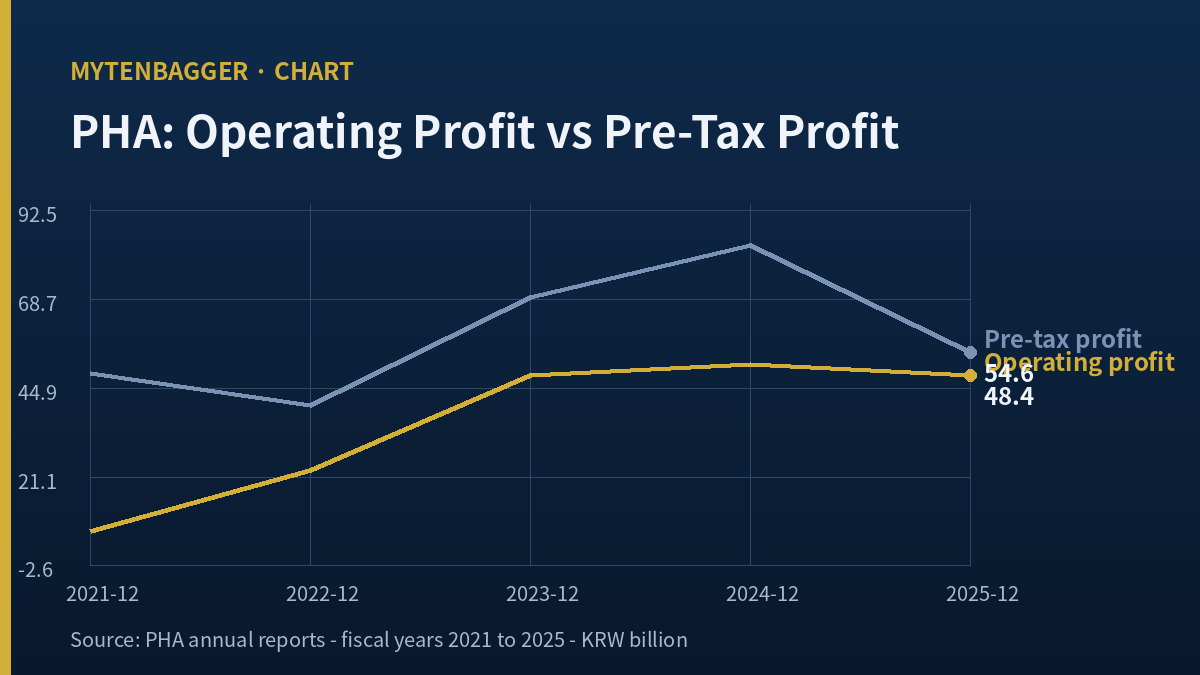
PHA stock closed at KRW 11,240 (about $8.27) on September 23, 2026. Over the five years from 2021 to 2025, the company recorded KRW 177.67 billion of operating profit and KRW 296.58 billion of pre-tax profit, so KRW 118.91 billion, or 40.1% of everything it earned before tax, came from lines that sit under operating profit. Over the latest twelve months, gross profit also slipped 3.3% while sales grew 4.7%.
| KRW bn | 2021 | 2022 | 2023 | 2024 | 2025 | Five-year sum | 12 months to June 2026 |
|---|---|---|---|---|---|---|---|
| Operating profit | 6.58 | 22.87 | 48.29 | 51.48 | 48.44 | 177.67 | 43.24 |
| Pre-tax profit | 48.89 | 40.46 | 69.35 | 83.26 | 54.62 | 296.58 | 64.02 |
Source: Stock Analysis, PHA annual income figures. Five-year sum is my addition of the five annual columns.
I hold no shares and I am not building a position. PHA is the former Pyeong Hwa Automotive, a KOSDAQ-listed maker of door modules, door latches and hinges whose customers include Hyundai Motor and Kia. At about KRW 236 billion of market value, roughly $174 million, it is a small supplier, and my rule for names this size is to observe and write things down. This entry is about one question I kept returning to: how much of the profit I see on screens is made in the factories, and how much comes from somewhere else on the income statement?
Contents
PHA stock and the gross profit that stopped following sales
I start at the top of the income statement because that is where a parts supplier either earns its keep or does not. For the twelve months to June 2026, PHA’s sales were KRW 1,207.20 billion, about $889 million. In calendar 2024 they were KRW 1,152.88 billion. That is a gain of KRW 54.32 billion, or 4.7%.
It went the other way at the gross level. Gross profit was KRW 150.50 billion in 2024 and KRW 145.50 billion for the latest twelve months, down KRW 4.99 billion, or 3.3%. Per 100 won of sales, the company kept 13.05 won after production costs in 2024 and 12.05 won in the latest twelve months, by my arithmetic from the same Stock Analysis table.
One won per 100 does not sound like much. On sales of KRW 1.2 trillion, it is about KRW 12 billion a year, and operating profit over the latest twelve months was KRW 43.24 billion. So that single point of slippage is worth more than a quarter of what the factories now earn after selling and administrative costs. That is the first fact I wanted written down.
I did not find a company explanation for the slippage. Two plausible causes are the start-up cost of the Georgia factory that began supplying Hyundai’s US electric-vehicle complex, and the India factory that Hana Securities analyst Song Sun-jae expected to start production in 2026 (reported by Dailyinvest in August 2025, in Korean). New factories usually run below capacity at first, and fixed costs land before volume does. That is my own hypothesis; the company has not disclosed a reason.
Five years of PHA stock earnings, split at the operating line
The second fact is lower down. Here is how much of each year’s pre-tax profit came from below operating profit, meaning pre-tax profit minus operating profit, divided by pre-tax profit. These are my own calculations from the annual table above.
- 2021: KRW 42.30 billion from below the line, 86.5% of pre-tax profit.
- 2022: KRW 17.59 billion, 43.5%.
- 2023: KRW 21.05 billion, 30.4%.
- 2024: KRW 31.78 billion, 38.2%.
- 2025: KRW 6.18 billion, 11.3%.
- Twelve months to June 2026: KRW 20.78 billion, 32.5%.
The five-year total is KRW 118.91 billion, about $87.5 million at today’s rate. The pattern is lumpy. 2021 was the year Hana Securities blamed a shortage of automotive chips for falling sales at PHA’s Korean, US and Chinese units (Edaily, November 2021, in Korean), and operating profit nearly vanished, so the below-the-line income carried almost the whole result. 2025 was the opposite, with operating profit carrying almost everything. The latest twelve months sit below the five-year average but well above 2025.
The quarterly split from the same vendor shows the swing more clearly. In the October to December 2024 quarter, pre-tax profit exceeded operating profit by KRW 15.96 billion. In the April to June 2025 quarter the difference was negative, at minus KRW 4.79 billion. In January to March 2026 it was back to plus KRW 9.69 billion, against operating profit of KRW 13.28 billion that quarter. So in the first quarter of this year, the lines under operating profit added the equivalent of about 73% of what operations earned.
Eight quarters side by side
I put the eight most recent quarters Stock Analysis shows for PHA into one table, because the annual totals hide how uneven this is. The last column is my subtraction of operating profit from pre-tax profit.
| Quarter (KRW bn) | Operating profit | Pre-tax profit | Below-the-line result |
|---|---|---|---|
| Apr to Jun 2024 | 13.82 | 21.13 | 7.31 |
| Jul to Sep 2024 | 11.29 | 13.28 | 2.00 |
| Oct to Dec 2024 | 9.98 | 25.94 | 15.96 |
| Jan to Mar 2025 | 17.00 | 19.62 | 2.61 |
| Apr to Jun 2025 | 13.51 | 8.72 | -4.79 |
| Jul to Sep 2025 | 9.53 | 14.48 | 4.96 |
| Oct to Dec 2025 | 9.06 | 11.78 | 2.73 |
| Jan to Mar 2026 | 13.28 | 22.97 | 9.69 |
Source: Stock Analysis, PHA quarterly income figures. The April to June 2026 quarter was not yet posted there when I checked. This vendor’s quarterly operating profit can differ slightly from the figure in Korean regulatory filings for some quarters, so I kept every number in this table from the one vendor.
Two things stand out. First, the below-the-line result was positive in seven of eight quarters, and the one negative quarter was small. So this is a steady contributor, which argues against calling it a one-off. Second, the largest positive quarter, October to December 2024, came with one of the weakest operating quarters in the table, while the one negative quarter came with a solid operating result. The factories and the income underneath them move on separate schedules, which is what I would expect if a meaningful part comes from associates and currency.
What sits below the line, and what I could not see
Stock Analysis groups most of this income into one row it calls earnings from equity investments and other non-operating items. It does not split that row further, and I did not open the notes to PHA’s Korean-language semiannual report, where the components would be listed. What I can say is limited to three observations.
Associates are part of it
PHA carries investments in associates on its balance sheet. The balance was KRW 53.81 billion at the end of 2025 and KRW 46.66 billion at the end of June 2026, per the Stock Analysis quarterly balance sheet. A drop of KRW 7.15 billion in six months, during a period when the non-operating row was positive, suggests that cash came back from those associates, through dividends or a sale. I could not confirm which. I also could not confirm which associates they are, because the vendor’s balance sheet gives one total and the company notes would name them.
Interest is too small to matter
Interest expense is tiny. Stock Analysis shows it at KRW 0.37 billion in January to March 2026 and between roughly KRW 0.15 billion and KRW 0.40 billion in other recent quarters. So the swing below the operating line is coming from somewhere else: associates, foreign exchange on overseas subsidiaries, or one-off gains. I would guess foreign exchange plays a role, because Hana’s 2021 note describes PHA operations in the US, India, Vietnam, the Czech Republic and Slovakia, but a guess is all it is.
Where I started in the wrong column
Net profit was the number I copied first when I opened this company, and it looked healthy. Twelve months to June 2026 showed KRW 57.41 billion of net profit against KRW 43.24 billion of operating profit, and my first reaction was that the company had simply had a good run in its factories. It took me longer than I would like to admit to notice that net profit was larger than operating profit, which cannot happen from operations alone. The lesson I am keeping is small and practical: on a small Korean supplier, I now look at the gap between operating and pre-tax profit before I look at any valuation multiple.
A low tax charge adds to the effect
There is a second layer of lift between operating profit and net profit, and it comes from tax. Over the latest twelve months, income tax took KRW 6.61 billion from KRW 64.02 billion of pre-tax profit, a charge of 10.3% by my calculation. In 2024 it took KRW 21.32 billion from KRW 83.26 billion, or 25.6%. The difference could come from where profit was earned, from tax credits tied to new investment, or from how associate income is taxed. I could not confirm which, and I did not look up whether Korea’s statutory rate changed over the period.
Put the two effects together and the path from factory to net profit looks like this for the latest twelve months: KRW 43.24 billion of operating profit, plus KRW 20.78 billion from below the line, minus KRW 6.61 billion of tax, ends at KRW 57.41 billion of net profit. Net profit is 33% larger than operating profit. For a supplier whose appeal to many investors is a low earnings multiple, that matters, because the multiple is computed on net profit.
That is also why I left valuation multiples out of this entry. The screens I checked do not even agree with each other: one Korean data service showed a trailing price-to-earnings ratio of 4.33 and another, the Kiwoom feed, showed 5.08, and I could not reconcile the two. When the earnings number underneath depends this much on lines I cannot fully see, a precise multiple adds false confidence.
KOSDAQ suppliers and the Hyundai orbit
For readers outside Korea, some context. KOSDAQ is Korea’s second board, home to smaller and younger companies than the main KOSPI market. Many of Hyundai Motor Group’s second- and third-tier suppliers list there, and they can trade at low multiples when their fortunes depend on one customer group’s production schedule. PHA is one of them, listed on KOSDAQ since December 2001 according to the Dailyinvest article cited above. Its customer list is wider than Hyundai and Kia alone, with GM among the carmakers it has supplied, but the Hyundai group sets the pace of its expansion outside Korea.
That dependence cuts both ways. When Hyundai and Kia expand overseas, suppliers follow with their own factories, as PHA did in Georgia, investing about $67 million according to The Guru (in Korean). When the carmakers slow down, suppliers carry the cost. I wrote about a larger Korean auto supplier in my HL Mando entry, where the question was how the market prices years of committed orders.
Another supplier where debt below the operating line mattered was DN Automotive, which still carries debt from buying a machine tool business in 2022. I followed that in my DN Automotive entry. PHA’s situation is milder, since it has little debt, but the lesson is the same: the operating profit line and the net profit line can tell very different stories about the same company.
A related observation about this group of companies: foreign investors hold about 14.9% of PHA, per the Kiwoom data I used for the market value, which is modest for a company with this much overseas production. Much of the trading is domestic.
PHA stock next to Strattec, a US lock maker
For a peer I wanted a US-listed company that makes the same kind of hardware and whose fiscal year ends in June 2026, so both twelve-month periods cover the same calendar months. Strattec Security Corporation (NASDAQ: STRT), a maker of vehicle locking and access products, fits. Its fiscal 2026 ended on June 28, 2026.
I am comparing one thing only: which direction gross profit per dollar of sales moved. According to Stock Analysis’s Strattec financials page, Strattec kept 16.46 cents of gross profit per dollar of sales in fiscal 2026, up from 14.97 cents in fiscal 2025. PHA moved from 13.05 won per 100 won in 2024 to 12.05 won per 100 in the twelve months to June 2026.
So over roughly the same stretch of time, a US maker of the same parts improved while PHA slipped. I am not comparing size, operating profit, valuation or anything else, because the two companies have different customer mixes, currencies and accounting periods, and one direction check is all I trust at this distance. Stock Analysis also lists a Korea line in Strattec’s geographic sales, which surprised me. I did not look into what sits behind that line, so I am not drawing anything from it.
The sales side of the two companies is closer. Strattec’s revenue for fiscal 2026 was $579.39 million, up 2.54% from the prior year, on the same Stock Analysis page. PHA’s twelve-month sales grew 4.7% from calendar 2024, in won. Both are growing slowly, so neither company is buying its gross result with a sales surge. That makes the direction check fairer than it would be between a fast grower and a slow one.
What the comparison does tell me is that the slippage at PHA is probably not an industry-wide squeeze on door hardware pricing. If it were, I would expect Strattec’s number to move the same way. That pushes me back toward company-specific explanations, such as new-factory costs.
The case that PHA stock is cheaper than my worry
There is a strong opposing read, and I want it written out in full.
- The sell-side has been positive. In August 2025, Hana Securities’ Song Sun-jae kept a buy rating and put fair value at KRW 15,000, citing North American sales growth in the April to June 2025 quarter from the Georgia factory and currency, and growth from US operations through 2030. In June 2024, Hana had expected Georgia sales to reach KRW 70 billion in 2025 and more than KRW 100 billion in 2026 (Insight Korea, June 2024, in Korean). If that ramp is happening, the gross slippage is a start-up cost that fades.
- A consensus page still shows a buy. Hankyung’s consensus page lists an opinion of buy and an objective of KRW 13,000, with forward earnings per share of KRW 2,554. I could not see which brokerage or date that number comes from, and I found no named brokerage report with 2026 or 2027 estimates from the past three months.
- Below-the-line income is not fake income. Associates and currency gains are real money. A company that has earned from associates for years may keep doing so, and the tax charge on pre-tax profit was only 10.3% over the latest twelve months, by my calculation, compared with 25.6% in 2024.
- The balance sheet is strong. Cash and short-term financial instruments well exceed borrowings, so even a weak year at the operating level would not strain the company.
Each of these is reasonable. The first one bothers me most, because it gives a clean explanation for exactly the pattern I am worried about.
Two paths for the July to September numbers
The third-quarter report is due by November 16 (Mon), 2026. I see two ways it can go, with my own rough odds.
Path one, about 45% in my view: the India factory adds sales, gross profit per 100 won of sales moves back above 12.5 won, and operating profit for July to September rises above the KRW 9.53 billion Stock Analysis shows for the same quarter of 2025. In that case the below-the-line share of pre-tax profit falls simply because the operating line grows, and my concern shrinks.
Path two, about 55% in my view: sales keep inching up but the gross result per 100 won stays near 12, and the quarter’s pre-tax profit again depends on a positive swing below the operating line. In that case, I would treat the reported net profit as less repeatable than it looks, because the lines under operating profit have already shown they can turn negative, as they did in April to June 2025.
My odds lean toward path two because the latest quarter I have full detail on, January to March 2026, already showed a large below-the-line contribution. I would be glad to be wrong. The 45 and 55 are my judgment and nothing more; no model sits behind them, and I will record in November which way the quarter actually went so the odds can be checked against the result.
What would change my mind on PHA stock
These are the conditions I will check against the third-quarter report and the full-year results. I list them so I cannot shift the goalposts later.
- Gross profit per 100 won of sales for July to September back above 12.5 won.
- July to September operating profit above KRW 9.53 billion.
- Below-the-line income under 20% of pre-tax profit for the first nine months of 2026.
- A disclosed breakdown of the non-operating row that shows recurring associate income as the main source.
- India factory sales mentioned in the company’s report or a named brokerage note, with a figure attached.
- Georgia sales for 2026 disclosed at or above the KRW 100 billion Hana expected.
- No quarter in 2026 with a negative below-the-line result.
- A named brokerage report with a 2026 or 2027 estimate I can read and attribute.
One data point already tells me where the third condition starts. For January to June 2026, the semiannual figures I pulled from Korea’s disclosure system through a data service show net profit of KRW 32.64 billion against operating profit of KRW 24.66 billion. That is a gap of KRW 7.98 billion even after tax, so the pre-tax gap is at least that large, roughly a third of operating profit. That is why the third condition is set at 20% and not lower. It will take a weak below-the-line result in July to September, or a much stronger operating quarter, to bring the nine-month figure under that line.
I also want to be honest about what I am not checking. I am not modeling the won. PHA’s overseas subsidiaries report in their local currencies, and currency swings can move both the operating line and the lines below it. A careful analyst would separate the currency effect before judging the factories. I do not have the subsidiary-level data to do that, so my conditions are written on reported figures only, and I accept that they may flag a currency effect as an operating problem.
If the first three hold together, I will move from watching to a real valuation exercise. If the first two fail and the seventh fails too, I will conclude that the factories are earning less than the reported profit suggests, and I will stop treating the low price as a signal on its own.
Why I’m still only watching PHA stock
I came into this company expecting a cheap, well-run supplier and found something more complicated. Sales are growing slowly. What it keeps per won of sales after production costs is slipping while a US peer’s improved. And over five years, four won of every ten of pre-tax profit came from under the operating line, from sources I could only partly identify. None of that makes PHA a bad company. It makes the reported profit harder for me to rely on.
The first figure I will write into this journal in November is gross profit per 100 won of sales for July to September. If it is back above 12.5, I will reread everything above with a friendlier eye.
Share price and market value reflect the September 23, 2026 close in Seoul (KRW 11,240; 21 million shares outstanding). Dollar figures are approximate, converted at roughly KRW 1,358 per dollar on the same date. Percentages and differences marked as mine are calculated from the cited tables.
Related reading