Kolmar Korea Stock: A Quarter of the Profit Is Not Mine
Start with one subtraction. Kolmar Korea reported consolidated net income of 168.2 billion won ($118.1 million) for 2025. Divide that by the 23,605,083 shares outstanding and you get 7,125.6 won a share. The earnings per share my data vendor treats as authoritative is 5,297.77 won. The gap is 1,827.8 won per share, and it is not a rounding problem. It is the part of the profit that gets made inside this company and then belongs to somebody else. That gap is the reason I have not bought Kolmar Korea stock at 102,300 won ($71.81), even though I like one specific line of its business quite a lot.
Kolmar Korea trades on the KOSPI, the senior board of the Korea Exchange, where the country’s largest industrial and consumer names list. It is one of the two dominant Korean cosmetics ODMs, the contract developers and manufacturers that formulate and produce products sold under other companies’ brands. If you have used COSRX, Beauty of Joseon, Anua, Round Lab or Medicube, you have used something made in a factory like this one. The brands get the shelf space. The manufacturers get the volume.
Contents
The one line I wanted from Kolmar Korea stock
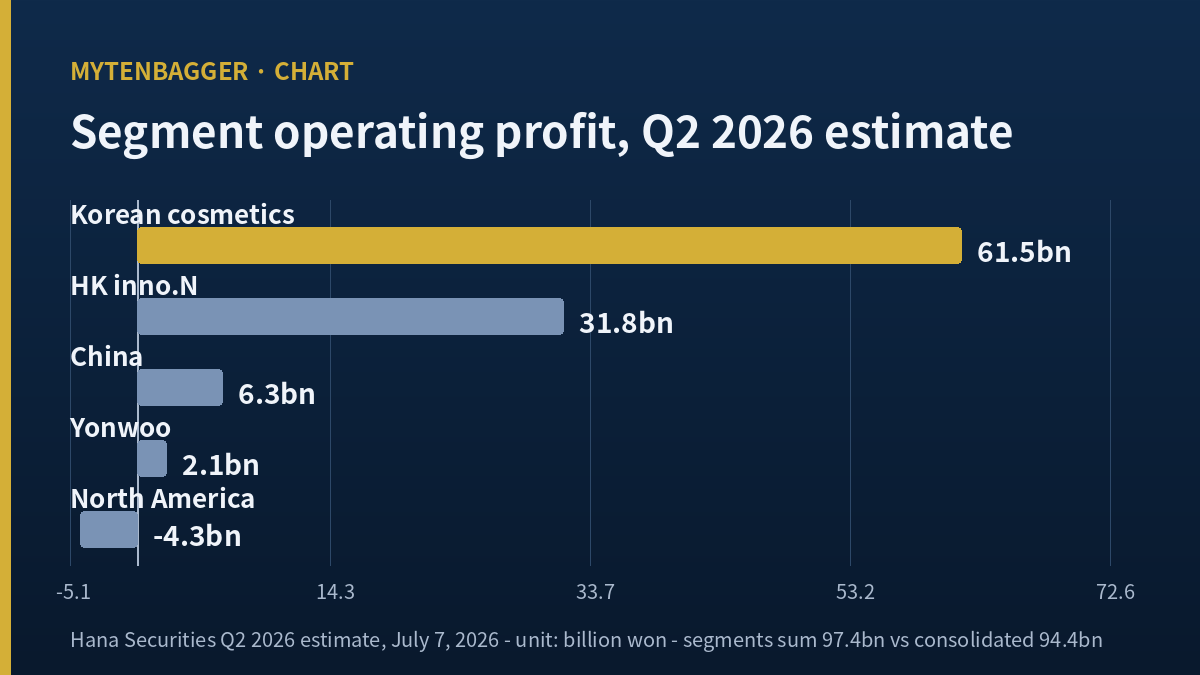
Hana Securities published second-quarter segment estimates on July 7, 2026 (Tuesday). The Korean domestic cosmetics operation is modeled at 410.2 billion won ($287.9 million) of revenue and 61.5 billion won ($43.2 million) of operating profit, a 15.0% operating margin. For a business that manufactures other people’s products, that margin is unusual, and it is the line I would buy on its own if buying single lines were possible.
It is not. The share sells the whole table. Below is what one share brings home each quarter, using the same estimate and dividing by the share count.
| Segment | Est. operating profit | Per share (my calculation) |
|---|---|---|
| Korean cosmetics operation | 61.5bn won | 2,605.4 won |
| HK inno.N (pharmaceuticals) | 31.8bn won | 1,347.2 won |
| China | 6.3bn won | 266.9 won |
| Yonwoo (packaging) | 2.1bn won | 89.0 won |
| North America | loss of 4.3bn won | less 182.2 won |
| Segments added up | 97.4bn won | 4,126.2 won |
| Consolidation effects (my calculation) | less 3.0bn won | less 127.1 won |
| Consolidated total | 94.4bn won ($66.3m) | 3,999.1 won |
The first thing I did with that table was check whether it adds up, and it does not, in an informative way. The five segments sum to 97.4 billion won while the consolidated line reads 94.4 billion. Revenue does the same thing: segments sum to 840.9 billion won against a consolidated 831.5 billion ($583.7 million). Three billion won of profit and 9.4 billion won of revenue disappear between the two rows. That is intercompany trade being removed, and at that size it tells me the packaging subsidiary is shipping a visible share of its output into the Korean cosmetics operation. Anyone reading a segment table for this company and simply adding the columns will overstate it.
The proportions are what matter to me. On these estimates the Korean cosmetics operation produces 65.1% of quarterly operating profit and the pharmaceutical subsidiary 33.7% (both my calculations). China and packaging together contribute 8.9%. North America takes 4.6% away. Read literally, the Korean brokerage estimate describes a cosmetics manufacturer and a drug company bolted together at roughly two to one.
Kolmar Korea stock and the pharmaceutical third
HK inno.N is the former CJ HealthCare, acquired by Kolmar Korea and later renamed. On the same estimate it books 276.3 billion won ($194.0 million) of second-quarter revenue and 31.8 billion won ($22.3 million) of operating profit, an 11.5% margin by my calculation, which is 33.2% of consolidated revenue.
Here is where two numbers pull against each other. The subsidiary supplies a third of the revenue, but the parent does not own a third of it. BNK Investment Securities, in a coverage initiation dated May 6, 2026 (Wednesday), put the stake at 43.0% as of 2025 and the segment’s revenue share at about 31%, and stated plainly that its valuation method deducts the portion attributable to minority holders.
Consolidation accounting is why the two coexist. When a parent controls a subsidiary it pulls 100% of that subsidiary’s revenue and operating profit into the group statements, then removes the outside owners’ share far down the page, below net income. So HK inno.N appears whole in the revenue line and whole in the operating profit line, and 57% of it exits only at the bottom. Read the top of the statement and this is a large company. Read to the bottom and it is somewhat less of one.
The corporate structure itself was reclassified recently. Korean press reported on May 27, 2026 (Wednesday) that Kolmar Korea lost its holding-company status effective December 31, 2025, because the value of its subsidiaries fell below the 50% threshold that definition requires. It moved from intermediate holding company to operating company. Above it, the chairman holds 31.75% of Kolmar Holdings and Kolmar Holdings holds 26.31% of Kolmar Korea.
I do not read that reclassification as bad news. The more likely explanation is that the operating business grew and the subsidiaries shrank in relative terms, which fits the earnings. But a change in legal classification does not change who owns the profit. The company is an operating company now, and a quarter of the bottom line still leaves for another pocket.
Where 43.1 billion won of profit goes
This figure is not printed anywhere I could find. I worked backward to it. Multiply the vendor’s authoritative earnings per share of 5,297.77 won by 23,605,083 shares and you get 125.05 billion won ($87.8 million). Consolidated net income for 2025 was 168.2 billion won. The difference, 43.15 billion won ($30.3 million), is the minority holders’ share, or 25.65% of the total by my calculation.
Before building anything on that, I checked it a second way, through dividends. The declared dividend of 864 won a share across the same share count comes to 20.395 billion won ($14.3 million) paid out. Divide that by consolidated net income and you get a 12.13% payout ratio. My vendor prints 16.3%. Divide the same payout by 125.05 billion won and you get 16.31%. The payout ratio is struck against profit attributable to owners of the parent, not against the consolidated figure, which means the 125.05 billion won I reverse-engineered is the right number. Two independent routes landing on the same base is the most confidence I can get without the filing in front of me.
Professional analysts see this too. The BNK method note about deducting minority interest is the same adjustment, written down in a research document. My complaint is not that anyone is hiding it. My complaint is that it lives inside a PDF while the numbers most people actually look at, the net margin and the market capitalization on a quote page, carry no trace of it.
Kolmar Korea stock against Cosmax and Intercos
I set the three listed contract manufacturers I can compare side by side and computed net margin twice: once as the consolidated statement prints it, once with only the owners’ portion left in.
| Company | Consolidated net margin | Owners’ portion (my calculation) | P/E |
|---|---|---|---|
| Kolmar Korea | 6.18% | 4.59% | 19.31 |
| Cosmax | 5.47% | 5.13% | 17.98 |
| Intercos (Italy) | 4.75% | could not confirm | 26.20 |
The two Korean names are on Kiwoom data at the August 5, 2026 (Wednesday) close. Intercos is on figures the page dated July 20, 2026 (Monday): 13.18 euros a share, a 1.29 billion euro capitalization, 1.05 billion euros of trailing revenue and 49.83 million euros of trailing net income, from which the 4.75% margin is my calculation. The dates differ and I have left them differing instead of pretending otherwise. Cosmax‘s owners’ portion came from the same reverse route: earnings per share of 10,845.38 won times 11,349,744 shares is 123.09 billion won, or 93.9% of its 131.1 billion won consolidated net income.
On the upper row Kolmar Korea keeps more of every won of revenue than either peer. On the lower row 6.18% becomes 4.59%, which puts it behind Cosmax at 5.13% and below even the consolidated margin of Intercos, a company trading at a much richer multiple. Nothing changed except which layer of the income statement I stopped at. I could not confirm the minority share at Intercos, so that cell is blank and the table is not a fully like-for-like comparison. I would rather say that than fill the cell with a guess.

Five valuations on Kolmar Korea stock
| Firm | Dated | Valuation | vs close (my calculation) |
|---|---|---|---|
| Hana Securities | Jul 7, 2026 (Tue) | 140,000 won | 36.9% above |
| Hanwha Investment (Han Yu-jeong) | Jun 23, 2026 (Tue) | 120,000 won | 17.3% above |
| LS Securities (Oh Rin-a) | Jun 9, 2026 (Tue) | 120,000 won | 17.3% above |
| BNK Investment (Kim Ji-eun) | May 6, 2026 (Wed) | 112,000 won | 9.5% above |
| Yuanta Securities (Lee Seung-eun) | Mar 3, 2026 (Tue) | 88,000 won | 14.0% below |
Four of the five sit above the August 5 close and only the oldest sits below. Hana raised from 110,000 won. Hanwha held its figure while writing that the second quarter would beat expectations. Yuanta trimmed from 90,000 to 88,000, a 2.2% cut, under a heading that called the domestic outlook clear and North America overcast.
The annual estimates diverge more than the quarterly ones. Hanwha modeled 2026 revenue of 3.097 trillion won and operating profit of 312.0 billion won; BNK modeled 2.948 trillion won and 276.0 billion won. That is 149.0 billion won apart on revenue, 5.1% by my calculation, and 36.0 billion won apart on operating profit, 13.0%. Yet the second-quarter numbers barely move: 93.5 billion won at Hanwha against 94.4 billion at Hana, a 1.0% gap, with revenue at 830.9 billion and 831.5 billion. Agreement on the quarter and disagreement on the year tells me the argument is not about what the business is earning now. It is about what gets added to it after the summer.
Kolmar Korea stock already sits at the peer multiple
BNK printed its arithmetic, which I appreciate. Twelve-month forward earnings per share of 6,384 won times a multiple of 17.6 equals 112,249 won. The 17.6 is built from a 16.3 base, taken from the twelve-month forward multiples of Cosmax and Intercos, plus an 8.0% premium for the domestic margin and new multinational orders.
So where does the current price stand against that construction? Divide the 102,300 won close by the same 6,384 won and you get 16.02, my calculation, which is the base multiple almost exactly, before any premium. Holding that forward figure fixed and converting each published valuation into a multiple gives this:
- Hana at 140,000 won implies 21.93 times
- Hanwha and LS at 120,000 won imply 18.80 times
- BNK at 112,000 won implies 17.54 times
- Yuanta at 88,000 won implies 13.78 times
Every one of those uses BNK’s earnings figure, not each firm’s own, so they are a common-scale exercise and not a report of what any analyst assumed. With that caveat stated, the exercise still shows something. The market is already paying this company what its listed peers get. The distance from 88,000 to 140,000 is driven less by disagreement over profits than by how much premium each firm is willing to add. The premium rests on the domestic margin and on North America recovering, and one of those two is still a loss.
Five things that push back on me
Here is the case against my own conclusion. Five items; the third one is the one that stings.
1. The end market is genuinely strong. Korean cosmetics exports reached $11.4 billion in 2025, up 11.8%, which made the country the world’s second-largest beauty exporter, passing the United States and trailing only France, on a record $10.1 billion trade surplus. Shipments to the United States hit about $2.2 billion, making America the largest destination for the first time. Through the first five months of 2026 exports ran at $5.6 billion against $4.6 billion a year earlier, and European shipments through April were $820 million, up 60%, according to Korean reporting on the indie-brand boom. That same reporting notes Cosmax and Kolmar Korea each cleared a trillion won of ODM sales in 2025.
2. The first quarter was already good. Korean coverage on May 11, 2026 (Monday) put first-quarter revenue at 728.0 billion won, up 12%, operating profit at 78.9 billion won, up 32%, and net income at 60.0 billion won, up 159%. The net figure flatters itself against a soft base, but the operating line improved by a third on its own.
3. The North American loss I object to is already shrinking. Korean coverage of a Hanwha note dated May 8, 2026 (Friday) reported first-quarter US revenue of 13.4 billion won, down 38.4%, with the operating loss at 3.7 billion won, narrowed by 4.6 billion from the prior quarter. A loss moving in the right direction is a direct hit on my thesis, and I am not going to soften that.
4. Most of the sell-side looks up. Four of five published valuations sit above the close, and the most recent one is the highest of them.
5. The screening metrics pass and the dividend keeps rising. The company clears six of my vendor’s seven checks for a score of 86, with return on equity at 14.7%; the only failure is the earnings multiple. Regulatory filings show dividends per share of 500, 600, 720 and 864 won for 2022 through 2025, three consecutive increases, with the payout ratio at 16.3% and room to spare.
What a screener will not tell a US investor here
Data providers disagree about which profit is yours
This is the access problem specific to this company, and it is not really about access at all. Different data services normalize net income differently. Some carry the consolidated figure, some carry the amount attributable to the parent’s owners, and the label on the screen rarely says which. That means a US investor pulling Kolmar Korea into a comparison table may see a 6.18% net margin or a 4.59% one depending entirely on which service they used, and both will look authoritative. The segment detail that explains the difference exists mostly in Korean-language brokerage documents. I did the reverse calculation myself because I did not want to inherit somebody else’s choice of layer.
The mechanical part
I could not find an American depositary receipt for this name, so as far as I can tell exposure means holding the Korean listing. Settlement happens in won, which puts the currency into the return whether or not that was intended, and the Korea Exchange requires an account specifically enabled for it. The broad Korea funds are built around the large caps, and I did not verify whether this name appears in them at all.
Kolmar Korea stock: what I am doing about it
I do not own it and I have no order working. The reason is not the price and it is not the earnings. The reason is that I cannot buy the part I want by itself. Taken alone, the Korean cosmetics operation is a 15.0% operating margin business sitting in front of an export market growing more than 40% year over year. But the smallest unit this stock sells is not that line, it is the whole table. Buy one share and you receive 3,999 won of quarterly operating profit, of which 1,347 comes from a drugmaker and 182 is removed by North America, and at the annual net line 1,827.8 won a share departs for owners who are not me.
None of that is a criticism of management. It is the ordinary shape of a company built through acquisition, and holding 43.0% of a profitable pharmaceutical business may well have been a good decision. I simply do not find the bundle attractive at this price. If the domestic margin is the reason to buy, the entity producing that margin accounts for 65% of group operating profit, and the rest comes from businesses I did not choose and from a stake I do not get to hold.
Two conditions that bring me back
First, North America turning profitable on a quarterly basis. Yuanta modeled the US entity at 60.0 billion won of annual revenue with a 15.0 billion won operating loss and the Canadian entity at 35.0 billion won with a 5.0 billion won loss, roughly a 20 billion won ($14.0 million) hole in total. Fill it and the negative line vanishes from the segment table, and the premium the sell-side adds stops being a forecast and becomes a result.
Second, the owners’ share rising above 80%. It is 74.35% today. Whether the company buys more of HK inno.N or sells out of it, either direction simplifies who owns the profit, and I can go back to trusting the upper row of the income statement.
What would make me wrong
If domestic operating leverage runs hotter than I expect and the owners’ net margin climbs above the 5.13% I calculated for Cosmax, I withdraw the premise of this piece. That outcome would mean the inability to unbundle was a complaint about form and not a fact about returns, and I would have to write down that I passed on a good business for a structural reason. I set the threshold using a competitor’s figure on purpose, so I cannot quietly move it later.
The shape recurs elsewhere in what I follow. Samsung Biologics is the same contract-manufacturing model in drugs, where I stopped at the multiple instead of the ownership question. LG Innotek showed me a case where the profit came from the part of the business I was not buying it for, which is very close to what is happening here. And NAVER was a company whose reported profit and market price were pointing opposite ways. In two of those I bought or held. The difference each time was whether the part that comes along adds to the case or subtracts from it. Here it subtracts.
How I checked the numbers behind Kolmar Korea stock
Price, capitalization, multiples and dividend metrics come from Kiwoom data at the August 5, 2026 (Wednesday) close of 102,300 won. I wrote this early on August 6 (Thursday), before the Korean market opened, so the previous session’s close is the reference. Korean won is the reference currency throughout; dollar figures are approximate, converted at roughly 1,424.5 won per dollar, the Seoul close on the same date, which fell 8.0 won that session.
The capitalization of 2.4148 trillion won ($1.70 billion) reproduces to the won from the close times 23,605,083 shares. Paid-in capital of 11.8 billion won divided by that share count gives 499.9 won, matching the 500 won par value, so the share count itself is internally consistent. I found no bonus issue, rights offering, stock split or treasury cancellation filed in the last six months, and the vendor’s split-detection flag is off.
Price position uses the same close throughout. The stock is 17.90% below the 124,600 won intraday high of the last 250 sessions and 68.81% above the 60,600 won low. Period returns read minus 11.96% over one month, plus 15.59% over three, plus 50.22% over six and plus 6.67% over twelve, which works back to roughly 116,200 won a month ago and roughly 68,100 won half a year ago. It rose by more than half in six months and gave part of that back in the last one.
Three vendor fields did not survive checking and I left them out. The EBITDA field reads 78.9 billion won against operating profit of 239.6 billion won for the same year, which is an order-of-magnitude break. Total equity would not reproduce the printed 14.7% return on equity by any route I tried, so I used it for nothing. The raw payout-ratio field of 73.4% could not be rebuilt from any combination of the other figures. Free cash flow of 40.4 billion won did reproduce, from the 1.67% free cash flow yield against the capitalization, so I used it once above.
Second-quarter results were not published at the time of writing. The first table here is entirely brokerage estimate, and once the actual figures land, the segment numbers and everything I calculated on top of them will need revisiting. I could not confirm the scheduled announcement date and so did not put one in the text.
Related reading