KSS Line Stock Buyback: What Dividing the Filing Reveals
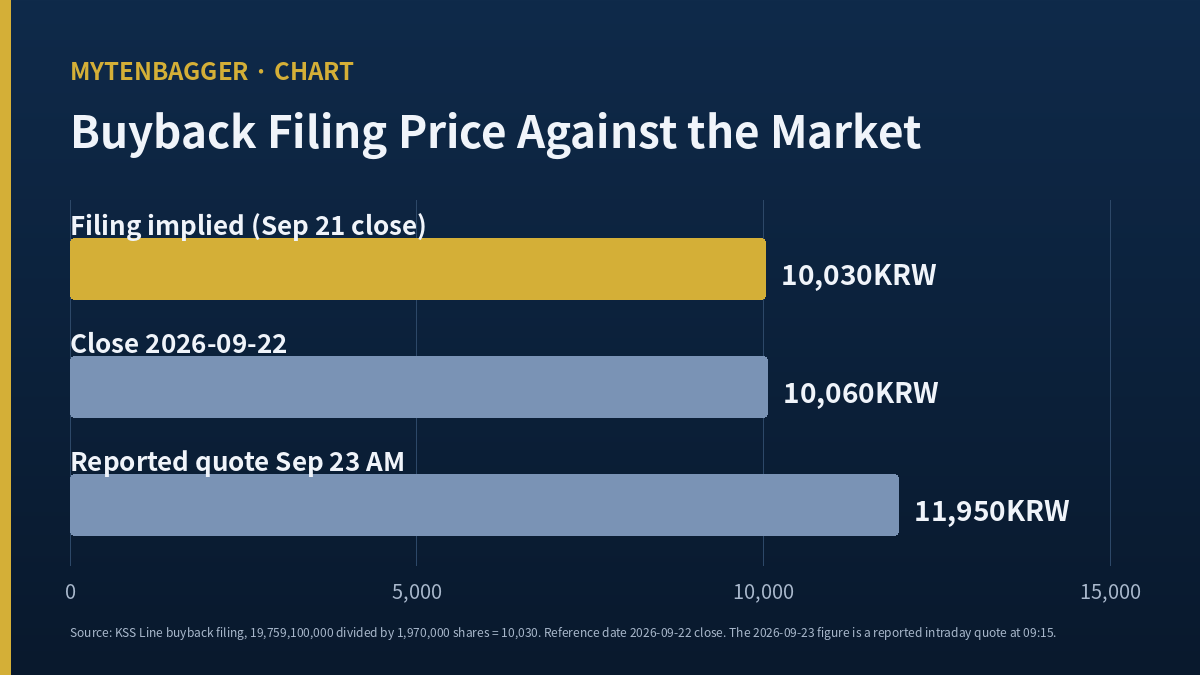
When a Korean company files a treasury share purchase resolution, I go straight to two boxes and divide one by the other. The form asks for a total amount and a number of shares. It never asks for a price per share. So the price is always sitting there unwritten, and on September 22, 2026 the one sitting inside the KSS Line filing came out at 10,030 won, about USD 7.38, which is exactly where this stock closed on September 21.
That single division is what this piece is about. KSS Line stock closed at 10,060 won (about USD 7.41) on September 22, 2026, giving the company a market value of 227,098,775,860 won, roughly USD 167.21 million, on 22,574,431 shares. The buyback the company announced after that session, 19,759,100,000 won or about USD 14.55 million, equals 8.7007 percent of that value. I hold none of this stock, I have no order in, and my reason for staying out has nothing to do with valuation multiples. It has to do with the date hiding inside the amount.
Contents
Why I divide two boxes before I look at KSS Line stock
I learned to do this on Korean disclosure forms specifically. The main filing type here, the material fact report for a treasury share purchase resolution, has a field for the planned amount and a field for the planned share count, plus fields for method, window and purpose. There is no field for the price the board used to reconcile the first two. Yet the board must have used one, because otherwise the amount could be any number at all.
So the price exists, and it is recoverable by division, and once recovered it can be looked up in the price series. That lookup is the interesting part. A buyback amount is usually read as a sign of commitment, where bigger means stronger. I read it as a sign of timing, because the amount inherits whatever the share price happened to be on the day somebody did the multiplication. Two companies announcing identical amounts can be making very different promises if one of them priced off a low and the other off a high.
For readers outside Korea: KOSPI is the senior board of the Korea Exchange, and KOSDAQ is the growth board. KSS Line trades on KOSPI under 044450. It has operated liquefied gas and petrochemical carriers since 1969 and is small by index standards, ranked in the four hundreds by market value among roughly nine hundred KOSPI names.
KSS Line stock closed at a price I had to confirm five ways
Every number in this piece hangs off one closing price, and that one took longer than usual to fix. The market data table I normally use carries a September 22 row with a close of 11,420 won, flagged as final and not provisional, with a high of 12,270, a low of 9,930 and volume of 576,082 shares. On its face that is a session with a 23 percent intraday range.
The row carried a final flag and was still wrong
Five checks pointed somewhere else. First, a Korean market data site labels the September 22 regular session close as 10,060 won, up 30 won or 0.30 percent. Second, the market value box on the same page reads 227.1 billion won, and 22,574,431 shares times 10,060 won gives 227,098,775,860 won, which rounds to the same figure. Those two check each other. Third, a Korean wire reported an 11,950 won quote at 09:15 on September 23 as a gain of 1,890 won over the prior close, and 11,950 less 1,890 is 10,060. Fourth, another outlet reported 11,670 won at 09:29 that morning as a 16 percent gain, and 11,670 divided by 1.16 is 10,060.3. Fifth, the 10,030 won recovered from the filing lands neatly on the session before.
I took 10,060 won. The lesson I am writing down is about the flag. For four pieces running I have used a working rule that says when sources part ways, take the row carrying the settlement flag. Here that rule hands back the wrong answer. The replacement rule is narrower: a settlement flag qualifies a candidate, it does not select one, and selection goes to whichever value closes an arithmetic loop. Multiplying shares outstanding by the candidate close and matching it against a published market value box is the cheapest loop available, and it is the one that settled this.
One more field went sideways in the same session. The screen reports 22,578,000 freely traded shares against 22,574,431 shares outstanding, which cannot both be true. I have seen this inversion once before on another name. Nothing in this piece uses the free float field.
Dividing the KSS Line stock buyback returns a date, not a price
The filing was received at 16:53 on September 22, 2026, after the close. It states a planned purchase of 1,970,000 common shares for 19,759,100,000 won, by on market purchase on the Korea Exchange, between September 23 and December 22, 2026, for the stated purpose of stabilizing the share price and protecting shareholder value. The company added that the decision reflects confidence in its own medium and long term corporate value.
Divide. 19,759,100,000 over 1,970,000 comes to 10,030.0 with nothing left over. Clean division to the won, which is itself evidence that the amount was built by multiplication and not chosen as a round budget.
There are two ways to express what fraction of the company this represents, and the two land slightly apart in a way that confirms the story. By money, 19,759,100,000 over 227,098,775,860 is 8.7007 percent. By share count, 1,970,000 over 22,574,431 is 8.7267 percent, which Korean coverage generally rendered as 8.73 percent. The gap of 0.0260 percentage points exists because the top of the money fraction was built on the September 21 close and the bottom of it on the September 22 close. The two figures are one session apart, and that session is the whole point.
What KSS Line stock did to that assumption the next morning
The stock opened sharply higher on September 23. Taking the 11,950 won quote reported at 09:15 at face value, that is 1.1914 times the 10,030 won the filing assumed. This is an intraday snapshot and not a close, so I will not build a percentage move on it. I will build exactly one calculation.
19,759,100,000 won divided by 11,950 won buys 1,653,481 shares. Against the 1,970,000 shares written into the filing, that is 316,519 shares short, a shortfall of 16.0669 percent, and it drops the resulting holding from 8.7267 percent of the company to 7.3246 percent. The window runs three months and there is no reason for the price to sit still inside it, so this is a conditional statement and no forecast at all. If the price held at that level for the whole window, the company would either fall short of the share count it printed or file an amendment raising the amount. Which of those two it chooses is, to my eye, the cheapest available read on how serious the commitment is.
I have written about a Korean shipping name whose own transaction price became the reference line before. In my earlier piece on HMM trading below its own buyback price the price the company had already paid worked as a floor. Here the direction is inverted, because the price the company has merely promised to pay can become a ceiling within a single session.
There is a precedent in how this company handles its own shares. Korean coverage records that on August 10, 2026 it canceled its entire treasury holding of 508,355 shares. Buying and retiring is a different act from buying and holding, and it has done the former once. I could not close one loose end here: some rendering of the September filing shows the same 508,355 figure in the pre purchase treasury holding field, which would contradict a full cancellation. I did not open the interim report notes, and I am leaving the contradiction on the page instead of resolving it by assumption.
Interest takes most of what the fleet earns
| Year | Operating margin (%) | Interest as share of operating profit (%) | Interest cover (x) |
|---|---|---|---|
| 2022 | 15.6073 | 59.1820 | 1.6897 |
| 2023 | 18.6967 | 89.6968 | 1.1149 |
| 2024 | 20.0958 | 79.2836 | 1.2613 |
| 2025 | 19.6532 | 68.5322 | 1.4592 |
| 2026 first half | 17.8901 | 69.2926 | 1.4432 |
This is a company that converts revenue into operating profit well and then hands most of that profit to lenders. In 2025 it earned 110.33 billion won of operating profit, about USD 81.23 million, on 561.40 billion won of revenue. Interest expense that year was 75.61 billion won, about USD 55.67 million. Cover of 1.4592 times has never reached two times in the four years I pulled, and in 2023 it sank to 1.1149 times, which left 17.04 billion won of net profit at the bottom of a year with an 18.6967 percent operating margin.
Set the buyback against that. 19,759,100,000 won is 26.1319 percent of one year of interest expense, 54.0442 percent of 2025 net profit, and 1.9451 times the 10.16 billion won that the 450 won final dividend costs across the share count. The company has committed to spending nearly twice its annual dividend outlay in the open market inside three months. Whether that is comfortable depends entirely on the interest line above it.
Operating cash flow gives the other side of that ledger and it has been rising. It ran 112.62 billion won in 2022, 106.90 billion in 2023, 119.29 billion in 2024 and 154.68 billion in 2025, the last of those about USD 113.89 million. Set against that 2025 figure, the buyback amount is 12.77 percent of one year of cash generated by operations. That is a far more comfortable frame than the interest comparison, and both frames are true at once, which is the honest reading of this balance sheet.
For a different angle on how a Korean shipping balance sheet splits its earnings between lenders and owners, I looked at Korea Line Earnings: Smallest Quarter, Best Operating Margin earlier this year. The two companies carry very different fleets and the comparison there is structural instead of numerical.
KSS Line stock rests on debt that has not shrunk in won terms
The debt to equity ratio improved from 308.38 percent at the end of 2022 to 229.98 percent at the end of June 2026, a fall of 78.40 percentage points. That reads like deleveraging until the components are opened. Total assets went from 1,659.17 billion won to 2,173.82 billion won over the same span. Total liabilities went from 1,252.89 billion won to 1,515.05 billion won. Equity went from 406.28 billion won to 658.77 billion won.
Liabilities rose by 262.16 billion won. The ratio fell because equity rose faster, and it did not fall because borrowings were repaid. That is why interest expense has stayed in a band between 41.14 and 82.52 billion won across the four years while the ratio came down. A reader who sees 308 going to 230 and infers a lighter balance sheet will be surprised by the interest line.
One further caution on reading a single ratio as a story. I made the same point from the opposite direction in Hyundai Glovis at 8x Earnings After Its Robot Rally Faded, where one narrative carried a Korean logistics name for months and then left the valuation behind when it went. A falling leverage ratio is a narrative too, and this one is being carried by the equity line.
The same pattern, where a growing fleet lifts assets and liabilities together and the ratio between them flatters the picture, showed up when I went through Pan Ocean Tanker Orders Ahead of a 2028 Delivery Wave. Ship owners add both sides of the balance sheet at once.
A first half whose profit I could not source
First half 2026 net profit was 80.52 billion won, which is 2.2023 times the whole of 2025. It is also larger than first half operating profit of 53.62 billion won, by 26.90 billion won. When profit below the operating line exceeds profit at the operating line, I treat it as a flag and stop treating it as a result.
Splitting the halves narrows the location. The March quarter produced 139.82 billion won of revenue, 21.61 billion won of operating profit and 63.51 billion won of net profit, a net margin of 45.4226 percent. The June quarter produced 159.90 billion won of revenue, 32.01 billion won of operating profit and 17.01 billion won of net profit, which is unremarkable. So the entire anomaly sits in one quarter and it arrived from outside operations.
I could not name the line. Vessel disposal gains, currency translation and derivative revaluation are all plausible for a gas carrier operator with foreign currency debt, and separating them needs the quarterly report notes, which I did not open. So this piece does not rest any argument on first half profit. The one practical consequence I will state: anyone sizing this company’s capacity to fund buybacks should not use the 80.52 billion won first half figure, because I cannot show that it repeats.
Dorian LPG gives me scale, and nothing more than scale
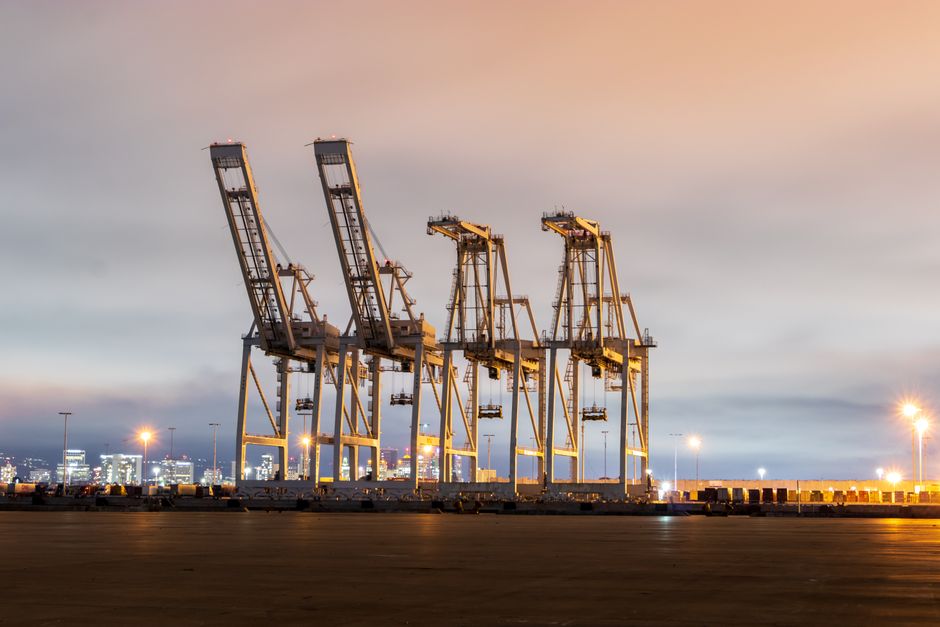
My global comparison here is Dorian LPG Ltd (NYSE: LPG), and I chose it on one criterion only: it carries the same cargo in the same class of vessel and it reports in a currency and accounting language an English reading investor can open directly. As of the September 22, 2026 close it traded at USD 53.54 with a market value of USD 2.29 billion, a price to earnings ratio of 7.10, trailing revenue of USD 578.85 million and a dividend of USD 2.95 per share for a yield of 5.51 percent. It operates 28 very large gas carriers out of Stamford, Connecticut.
What I take from that is one relationship. KSS Line’s entire market value of about USD 167.21 million is roughly 7.3 percent of Dorian’s. They are peers in cargo and they are nothing like peers in size. I am deliberately not putting their multiples side by side, because the two carry different fleet ownership structures and different charter mixes, and a price to earnings comparison across those would speak to accounting practice more than to ships. I also did not open Dorian’s own capital return filings, so I am making no claim at all about how the two companies compare on buybacks, which is the actual subject of this piece.
On the Korean side, sell side coverage is thin enough to name in one sentence. The only analyst I found publishing on this company is Ahn Do Hyun at Hana Securities. In a November 21, 2025 note he set annual operating cash flow of roughly 150 billion won against roughly 110 billion won of annual vessel acquisition cash and argued that headroom for additional shareholder returns existed. In a February 2026 note he covered an extension of long term charters on seven very large gas carriers signed on January 30, worth 826.4 billion won in total, which annualizes to roughly 201.3 billion won or 36 percent of 2025 revenue. Neither note carried a rating or a per share value. That is the coverage gap, stated plainly: one name, no target, no consensus to argue with.
The November note is worth one more sentence because of what followed it. Its argument was that until the ammonia trade opens up, this share price turns on whether shareholder returns expand. Ten months later the company announced a buyback worth almost twice its dividend. That does not make the argument correct. It does mean the people watching this company have been watching the same line for a while.
Where I stand on KSS Line stock, and the sentences with expiry dates
No position, no order, watching. I am staying out because the only thing I established here is the arithmetic structure of one filing, and a filing being internally consistent tells me nothing about whether the shares are cheap. Five things argue against me.
- The assumed price is not a cap. Nothing stops the company buying above 10,030 won. The actual cost is whatever the market charges, and an amended filing can raise the amount while preserving the share count. My conditional holds only if the amount stays fixed.
- Leverage has not fallen in absolute terms. Liabilities grew 262.16 billion won across the period in which the ratio fell 78.40 percentage points, and interest expense in 2025 was still 75.61 billion won.
- Interest cover has never reached two times. 1.6897, 1.1149, 1.2613 and 1.4592 across four years. One weak operating year puts this below one.
- The strongest recent earnings number is unexplained. A 45.4226 percent quarterly net margin came from below the operating line and I could not source it.
- Earnings multiples come out three different ways. My data table gives 7.21 times, a Korean market site gives 3.82 times, and computing it myself from the last four quarters of net profit gives 2.04 times. Price to book is 0.4172 times on 2025 year end equity and 0.3447 times on June 2026 equity. None of these appear in my argument.
Now the part I find more useful than a rating. I am splitting my own sentences into the ones that will still be true in six months and the ones that will have expired, so that this piece can be graded later instead of merely reread.
Still true in six months. 19,759,100,000 divided by 1,970,000 is 10,030. That figure is the September 21, 2026 close. The Korean filing form has no price per share field. Interest consumed 68.5322 percent of 2025 operating profit. Interest cover did not reach two times in any year from 2022 through 2025. These rest on arithmetic and filed documents, and time does not touch them.
Expired by then. Only one analyst publishes on this company. The stated amount buys 1,653,481 shares. The source of first half profit is unknown. The treasury cancellation balance is unresolved. Every one of these falls to a single document, and I already know the dates of the documents: December 22 for the repurchase result report, and November 16 for the third quarter filing.
A filing prints an amount and a share count. It does not print a price. And in the place where the price was not printed, there was a day.
KSS Line stock values I checked and left out
The dividend record went unused. Declared amounts per share ran 230, 270, 300, 350, 350, 350, 400 and 450 won across 2018 through 2025, summing to 2,700 won, with no cut in eight years and three flat years in the middle. Placing that beside the buyback produces a persuasive sentence about a company that keeps paying, but a dividend recurs annually while a buyback amount is written once, and the two do not belong in the same sum.
Fleet count is also out. The Hana note put the fleet at 32 vessels as of the end of the third quarter of 2025 with 88 percent of 2024 revenue from gas carriers, but vessel counts move with deliveries and redeliveries and I could not confirm a September 2026 figure. A current ratio of 22 percent flagged on one Korean data screen is likewise omitted, since I could not rebuild it from current assets and current liabilities.
Finally, the data discrepancy stays on the record. My price table carries a September 22 row with a close of 11,420 won, a high of 12,270, a low of 9,930 and volume of 576,082, marked settled. The regular session close was 10,060 won. I do not know the cause, and every calculation in this piece was therefore anchored to a market value cross check and three press quotes instead of to that table.
Basis: close of 10,060 won on 2026-09-22, 22,574,431 shares outstanding, market value 227,098,775,860 won by my own multiplication. Annual and quarterly financials come from filed Korean regulatory statements. The treasury purchase resolution was received at 16:53 on 2026-09-22. September 23 figures are press quotes taken during trading and are not closing prices. Dollar conversions use USD/KRW 1,358.2, the Seoul market close on 2026-09-22, as reported by Korean financial press.