Korean Streamer SOOP Q2 Results: First Cash-Negative Quarter
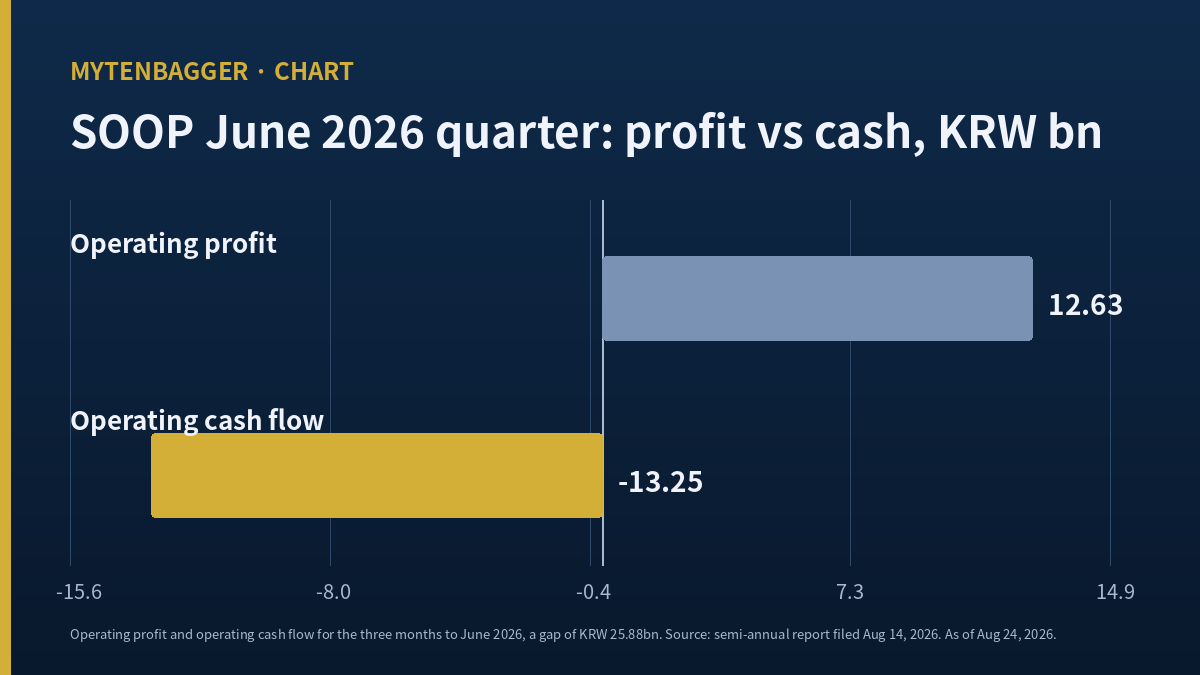
SOOP stock closed at KRW 37,650 on Friday, August 21, 2026. What pulled me into the filings was not the price. It was a single line in the June 2026 quarter: the company booked an operating profit of KRW 12.63 billion and, over the same three months, collected KRW 13.25 billion less cash from operations than it spent. I went back four and a half years to see whether that combination had happened before at this company. It had not.
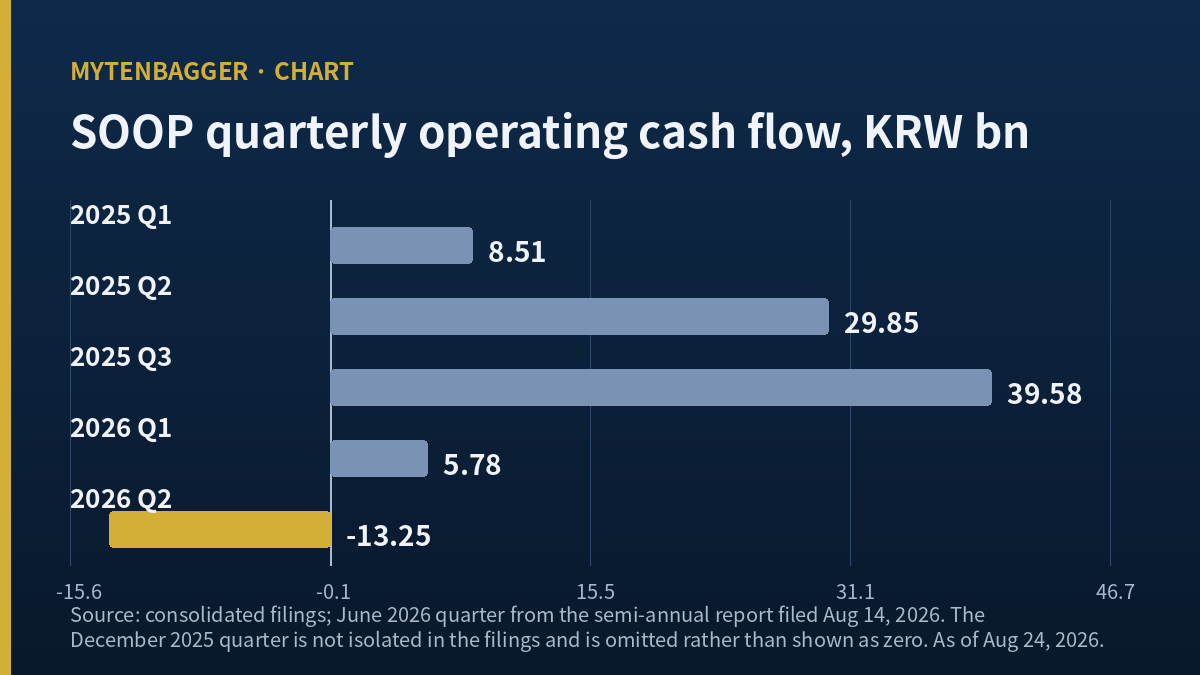
2022 Q1 through 2026 Q1: seventeen quarters with a reported operating cash flow figure. Every one of them positive.
2026 Q2, operating profit: plus KRW 12.63 billion. Margin 12.16%.
2026 Q2, operating cash flow: minus KRW 13.25 billion.
Distance between the two lines: KRW 25.88 billion in one quarter.
Contents
SOOP stock, and a quarter that earned a profit and lost cash
A short orientation for readers outside Korea. SOOP Co., Ltd. trades under the ticker 067160 on KOSDAQ, the secondary Korean exchange that sits alongside the main KOSPI board and carries most of the country’s mid-cap technology and media listings. The company runs a live-streaming platform. Viewers send paid items to broadcasters, the platform keeps a cut, and advertising sits on top of that. Until 2024 the same business traded under the name AfreecaTV. At Friday’s close the market value was KRW 432.8 billion, roughly USD 312 million at the exchange rate noted at the end of this piece.
The number that matters here is not the market value. It is the gap between two lines that usually move together. Operating profit is what the income statement says the quarter earned. Operating cash flow is what the cash flow statement says the quarter collected. In a platform business with almost no inventory, those two figures normally track each other closely, because there is very little working capital sitting between a payment and a booking. This company reported inventory of KRW 1.08 billion against quarterly revenue of KRW 103.84 billion, which works out to under one day of sales.
So when the two lines split by KRW 25.88 billion in a single quarter, something moved that is not ordinary trading. I could not determine what from the disclosures available to me, and I want that stated before anything else in this note.
Seventeen quarters of cash, and then one without
Here is the count I ran. I pulled every quarterly filing from the March 2022 quarter through the June 2026 quarter and isolated the single-quarter operating cash flow, since Korean quarterly disclosure reports flow items cumulatively and a raw reading would double-count. That gives eighteen quarters. One of them, the December 2025 quarter, has no separately reported cash flow figure that I could isolate, so I left it out of the count and did not model a substitute. That leaves seventeen quarters with a figure I can stand behind.
| Quarter | Revenue (KRW bn) | Operating profit (KRW bn) | Operating margin | Operating cash flow (KRW bn) |
|---|---|---|---|---|
| 2025 Q1 | 107.65 | 27.94 | 25.96% | +8.51 |
| 2025 Q2 | 116.88 | 30.01 | 25.68% | +29.85 |
| 2025 Q3 | 125.86 | 36.26 | 28.81% | +39.58 |
| 2025 Q4 | 116.17 | 30.63 | 26.36% | not isolated |
| 2026 Q1 | 106.02 | 21.22 | 20.02% | +5.78 |
| 2026 Q2 | 103.84 | 12.63 | 12.16% | −13.25 |
Single-quarter figures derived from consolidated regulatory filings; the June 2026 quarter comes from the semi-annual report filed Friday, August 14, 2026. Margins are my own division of the two columns.
The earlier years, which I have left out of the table for length, run the same way. The smallest positive single-quarter operating cash flow I found in the full set was KRW 5.78 billion in the March 2026 quarter, and the largest was KRW 59.28 billion in the December 2024 quarter. Nothing in the set goes below zero until the June 2026 quarter.
The half-year view says the same thing at a slower speed and is worth putting beside it. First-half 2026 operating cash flow was minus KRW 7.47 billion against plus KRW 38.36 billion a year earlier. Capital spending of KRW 9.12 billion in the same six months drove free cash flow to minus KRW 16.59 billion. The first quarter of the year was mildly positive, so the entire swing sits in the second.
Where the operating margin went
The margin fell in the same quarter, which complicates the reading and I would rather name that than skip it. Operating margin came down from 25.68% in the June 2025 quarter to 12.16% in the June 2026 quarter. Management gave four reasons at the July 31, 2026 results briefing: a one-time cost tied to a tax audit, higher fees paid for broadcast rights along with higher support payments to broadcasters, a slower advertising market with seasonal effects, and spending described as strategic investment for the second half.
Two of those four are cash costs in the quarter they land. The tax-audit item in particular is the sort of settlement that leaves the income statement and the cash flow statement at the same moment, which would push both lines down together. That makes it a poor candidate for explaining a KRW 25.88 billion gap between the two. Korean trade press reporting put streaming fees up 24.4% and broadcaster support payments up 29.6% in the quarter, and management said the tax-related charge was fully absorbed in the second quarter with no carry into the third. The company declined to disclose the assessed amount, saying it fell below the threshold that would require a filing, and I have not been able to confirm it independently.
What I can say is narrow and I will keep it narrow. The profit line and the cash line moved apart by an amount larger than the quarter’s entire operating profit, in a business whose balance sheet holds almost no inventory. I do not know which working-capital or non-operating item carried it.
SOOP stock placed next to six listed peers
Negative operating cash flow is not exotic in this industry. What I wanted to know was whether it usually arrives with a profitable quarter attached. So I sorted six listed peers by the sign of their operating cash flow and then looked at what their operating margin was doing at the same time.
The peers whose cash line went below zero
HUYA Inc. (NYSE: HUYA) reported operating cash outflow of RMB 176.2 million for its 2025 financial year. In that same year it ran an operating loss of RMB 162.5 million on revenue of RMB 6,502.4 million, a margin of minus 2.5%. DouYu International (NASDAQ: DOYU) reported operating cash outflow of RMB 52.3 million for 2025 and RMB 238.9 million for 2024; its 2025 operating profit of RMB 4.8 million on revenue of RMB 3,818.9 million works out to 0.1%. RUM Group (NASDAQ: RUM) reported operating cash outflow of USD 70.4 million in 2025 and USD 66.1 million in the first half of 2026, against an operating loss that was larger than its revenue.
All three burned cash. All three were at or below break-even on operating margin while doing so.
The peers whose cash line stayed above zero
Bilibili (NASDAQ: BILI) generated RMB 7.15 billion of operating cash in 2025 with an operating margin of 3.7%. Kuaishou Technology (HKEX: 1024) generated RMB 3,125 million in the March 2026 quarter, with a June 2026 quarter operating margin of 10.7%. JOYY Inc. (NASDAQ: YY) generated USD 46.0 million in the March 2026 quarter. CyberAgent (TSE: 4751), whose financial year ends in September, generated JPY 79,518 million in its 2025 financial year.
That is the arrangement I keep coming back to. Among these seven companies, the ones that ran cash out the door were the ones that were not making an operating profit, and the ones making an operating profit kept collecting cash. This company sits in neither group. It reported a 12.16% operating margin and still ran the cash line below zero in the same three months.
Two honest limits on that comparison, and they are large. First, the peer figures I could confirm are mostly annual, while mine is a single quarter, and a quarter can carry a timing effect that a full year smooths away. Second, CyberAgent closes its books in September while the other six close in December, so its financial year is not the same twelve months as anyone else’s on this list. I would not present this table as a ranking, and I have not written one.
SOOP stock across 244 trading days
Over the 244 trading days from August 21, 2025 to Friday, August 21, 2026, the shares fell 52.22%. KOSDAQ rose 3.18% over the same window. The interactive media and services group the stock belongs to, measured as an equal-weighted group of the sixteen names that traded the whole window with this one excluded, fell 37.73%.
How much of the fall was the sector
Splitting the shortfall against the market gives a sector effect of 40.91 percentage points and a company-specific effect of 14.49 percentage points, which sum to the 55.40 point gap against the index. That puts 73.8% of the underperformance on the sector, with the remaining 26.2% on the company. Within the group the stock ranks eleventh of sixteen, against a group median decline of 46.77%. Five names in that group fell less than this one did.
The last twenty sessions point the other way
Over the most recent twenty trading days the sector rose 7.80% and the index rose 1.48% while this stock fell 21.15%, a divergence of 28.95 percentage points. The tool I use flagged that window as company-specific and marked it for investigation. Both statements are true at once: across a year the sector carried most of the decline, and across the twenty sessions that followed the June quarter results this company fell on its own.
Beta is where I want to put my own error on record. This stock carries a beta of 0.414 against the index with a correlation of 0.532, and I have treated a low beta on a Korean mid-cap as a rough proxy for downside protection. This window is a clean demonstration that it is nothing of the sort. A beta below 0.5 says the stock does not move with the index. It says nothing about which direction it goes when it moves without it, and over the last twenty sessions it went down while everything around it went up. I had those two ideas quietly merged, and I only noticed because the two windows in this note disagreed with each other.

What I left out of this SOOP stock note
Forward estimates from the sell side
Seven pieces of named sell-side work exist between late 2025 and August 2026, from six houses. Their published 2026 operating profit estimates cluster between KRW 102 billion and KRW 112 billion. Every one of those numbers was set before the June 2026 quarter was reported. With first-half operating profit at KRW 33.85 billion, the lowest of them would require KRW 68.15 billion in the second half, more than double the first. I did not find a single updated annual estimate published after the results, so I have not used any of them as a forward anchor. The one named note published after the quarter carried a neutral rating and did not disclose revised annual figures in the coverage I could read.
Three disclosures I could not open
A treasury share disposal decision from Friday, February 20, 2026, a stock option grant from Friday, March 27, 2026, and a corporate value enhancement plan filed the same day. I could not retrieve the text of any of them. The last one could contain a treasury share cancellation policy, so I am not claiming in this note that no cancellation is planned. Treasury holdings stood at 824,925 shares as of Friday, August 21, 2026.
I also left out the checklist score my screening tool assigns this company, which is a clean pass on all seven of its criteria. Every input to that score comes from the 2025 financial year paired with today’s price, and the whole subject of this note is a quarter that arrived after those inputs were fixed.
Where I stand on SOOP stock, and what would end this note
At KRW 432.8 billion this sits outside the top hundred Korean listings by market value, which in my own rules makes it something I watch.
My position is this. A quarter that reports a 12.16% operating margin and still runs cash out the door is telling me something the income statement alone will not, and I do not yet know what it is. Until I can name the item that carried KRW 25.88 billion, the profitable-quarter description and the cash-negative description are both accurate and I cannot reconcile them. I wait, and I do not guess.
The condition that ends this note is not a company event. It is a correction to the way I measured this. If I obtain quarterly operating cash flow for the six peers, replacing the annual figures I had to use here, the comparison I built here gets re-measured on matched periods, and the arrangement I described may not survive it. Three of those six do not publish a cash flow statement with their quarterly releases, which is why I could not do it this time. Anyone who can pull quarterly cash flow for HUYA, Bilibili and Kuaishou has a sharper version of this note than the one I have written, and it may reach the opposite conclusion.
Twelve ways this reading could be wrong
- The most uncomfortable one first. I am comparing one quarter of mine against annual figures for the peers, because that is what those companies publish. A single quarter can hold a payment timing effect that a full year absorbs without trace. If the peer quarters were visible, some of them would very likely show negative cash quarters inside positive cash years, and my arrangement would lose its edge immediately.
- One quarter is not a trend. The March 2026 quarter was positive, and the pattern I am describing has exactly one data point on the negative side.
- The tax settlement management described is the obvious candidate for a large cash payment in the quarter, even though it should pull both lines down together. If the accrual and the payment landed in different periods, the split has a mundane explanation and my note is over-thought.
- Management stated the item is fully absorbed and does not carry into the third quarter. If that holds, both the margin and the cash line recover mechanically and nothing structural was ever wrong.
- Capital spending of KRW 9.12 billion in the half is not large for a company of this size, and the free cash flow deficit sits almost entirely in the operating line and only marginally in the investment line. That argues against a capital cycle explanation but it also means I have less to point at.
- The sector carried 73.8% of the twelve-month decline. Reading this as a company-specific failure ignores that the group median fell 46.77%.
- Four executives bought shares on the open market on Thursday, June 4, 2026, spending roughly KRW 300 million between them. The amount is small; the direction is against my caution.
- The company still leads its main domestic competitor on total watch hours, at 338.68 million hours against 281.65 million in the March 2026 quarter on third-party measurement. On monthly active users the reported ordering runs the other way.
- Advertising revenue grew 61.4% in the 2025 financial year before turning down in 2026. A single weak year in a line that was compounding that fast may turn out to be a pause.
- The balance sheet is not stressed. Interest coverage on the first-half figures comes to 11.4 times, dividing operating profit of KRW 33.85 billion by interest expense of KRW 2.98 billion, so one negative cash quarter does not put solvency in question here.
- Management committed at the July 31, 2026 briefing to disclosing core platform metrics from the third quarter onward. If that happens, the information gap this note complains about closes from the company’s side before it closes from mine.
- Three disclosures I could not read might each change the picture, and one of them is a corporate value enhancement plan whose contents I am entirely blind to.
Price and market value are the Friday, August 21, 2026 close. Financial figures come from the consolidated semi-annual report filed Friday, August 14, 2026. Peer figures are as reported by each company, in each company’s own currency.
Prices and derived figures reflect the Friday, August 21, 2026 close as checked while writing, so live quotes can differ. The Korean won is the reference currency throughout, and the single dollar figure in this note uses roughly KRW 1,386.5 per dollar on that same date, which makes it an approximation, with no claim to being a settled conversion. Peer amounts are left in the currency each company reports, with no conversion applied.
For readers who want to see how the same checks behave on a different Korean name, I worked through a case where a reported multiple divided profit the operating business had not generated in this note on NCSoft, and a case where the largest revenue line belonged to someone else’s product in this note on Chong Kun Dang. Both are about the gap between a headline figure and what sits underneath it, which is the same turn of mind this note is built on.
Primary sources used here, for anyone rebuilding the work: HUYA’s 2025 full-year release, DouYu’s June 2026 quarter release, Bilibili’s 2025 full-year release, Kuaishou’s June 2026 interim release, JOYY’s March 2026 quarter release, RUM Group’s June 2026 quarter release, and CyberAgent’s investor relations pages. Korean-language coverage of the June 2026 quarter, including the cost commentary quoted above, came from The Elec and Seoul Economic Daily, and the disclosure list from IRGO.
- Why AhnLab Shares Fell by Half After the Political Rally
- RFHIC Profit Rose 45% but Operating Cash Flow Went Negative
- Binex Exchangeable Bond Priced at Nearly Triple the Share Price
- Korean Flex Circuit Maker BH Co: Profit Barely Covers Interest