Korean Re ROE and Earnings: Six Months That Passed a Full Year
USD 256 million and USD 237 million, or KRW 347.194 billion and KRW 322.041 billion at the exchange rate I use throughout. The first is what this company earned in the six months from January to June 2026. The second is what it earned across all of 2025. Six months came in USD 19 million ahead of a full year. I wrote those two figures down before I opened Korean Re stock and checked whose numbers they were.
What I did next was not to break the profit apart any further. I picked one profitability line the data tools hand me, and I worked out what had been placed above and below it to produce the percentage. By the second paragraph of this piece I know which period that line covers, and it turns out that in this particular company the answer changes the verdict completely.

Contents
Korean Re Stock Made Me Split a Half Year From a Full Year First
Financial screens carry plenty of values with no period attached. Lines denominated in currency, such as revenue or net profit, usually say which months they cover. Lines that end in a percent sign are a different matter. A profitability ratio puts a flow above and a balance below, and nothing on the screen always tells you whether the flow above covers three months, six months or twelve.
That is exactly what happened here. For the June 30, 2026 reference date, both the data tool and the regulatory filing hand me 8.64 percent. For December 31, 2025 the same line reads 8.74 percent. Line those two up as a time series and the company appears to have slipped by a tenth of a point. The first covers half a year and the second covers a full year. Match the periods and the same company looks like a different one.
The closing price on Wednesday, September 23, 2026 was KRW 14,630, or USD 10.77. Multiply it by 176,719,070 listed shares and you get KRW 2,585,399,994,100, which closes against the KRW 2,585.4 billion market value the tool prints. Korean markets were shut on September 24 and 25 for the Chuseok holiday and September 26 was a Saturday, so September 23 is the last session before this piece. The next session is Monday, September 28.
One point of context for readers outside Korea. Korean Re trades on KOSPI, the senior board of the Korea Exchange, which lists the country’s larger and longer-established companies. KOSDAQ is the separate junior board, home to smaller and more growth-oriented names. This company sits on the senior board under the code 003690, and its market value of roughly USD 1.9 billion places it far outside Korea’s hundred largest listed companies, which is the main reason my position here is an observation and nothing stronger.
What the Company Actually Takes On
Korean Reinsurance is the only dedicated reinsurer based in South Korea. An ordinary policyholder pays premiums to a property or life insurer. Those insurers in turn pass along the slice of risk they would prefer not to hold alone, and the company that accepts it is the reinsurer. So this firm’s income does not arrive from individuals. It arrives from other insurance companies. Premiums accepted this way are called assumed premiums, and what this company passes further along is called ceded.
Because of that structure, the stock sits inside the property insurance sector classification while resisting the reading you would apply to a primary insurer. A handful of large losses and natural catastrophes in a given year move the result, and not the accident record of any one policyholder. The company’s own explanation of its first-half improvement ran along those lines. A Korean financial daily, Hankyung Financial News, reported on August 30, 2026 that the absence of large claims and strength on the investment side drove the better result.
For scale, 2025 consolidated operating revenue was KRW 6,704.4 billion, or USD 4.94 billion. That figure comes from a September 21, 2026 report in the Korean Insurance Newspaper, and it matches the revenue line in my data tool to the last digit. The match matters because the tool labels that line as a trailing four-quarter total. It is in fact the full 2025 fiscal year. I have run into the same mislabeling on other names, but this is the first time an outside publication printed the identical figure and let me settle the point.
Six Months of Korean Re Stock Earnings Passed a Full Year
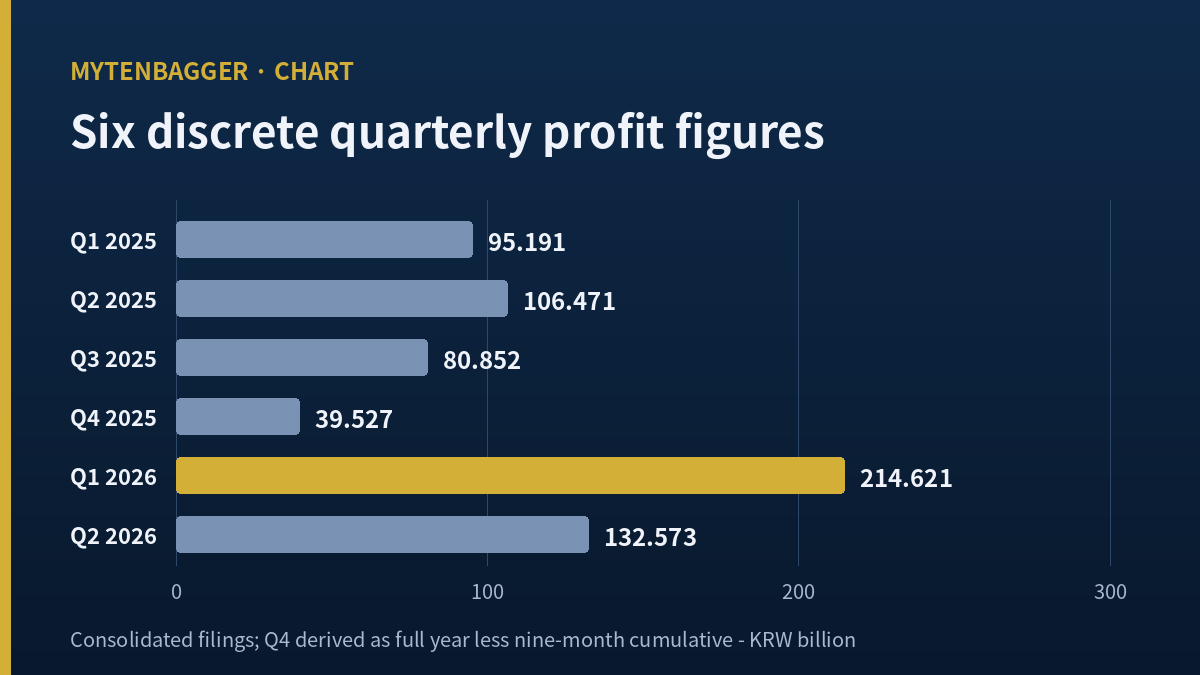
Break the filings into discrete quarters and the reason a half year could beat a full year comes into view. The four quarters of 2025 produced KRW 95.191 billion, KRW 106.471 billion, KRW 80.852 billion and KRW 39.527 billion. The last of them came to 12.2739 percent of the KRW 322.041 billion the company earned that year. The fourth quarter of 2024 was KRW 58.697 billion and the fourth quarter of 2023 was KRW 6.862 billion. Take 2024 on its own, though, and the fourth quarter was not the thinnest of that year: its first quarter of KRW 57.999 billion came in KRW 0.698 billion lower. For 2023 the discrete first, second and third quarters fall outside the range my tool holds, so I cannot rank that year’s quarters at all. What survives is a statement at the half-year level. The second half of 2025, KRW 120.379 billion, was 0.5969 times the first half of KRW 201.662 billion, while the second half of 2024, KRW 161.543 billion, was 1.0413 times the first half of KRW 155.128 billion. The two years point opposite ways.
| Quarter | Discrete net profit | Cumulative for that year |
|---|---|---|
| Q1 2025 | 95.191 | 95.191 |
| Q2 2025 | 106.471 | 201.662 |
| Q3 2025 | 80.852 | 282.514 |
| Q4 2025 | 39.527 | 322.041 |
| Q1 2026 | 214.621 | 214.621 |
| Q2 2026 | 132.573 | 347.194 |
The KRW 214.621 billion the company earned in the first quarter of 2026 alone is more than double any single quarter of 2025. Add the second quarter and the half-year total of KRW 347.194 billion comes to 1.0781 times the KRW 322.041 billion booked across 2025. Bloter reported on August 16, 2026 that first-half net profit was KRW 347.3 billion against KRW 195.5 billion a year earlier, a gain of 77.6 percent. The same report put insurance profit at KRW 161.5 billion against KRW 159.7 billion, up 1.1 percent, and investment profit at KRW 304.4 billion against KRW 93.7 billion.
The sources part company here. The half-year cumulative profit in the filing is KRW 347.194 billion and the press figure is KRW 347.3 billion, a gap of KRW 0.106 billion. The prior-year comparison parts further. The filing shows KRW 201.662 billion for the first half of 2025 while the press figure is KRW 195.5 billion, KRW 6.162 billion lower. I have not ruled either one authoritative, and every calculation in this piece runs on the filing. Where I quote the press figure I say so. When I worked out Samsung Card’s funding cost by hand and set it against market rates, printing the vendor figure and my own figure separately was the only honest handling available, and it applies again here.
One Return Line for Korean Re Stock, and the Three Figures It Yields
So I set out to identify what sits above and below that line. The quarterly financial history carries a return-on-equity value at every date. I pulled ten dates, from the first quarter of 2024 through the second quarter of 2026, and divided the cumulative profit at each date by the total equity at the same date. All ten matched to two decimal places.
The first quarter of 2024 gives KRW 57.999 billion over KRW 3,167.161 billion, or 1.8313 percent, against a printed 1.83. The first half of 2025 gives KRW 201.662 billion over KRW 3,496.418 billion, or 5.7677 percent, against a printed 5.77. The first half of 2026 gives KRW 347.194 billion over KRW 4,019.799 billion, or 8.6371 percent, against a printed 8.64. Every one of the ten dates closes the same way.
How I ruled out annualization
The first-quarter values settled it. Take the 1.83 percent from the first quarter of 2024 and multiply by four and you get 7.33 percent, while the full year for 2024 is printed at 9.17 percent. Do the same with the 2.79 percent from the first quarter of 2025 and you get 11.16 percent, well above the 8.74 percent printed for that full year. If the line were annualized, a first-quarter value would land near its own full-year value. It does not, so the line carries the cumulative flow untouched. What sits above it has accumulated for as many quarters as have closed, and what sits below it is the equity balance on that date.
I have met the same trap from the other direction. In the BHI piece I found a price struck at 10.45 times a book value that was nine months old. There the problem was the date on the balance below. Here the problem is the number of months in the flow above. Either way, reading the printed number at face value produces a different answer from the one the arithmetic supports.
That settles what the line means. It does not settle what to do with it, and the awkward part of this company is that there is more than one defensible way to match the periods. I built three and picked one.
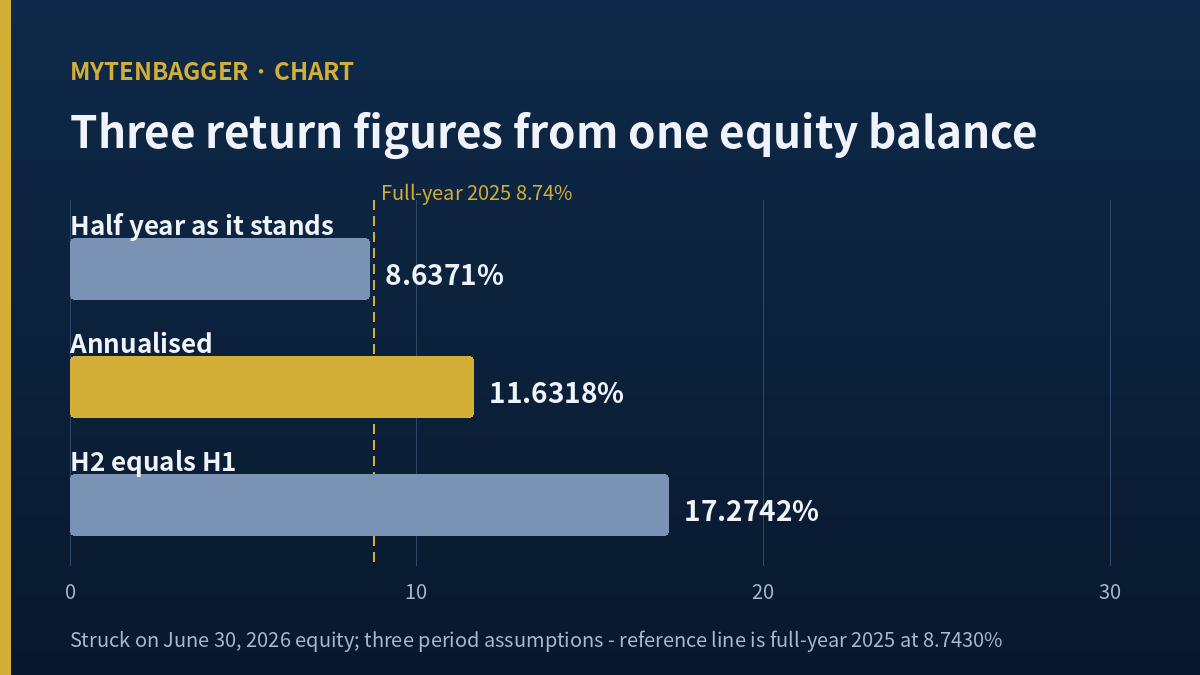
The first is to use the half-year flow as it stands. That gives 8.6371 percent, a tenth of a point below the 8.7430 percent full-year figure for 2025. Its merit is that I add no assumption at all. Its defect is that the moment I set it beside a full-year figure, a reader treats the two as covering the same span.
The second is to double the half-year flow. Twice KRW 347.194 billion is KRW 694.388 billion, which over the same equity gives 17.2742 percent, or 8.5312 points above the full-year figure. This assumes the second half matches the first. Measured against 2025, where the second half was 0.5969 times the first, the figure leans high; measured against 2024, where it was 1.0413 times, the figure is if anything low. The two years point opposite ways, so I did not use this route.
The third is to assume the second half of 2026 earns what the second half of 2025 earned. Subtract the KRW 201.662 billion half-year cumulative from the KRW 322.041 billion full year and the second half of 2025 was KRW 120.379 billion. Add that to the KRW 347.194 billion already booked and you get KRW 467.573 billion, which over equity gives 11.6318 percent. That is the figure I use.
The figure I picked, and what would break it
I chose the third route because it uses an actually observed second half without transplanting a strong first half onto the back half of the year. It carries an obvious weakness in exchange. Of the two years I can observe, I picked the one whose second half was thinner. Substitute the KRW 161.543 billion second half of 2024 instead and the full year becomes KRW 508.737 billion and the return figure becomes 12.6558 percent. The discrete fourth quarters spread widely too: KRW 6.862 billion in 2023, KRW 58.697 billion in 2024 and KRW 39.527 billion in 2025, with the last of those 32.6 percent below the one before it. When observations spread that widely, picking one of them to substitute in produces a single point inside a wide band, and no more.
I have written about one price producing two multiples before. In the Kakao Pay piece the split came from what counts as equity while liabilities tripled. There the definition of the balance below did the splitting. Here it is the count of months in the flow above.
Korean Re Stock’s Book Value Per Share Stopped on December 31, 2025
Having caught one period problem, I grew suspicious of the neighboring lines. The data tool prints book value per share of KRW 20,843. Chickstock, an independent Korean market screen, prints the same KRW 20,843. Yet total equity of KRW 4,019.799 billion at June 30, 2026 divided by 176,719,070 listed shares comes to KRW 22,746.83. The two do not meet.
Walking back through the equity series answers it. Total equity of KRW 3,683.421 billion at December 31, 2025 divided by the same share count gives KRW 20,843.37. What sits above the KRW 20,843 both screens print is equity from nine months ago. I have twice found a vendor book value whose share count was distorted by buybacks. This time the distortion is on the top of the fraction, not the bottom.
| Measure | December 31, 2025 | June 30, 2026 |
|---|---|---|
| Total equity (KRW billion) | 3,683.421 | 4,019.799 |
| Book value per share (KRW) | 20,843.37 | 22,746.83 |
| Price to that book value | 0.7019 | 0.6432 |
| Half-year profit on that equity (%) | 5.4750 | 8.6371 |
Why I print both reference dates
Equity grew by KRW 336.378 billion over six months, or 9.1322 percent. A multiple built on nine-month-old equity is therefore not the multiple in force now. Struck on June equity it reads 0.6432 instead of 0.7019, a gap of 0.0587 times, which means the same price reads cheaper. I print both and attach the reference date every time. Print only one and the piece ends up treating nine-month-old equity as though it were current.
While equity rose, the leverage measure moved the other way. Total assets over total equity ran 3.7094 times in 2023, 3.8114 in 2024 and 3.8713 in 2025, then fell to 3.6639 at the end of June 2026. The debt ratio of 266.39 percent that the tool prints agrees with that last date. So within a single screen, one line is struck on June 30 and another on the prior December 31. The Hyundai Marine piece ran on two lines that US filings do not carry, and the lesson generalizes. When a screen cannot be trusted as a whole, the only available method is to check each line’s date one at a time.
Two Sources Printed Different Closes for Korean Re Stock on September 23
The price itself also came in two versions. The data tool puts the September 23 close at KRW 14,630 and shows a KRW 100 decline from KRW 14,730 the previous session. Its confirmed daily series carries the same KRW 14,630 and shows a single market scope across the window. Chickstock, on the same date, prints a close of KRW 14,670 and a decline of KRW 50.
I settled the question with a multiple. Chickstock prints earnings per share of KRW 1,970 and a price-to-earnings figure of 7.43 times on the same page. Divide 14,630 by 1,970 and you get 7.4264, which rounds to the 7.43 printed. Divide 14,670 by 1,970 and you get 7.4467, which should have appeared as 7.45. The multiple on that page was therefore struck on KRW 14,630 and not on the closing price the same page displays. The arithmetic of the prior close also closes: KRW 14,730 less KRW 100 is KRW 14,630. That is the price this piece uses.
Two lines inside a single page disagreeing about the close is a form I had not met before. I have seen two screens copy each other’s values until each was internally wrong, and I have seen one vendor’s two pages print different net profit for the same company. This one sits inside a single page.
There is a second point worth making about that Chickstock earnings figure of KRW 1,970. Divide KRW 347.194 billion by 1,970 and you get 176,240,609 shares, which is 478,461 fewer than the 176,719,070 listed shares I verified. So above the line sits half a year of profit and below it sits a share count I could not identify. Their 7.43 times is a multiple built on six months of earnings. Built on my full-year estimate of KRW 467.573 billion, it works out to KRW 2,645.85 per share and 5.5294 times.

An Unopened Line, a Falling Share, and a Verified Peer
One thing in this piece I never managed to open. The revenue and operating profit lines are empty in the company’s filing history. Net profit, assets, equity and liabilities are all there, but the top of the income statement is not. I hit the same absence in a bank holding company earlier, and it has now repeated in an insurer. So this piece has no route to verify premium income against the primary filing. The KRW 6,704.4 billion from the data tool, matched by the Korean Insurance Newspaper figure, stands in for that line.
The operating measures had to come from outside. According to that September 21, 2026 report, this company’s share of domestic assumed premiums ran 68.9 percent in 2022, 59.9 percent in 2023 and 56.5 percent in 2024, three consecutive years of decline. The 2022 and 2024 figures are 12.4 points apart, and the later divided by the earlier is 0.82. The same report put the overseas portion of 2025 insurance revenue at 44 percent and 2025 operating revenue down 3.6 percent year on year. Bloter reported on April 16, 2025 that Korean property insurers ceded KRW 3,104.1 billion abroad in 2022, KRW 3,135.2 billion in 2023 and KRW 3,370.5 billion in 2024.
What I decided against estimating
With a share and an amount in hand, one could work backward to the size of the domestic reinsurance market. I did not. The report does not define the market boundary the share is measured against, and it does not say whether assumed premiums here include retrocession. Dividing two figures whose scope I have not confirmed produces the size of my own assumption and nothing else. I carried the share figures across exactly as printed.
For the global standing I used only the three values that same report set out on one line: 2025 reinsurance revenue of USD 35.418 billion for Munich Re, USD 34.564 billion for Swiss Re and USD 3.448 billion for Korean Re, ranking this company eighth worldwide. The only thing I built was the ratio between them. Munich Re is 10.2720 times Korean Re and Swiss Re is 10.0244 times. The report does not state the accounting basis behind the ranking, so I went no further with it, and I did not set revenue, profit or multiples for those companies beside this one.
For a peer figure I verified myself, I turned to RenaissanceRe Holdings, listed on the New York Stock Exchange under RNR, a pure-play reinsurer reporting on a January to December year. Its shareholders’ equity was USD 19,211 million at the end of 2025 against USD 17,552 million at the end of 2024, an increase of 9.4519 percent over a full year, on a page last updated June 30, 2026. Korean Re’s equity rose 9.1322 percent over half a year. I put those two side by side deliberately, because they are the exact pairing this piece argues against: one covers twelve months and the other covers six, the currencies differ, and the accounting regimes differ. The comparison is here to be refused, and I made no ratio out of it.
Where I Stand on Korean Re Stock, and Three Checks for November 15, 2026
The sell-side material is old. Analyst Taejoon Jeong of Mirae Asset Securities published a buy view with a KRW 10,000 valuation on March 24, 2025. Analyst Doha Kim of Hanwha Investment and Securities lifted a valuation from KRW 8,000 to KRW 9,200, a rise of 15 percent, on May 19, 2025 while keeping a hold view, citing the value of coinsurance and the prospect of a core capital ratio requirement. Both sit below the current KRW 14,630 close, and the first is eighteen months old while the second is sixteen. I found no current numeric estimate for this company. I record that as a coverage gap.
I left the Mirae Asset estimate table out of the body. The 2026 net profit of KRW 311 billion and earnings per share of KRW 874 shown there do not close against each other: KRW 311 billion over the listed share count comes to KRW 1,759. Since I could not establish which figure covers what, I carried across only the valuation, the publication date and the analyst’s name.
Five objections, ordered by how long each takes to surface
First, within days. When the market reopens on September 28, one of the two closing prices printed for September 23 will prove to be the one that carries forward. If mine is the wrong one, every multiple in this piece is off by 0.27 percent.
Second, in about seven weeks. The statutory deadline for the third-quarter 2026 filing is November 15. Once nine-month cumulative profit is published, my substituted second half of KRW 120.379 billion will be tested against the actual band. If it misses, 11.6318 percent is the first thing here to fall.
Third, over roughly a year. Bloter put first-half investment profit at KRW 304.4 billion against KRW 93.7 billion a year earlier. If rates and valuations retrace, the slope of earnings changes, and then no method of stretching six months into twelve will hold.
Fourth, over several years. If the domestic share keeps sliding from 68.9 toward and below 56.5 percent, the company ends up with a shrinking core business while the multiple merely looks cheap. I treat that line as the slowest-moving indicator on the page.
Fifth, a regulatory matter. If the core capital ratio requirement that Doha Kim flagged arrives, the scope of what counts as capital changes. Every calculation here places equity below the line, so a change to the definition of equity moves book value per share and the return figure together.
Figures I gathered and left out
The dividend plays no part in the argument. A dividend per share of KRW 570 against a KRW 14,630 close gives a yield of 3.8961 percent, and the tool’s payout figure is 34.5 percent. Those live here only. The alternative payout value of 75.5 percent the same tool supplies does not reproduce, so I dropped it. I also dropped the 8.85 times price-to-earnings figure. The KRW 1,653.11 per share implied by it, multiplied by the listed share count, comes to KRW 292.136 billion, which matches no reporting period this company has. A multiple whose upper term I cannot identify does not go in.
The exchange rate belongs here too. The Seoul foreign exchange market closed daytime trading on September 23, 2026 at KRW 1,358.4 per US dollar, reported the same day by Money Today as a rise of KRW 0.2. At that rate the close is USD 10.77, market value is USD 1.903 billion, first-half profit is USD 256 million, and June-end equity is USD 2.959 billion. Operating revenue for 2025 is USD 4.936 billion. I also hold the June-end investment assets of KRW 12,106.4 billion, a combined ratio of 87.9 percent and a contractual service margin of KRW 978.0 billion, none of which entered this argument.
Where readers who pick another figure part from me
This is a piece that chose 11.6318 percent out of three candidates, so it parts from anyone who chose differently, and at identifiable points. A reader using 8.6371 percent holds the same verdict as I do until November 15. That reader sees a company no different from last year, while I see only a different method of stretching six months into twelve, and until the nine-month cumulative arrives there is no evidence that separates the two conclusions. A reader using 17.2742 percent parts from me over which year to treat as the sample. That figure requires the second half of 2026 to earn what the first half earned. The second half of 2024 was 1.0413 times its first half, which comes close to that requirement, while the second half of 2025 was 0.5969 times, which does not. I picked the later year and that reader has in effect picked the earlier one. With only two years observed, I do not know which is ordinary.
What I can state about this company with confidence is one thing. If you set the printed 8.64 and 8.74 percent side by side and conclude the business is standing still, that conclusion was produced by a missing period label and not by arithmetic. Three methods exist for supplying the label, they give three answers, and so I am not buying this time and I am waiting for November 15.
Sources. Price, listed shares and vendor multiples: Kiwoom data via the luxrix screen, struck on the September 23, 2026 close. Financial statements: consolidated quarterly and annual filings at Korea’s Financial Supervisory Service electronic disclosure system. First-half profit components: Bloter, August 16, 2026, translated from Korean by me. Market share, overseas mix and global ranking: Korean Insurance Newspaper, September 21, 2026, translated from Korean by me. Ceded premiums abroad: Bloter, April 16, 2025. Drivers of the first-half result: Hankyung Financial News, August 30, 2026. Independent close and multiple cross-check: Chickstock. Korean sell-side valuations: Edaily, May 19, 2025 and Mirae Asset Securities, March 24, 2025. Peer equity: Stock Analysis, RenaissanceRe balance sheet. Exchange rate: Money Today, September 23, 2026.
Related reading