Korea Cast Iron Pipe Outlook Hinges on Its Unpaid Invoices
The Korea Cast Iron Pipe outlook I care about is a cash question, and the June 30, 2026 balance sheet answers it badly for now. Between the end of December and the end of June, the company’s receivables and inventory together grew by KRW 16.2bn (about $11.9 million), cash from operations for January to June came in at minus KRW 4.42bn, and a short-term loan of KRW 5.56bn showed up where the column had read zero. Profit went up over the same months. The cash did not follow it.
I do not own Korea Cast Iron Pipe Ind. Co. (KRX: 000970), and after going through these numbers I am still not buying. It is a Busan maker of ductile iron water and sewer pipe listed on the KOSPI, Korea’s main board, with a market value of roughly KRW 149.6bn, or about $110 million, at the September 29, 2026 close of KRW 6,560 (Google Finance). Small, thinly traded names like this rarely get written up in English, which is part of why I keep a record of them.
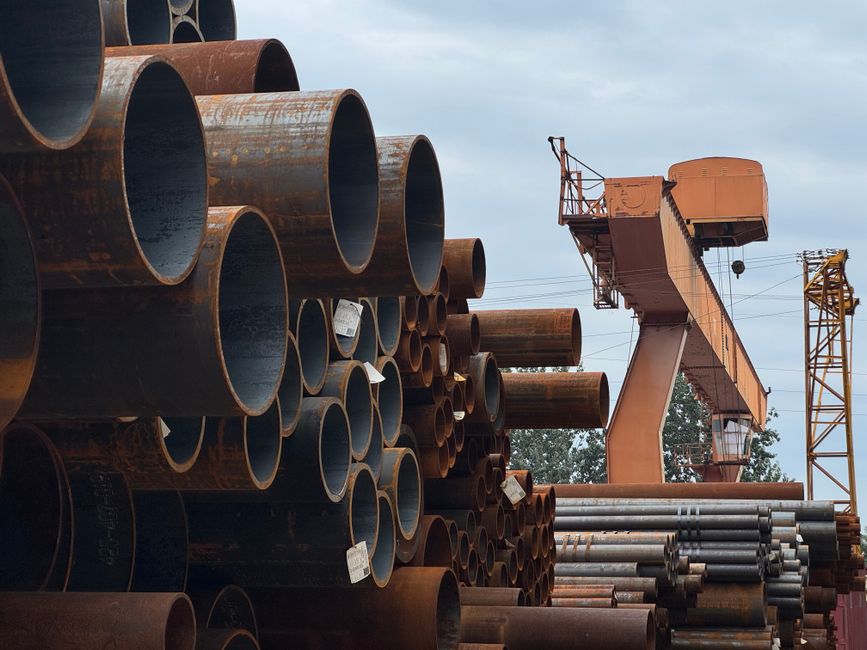
Korea Cast Iron Pipe makes ductile iron pipe for Korean water utilities. Its sales depend heavily on public water budgets. In 2026 its profits improved. Its cash position did not improve with them. Receivables rose by KRW 6.78bn between December and June, and inventory by KRW 9.42bn. Against June 2025, though, inventory was lower and receivables were the line that grew. Payables grew only KRW 1.49bn, so the company carried the difference itself. Operating cash for the six months was negative. The dividend of about KRW 8.60bn went out regardless. A KRW 5.56bn short-term loan appeared for the first time in the periods I checked. In past years the fourth quarter has brought the cash back. I am watching whether that happens again before I change my view. For now I own none and I am staying on the watch list.
Contents
The Korea Cast Iron Pipe outlook starts with where six months of profit went
For January to June 2026 the company reported consolidated net profit of KRW 8.73bn, per its semi-annual report filed on August 14 and carried in Kiwoom’s DART-sourced data. On paper that is a better six months than 2025. On the balance sheet, though, retained earnings barely moved: KRW 258.49bn at the end of December and KRW 258.37bn at the end of June, per ValueLine’s compilation of the company’s reports (ValueLine balance sheet). The dividend for 2025, about KRW 8.60bn in total, was paid after the March shareholder meeting and took almost exactly what the six months earned.
That by itself is fine. Paying out what you earn is a choice, and this company has paid the same dividend for five straight years. My problem starts one line lower. If the profit went to shareholders, then the extra receivables and inventory had to be funded from somewhere else, and the only places left were the cash pile and new borrowing.
Here is how the main current items moved between the two dates, all consolidated and in KRW bn, from the same ValueLine page.
| Item (KRW bn) | Dec 31, 2025 | Jun 30, 2026 | Change |
|---|---|---|---|
| Cash and equivalents | 47.51 | 44.12 | -3.39 |
| Short-term deposits | 36.50 | 36.50 | 0.00 |
| Trade receivables | 42.56 | 49.34 | +6.78 |
| Inventory | 73.58 | 83.00 | +9.42 |
| Trade payables | 27.76 | 29.25 | +1.49 |
| Short-term borrowings | 0.00 | 5.56 | +5.56 |
Source: ValueLine compilation of DART consolidated reports, figures converted from KRW 100 million units. Change column is my own subtraction.
Receivables and inventory: the Korea Cast Iron Pipe outlook in two lines
Add the receivables and inventory increases and you get KRW 16.20bn. Subtract the extra KRW 1.49bn the company owed its own suppliers and roughly KRW 14.7bn of new money was sitting in unpaid customer invoices and in pipe on the ground at the end of June. That is about 9.8% of the company’s market value, or around $10.8 million.
I split the two because they mean different things to me. More receivables usually means more sales to slow payers, and here most customers are local governments and public water agencies, which tend to pay slowly but reliably. More inventory ties up melted iron, energy and labor that has already been paid for. Ductile iron pipe does not spoil, yet a pile of finished pipe waiting for orders that have not come is cash sitting in a yard.
Against June 2025, only one line stands out
Then I checked the same date a year earlier, because December and June are different seasons for a company that sells to public budgets, and comparing them flatters or punishes whichever line has a seasonal swing. The June 2025 figures below come from StockAnalysis’s quarterly balance sheet (StockAnalysis); the December figures from that source match ValueLine’s, which gave me some comfort in putting the two side by side.
| Item (KRW bn) | Jun 30, 2025 | Jun 30, 2026 |
|---|---|---|
| Trade receivables | 40.36 | 49.34 |
| Inventory | 90.07 | 83.00 |
| Cash and equivalents | 43.66 | 44.12 |
| Trade payables | 32.91 | 29.25 |
Sources: StockAnalysis quarterly balance sheet (June 2025), ValueLine (June 2026), both drawn from DART consolidated reports.
Seen this way, inventory is the smaller worry. The June 2026 pile of KRW 83.00bn is about 7.8% below the June 2025 level, and the December 2025 figure it grew from was the lowest year-end level of the four years I checked (KRW 73.58bn, against KRW 79.77bn to KRW 85.30bn from 2022 to 2024). Receivables are different. At KRW 49.34bn they are about 22% above the same date a year earlier, and higher than at any year-end from 2022 to 2025, when they sat between KRW 42.48bn and KRW 44.09bn. Payables, meanwhile, are lower than a year ago, so suppliers are financing less of the gap. That is why my title points at unpaid invoices. The company is waiting longer for its money, or selling more to buyers who pay at year-end, and I cannot tell which from the balance sheet alone.
The first short-term loan in the table
Short-term borrowings sat at zero at the end of 2025 and read KRW 5.56bn at the end of June. On its own that loan is small: the company still held KRW 80.62bn in cash and short-term deposits, which is about 54% of its market value. I am not worried about solvency here. What caught my eye is the sequence. The company borrowed while leaving its deposits untouched, and that choice only makes sense if management expects the cash to come back soon enough to repay it.
For another Korean steel name where a single public-policy lever was supposed to explain the numbers, Dongkuk Steel is worth reading beside this one. There, an estimate for a trade duty did not match what the company actually reported; here, a year of public water orders has to show up as collections before the loan goes away.
Why a negative first six months might not change the Korea Cast Iron Pipe outlook
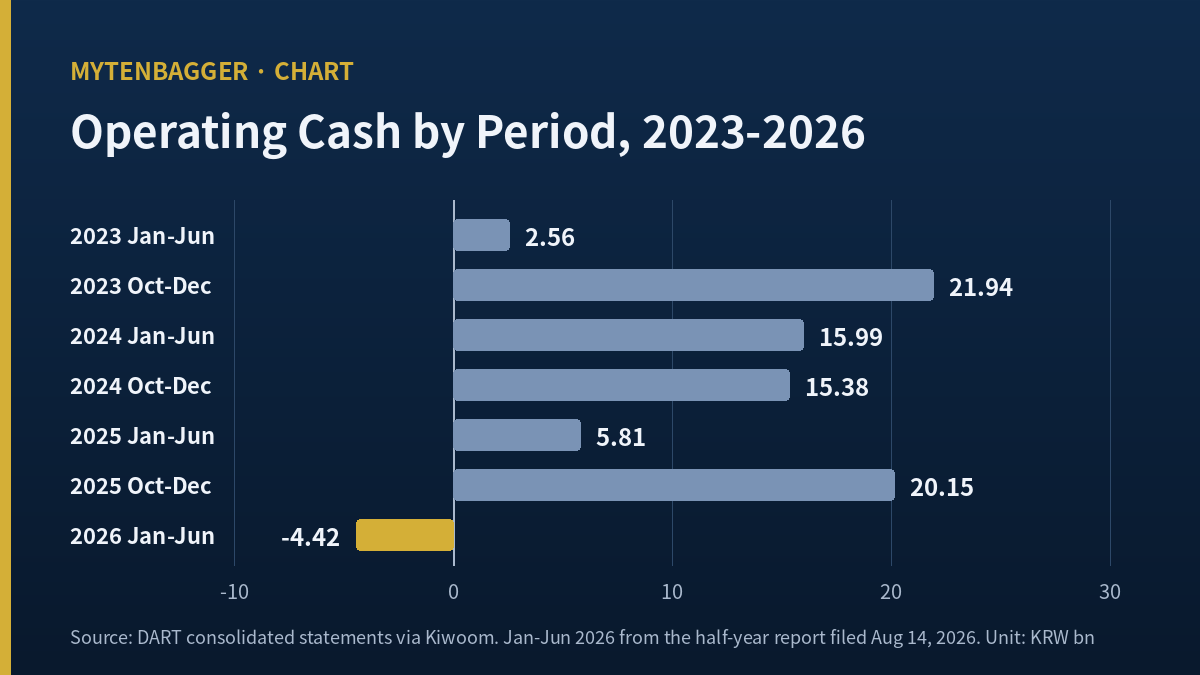
Before calling this a problem I checked whether it happens every year. Water pipe sales in Korea lean on public budgets, and public spending often arrives late in the year. Here is operating cash for January to June against October to December, from Kiwoom’s DART-sourced cash data. The fourth-quarter figures are derived by subtracting the nine-month total from the full year.
| Year | Jan to Jun (KRW bn) | Oct to Dec (KRW bn) |
|---|---|---|
| 2023 | +2.56 | +21.94 |
| 2024 | +15.99 | +15.38 |
| 2025 | +5.81 | +20.15 |
| 2026 | -4.42 | not yet reported |
Source: DART consolidated cash data via Kiwoom. October to December figures derived as full year minus January to September.
Two things stand out. The October to December period brought in between KRW 15.38bn and KRW 21.94bn in each of the three complete years shown. And 2026 is the first year in this table where the January to June figure went below zero. So the seasonal pattern is real, and it is also true that this year started from a weaker spot than any of the three before it. Full-year operating cash in 2025 was KRW 27.33bn against capital spending of KRW 4.35bn, which covered the dividend with room to spare. If the last three months of 2026 look like the last three months of 2025, the loan disappears and this whole section becomes a footnote.
To put the dividend in that full-year frame: KRW 27.33bn of operating cash minus KRW 4.35bn of capital spending left KRW 22.98bn in 2025, about 2.7 times the KRW 8.60bn paid out. That is comfortable coverage over a whole year. My concern is narrower. It is about whether 2026 repeats that pattern, given that it began with operating cash below zero and with more money owed by customers than at any recent year-end. A company can cover its dividend over twelve months and still need to borrow in the middle of them, and that is what the June balance sheet shows.
Steelmakers deal with a similar question on a far larger scale. When I looked at Hyundai Steel, the part of the business that earned the second quarter was different from the part expected to carry the third, and the gap between those two was the whole thesis. The logic here is smaller and simpler: what earned the six months was the income line, and what has to carry the full year is collections.
The Korea Cast Iron Pipe outlook and a treasury share deadline
There is a second asset on this balance sheet that matters to the per-share picture. The company has 22.8 million shares in issue (Bloter, citing a November 2025 disclosure), and the 2025 dividend went to 21,511,250 shares, a figure I derived by dividing the KRW 8.6045bn payout by the declared per-share dividend. The difference, 1,289,250 shares or 5.65% of the total, is treasury stock carried at KRW 2.74bn.
Korea changed its Commercial Act this year. The amendment took effect on March 6, 2026, and requires listed companies to cancel treasury shares, with a deadline of September 5, 2027 for shares a company bought directly before the law, unless shareholders approve a plan to hold or dispose of them, according to a law-firm briefing published in the Korean legal press (Law Times, via Yulchon). I could not confirm whether Korea Cast Iron Pipe put such a plan to its March 2026 meeting. If it cancels the shares, the market value does not change, since those shares already receive no dividend, but the number of issued shares falls to about 21.5 million and every per-share figure that uses the number of issued shares shifts by about 6%.
The controlling shareholder group holds a narrow majority of the issued shares, per the same Bloter report, and the free float is thin. A cancellation would push the group’s stake a little higher without any purchase. I note that as a fact about ownership and nothing more.
On valuation, equity attributable to owners was KRW 361.69bn at the end of June per the Kiwoom data, which puts the price at roughly 0.41 times that figure by my calculation. I do not lean on that multiple much. A company can trade below its net assets for decades if those assets never turn into cash for shareholders, and the first six months of 2026 were a period when they did not.
An Indian pipe maker in the same months
For a global comparison I looked for a listed ductile iron pipe producer and ended up with Electrosteel Castings (NSE: ELECTCAST) in India. For April to June 2026 it reported revenue from operations of ₹1,426 crore against ₹1,558 crore a year earlier, down 8.5%, and consolidated net profit of ₹48 crore against ₹89 crore, down about 46% on those rounded figures (ScanX). A results write-up quoted the company as linking the weaker quarter to lower government spending on water projects and expecting demand to recover (InvestyWise). I kept the numbers in rupees on purpose and did not convert them, because the point is the direction.
The two companies are very different in size and in market, so I use this only as a check on the demand story. In both countries, ductile iron pipe sells to public water systems and moves with public budgets. The Indian company saw that dependence in its income statement this spring. The Korean company’s income held up, and the same dependence showed up in its cash. Budget risk showing up in cash is milder than budget risk showing up in profits, but I would not call it absent.
There is also a live argument in Korea about how much replacement work the water systems really need. In a July 13, 2026 op-ed, Jeong Bong-seok, an adjunct professor of environmental engineering at Pusan National University, called the administrative rule that treats pipes older than three decades as aged an engineering oversimplification, and argued for performance-driven asset management using condition data instead of pipe age (Kyunghyang Shinmun, in Korean; my paraphrase). If utilities move that way, replacement becomes more targeted. That could mean fewer kilometers of pipe replaced on a fixed age trigger, which is the demand story most investors in this company rely on. It is one expert’s view, and I treat it as a reason to be careful with any growth assumption here.
Five ways my Korea Cast Iron Pipe outlook could be wrong
No brokerage I could find publishes estimates on this company, and the earnings page I checked showed no consensus at all. With no outside forecast to test against, the case against my view has to come from the company’s own record.
- The fourth quarter has delivered between KRW 15.38bn and KRW 21.94bn of operating cash in each of the last three years. One weak six months may simply be timing.
- Higher receivables can mean higher sales to public buyers who pay late in the year. That is a normal feature of this customer group.
- Cash and short-term deposits still equal about 54% of the market value, so the new loan carries no financial strain.
- Scrap iron prices in Korea were still being cut in late September, according to a trade paper (Steel and Metal News), which could lower the cost of the inventory the company builds from here.
- A treasury share cancellation would lift per-share figures without any change in the business.
What I am watching, and what I got wrong at first
I keep three conditions for this record, and all of them can be checked in the company’s reports:
- If operating cash for January to September, due in the third-quarter report by November 16, 2026, is back above zero, I treat the first six months as timing.
- If receivables at the end of September are still above the KRW 49.34bn at the end of June, I stop treating the gap as timing and start treating it as slower payment.
- If the short-term loan is still on the balance sheet at the end of 2026 after the fourth quarter’s collections, I will write this company up as one whose dividend now leans on borrowing.
My first read of the income line
When I started on this name, I looked at the six-month income figures first and nearly stopped there. Profit up, dividend steady, a price well below net assets: it read like a plain value case, and I had the first line of this entry written that way. Honestly, it was only when I laid the two balance sheet dates next to each other that the story changed. The income statement had told me the truth about profit. It had said nothing about whether that profit had turned into money the company could hand out without borrowing. And even then I pointed at the wrong line at first: inventory looked like the culprit until I compared June with June. I now open the current-asset lines before the income lines for any company whose customers are public bodies, and I compare them with the same month a year earlier before I compare them with December.
So my position is the same as when I started, with a clearer reason. I own none. I will check the September balance sheet for three lines: receivables first, then inventory and the loan. If the cash comes back in the last three months of the year as it did in 2023, 2024 and 2025, that tells me the company paid its dividend out of a seasonal gap and nothing more. If it does not, the dividend and the loan will be the story of 2026 for this company, and I would rather find that out from its filings than from the share price.
Prices and multiples reflect the September 29, 2026 close of KRW 6,560 (previous close KRW 6,600; Google Finance and ChickStock agree). Market value uses 22.8 million issued shares and is approximate. USD figures are converted roughly at about KRW 1,357 per dollar, the same-day Seoul close reported by Money Today. Balance sheet items come from ValueLine’s compilation of DART reports; cash figures come from Kiwoom’s DART-sourced data. Differences and ratios are my own calculations and are rounded.
Related reading
- Sajo Daerim Dividend Yield 0.90% as Its Largest Holder Buys
- TKG Huchems AprilBio Investment Paid 2.1x the Current Price