
LG Uplus Q2 Results: Record Operating Profit, Falling Revenue
LG Uplus stock and three lines of the Q2 2026 income statement
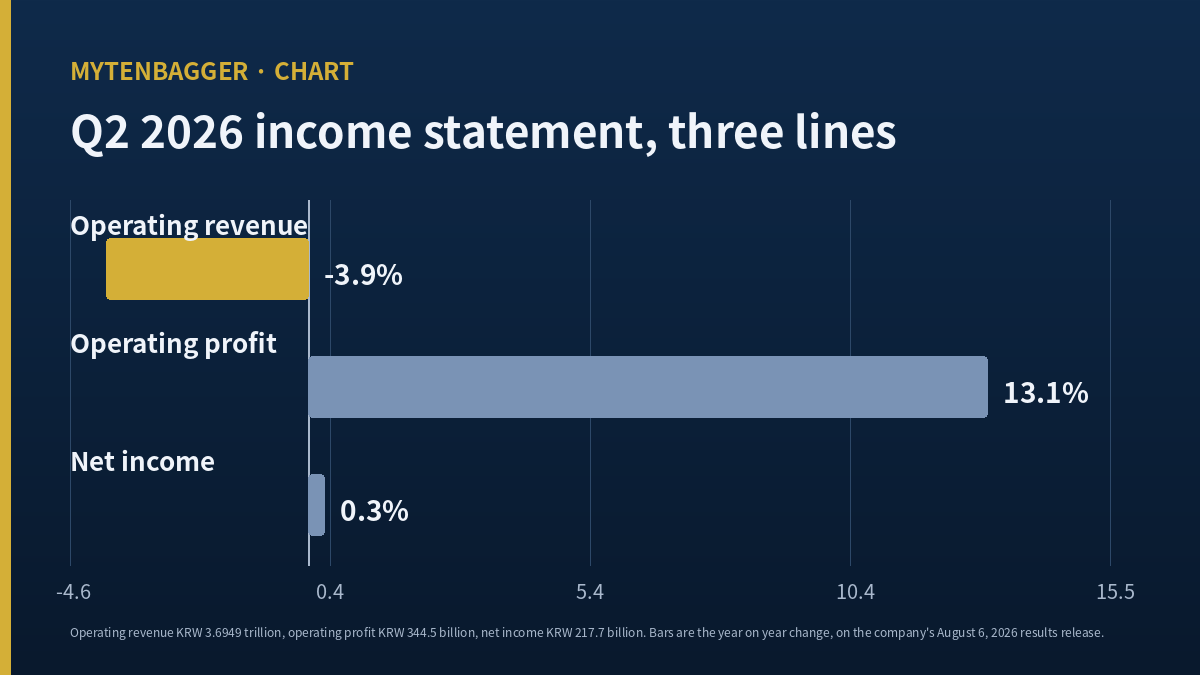
1. Operating revenue KRW 3.6949 trillion (USD 2.6048 billion), down 3.9 percent year over year
2. Operating profit KRW 344.5 billion (USD 242.86 million), up 13.1 percent, described by the company as a record quarter
3. Net income KRW 217.7 billion (USD 153.47 million), up 0.3 percent
Line 2 grew by KRW 39.99 billion. Line 3 grew by KRW 621 million. The distance between those two numbers is what I wrote this piece about. My position is watching.
Contents
Why I Opened LG Uplus Stock Again
I opened this one in early August because of an interim dividend decision, and the line that caught me first was somewhere else entirely.
The company reported second quarter results on August 6, 2026. Operating profit came in at KRW 344.5 billion, up 13.1 percent from a year earlier, and the company called it a record quarter. In the same release, net income was KRW 217.7 billion, up 0.3 percent. I sat with those two numbers side by side for a while, and this piece is what came out of that.
One note on market structure before the numbers. LG Uplus trades on the KOSPI, the senior board of the Korean Exchange, under code 032640. KOSPI is the large capitalization market; KOSDAQ is the separate growth board. This company is on KOSPI.
Pinning LG Uplus Stock to the August 13 Close
My reference price is the close of Thursday, August 13, 2026: KRW 14,700, about USD 10.3631. The vendor screen carried KRW 14,950 in its current price field, which was the Monday August 10 close, and its price trend field pointed at KRW 14,850, an intraday quote from August 14. Neither route gave me the prior session, so I pulled the daily candle series directly.
Shares outstanding on the vendor screen are 424,428,094. A separate Korean company data screen dated June 12, 2026 shows 424,427,732, a difference of 362 shares. That gap moves market capitalization by KRW 5.32 million, which is immaterial here. Reconstructing from the vendor count, 14,700 times 424,428,094 equals KRW 6,239,092,981,800, or KRW 6.2391 trillion (USD 4.3984 billion). The vendor headline capitalization of KRW 6.3452 trillion reproduces exactly as 14,950 times 424,428,094, which confirms that screen is dated August 10.
| Item | Value | Derivation |
|---|---|---|
| Reference close | KRW 14,700 (USD 10.3631) | Daily candle, Thursday August 13, 2026 |
| Market capitalization | KRW 6.2391 trillion (USD 4.3984 billion) | Close times 424,428,094 shares, reconstructed |
| Trailing PE | 12.1730 | 14,700 divided by EPS of KRW 1,207.59 |
| Price to book | 0.7078 | 14,700 divided by book value per share of KRW 20,770 |
| Dividend yield | 4.4898 percent | FY2025 DPS of KRW 660 divided by 14,700 |
| Versus 250 day high | Down 21.8085 percent | Intraday high of KRW 18,800, recomputed |
The vendor printed a trailing PE of 12.38 and a price to book of 0.72, both on the August 10 close, so I recomputed each figure on my own reference price instead of carrying those over. Screen values in this section come from Kiwoom data refreshed August 10, 2026 at 20:16 Korea time. Won to dollar conversions in this article use KRW 1,418.5 per dollar, the Seoul market close of Wednesday, August 12, 2026, as cited in a Korean bank daily currency note. My price base is one business day later than my currency base, and I am flagging that gap instead of papering over it.
The Other Side Comes First for LG Uplus Stock
Before the profit story, the counterargument. This company has the lowest average revenue per wireless user among the three Korean carriers, and that figure has declined for more than three years. Korean outlet Sisa Journal e reported on February 20, 2026 that the Q4 2025 figure was KRW 17,834 (about USD 12.5724), down 4.8 percent year over year and down 2.1 percent from the prior quarter. In the same report SK Telecom stood at KRW 28,848 excluding its mobile virtual network business, and KT at KRW 35,295 excluding machine to machine and virtual network lines. Because the three exclusions differ, I do not subtract or divide those figures against each other.
What that Korean reporting identified as the cause lines up precisely with this quarter. Adding low priced machine to machine connections raises the line count while pulling the average down. The company reported 31.467 million mobile connections in Q2 2026, up 5.2 percent year over year, with a quarterly net addition of 536,000. Within that, direct mobile subscriptions reached 22.442 million, up 7.2 percent, while virtual network subscriptions reached 9.025 million, up only 0.4 percent. Connections grew 5.2 percent while mobile segment revenue of KRW 1.6602 trillion grew 0.9 percent. The gap of 4.3 percentage points is the price per line falling, and it did not stop falling this quarter.
The same report noted that a police investigation into alleged server disposal leaves open the possibility of subscriber losses. I could not confirm the current status of that matter, and I will not size something I have not confirmed.
Three Lines Down the Income Statement of LG Uplus Stock
Read the company release top to bottom and it goes like this. Operating revenue of KRW 3.6949 trillion, down 3.9 percent. Service revenue of KRW 3.0765 trillion (USD 2.1688 billion), up 2.0 percent. Operating profit of KRW 344.5 billion against KRW 304.506 billion a year earlier, up 13.1 percent. Net income of KRW 217.7 billion against KRW 217.079 billion a year earlier, up 0.3 percent. The company explained the revenue decline as lower handset sales. For the profit gain it pointed to cost efficiency work centered on return on investment, together with colocation growth at its AI data center business.
By segment: mobile KRW 1.6602 trillion, up 0.9 percent; smart home KRW 663.8 billion, up 4.3 percent; enterprise infrastructure KRW 464.4 billion, up 8.6 percent; AI data center KRW 124.1 billion (USD 87.49 million), up 28.9 percent. The fastest growing segment is 3.3587 percent of total operating revenue. I am keeping that ratio in mind, because a growth rate and a contribution are different things.
Where KRW 39.373 billion went missing
Pulling the year earlier quarter from the Korean regulatory filings and converting it to a discrete quarter gives operating profit of KRW 304.506 billion and net income of KRW 217.079 billion. Stack this quarter on top:
- Operating profit went from KRW 304.506 billion to KRW 344.5 billion. Gain of KRW 39.994 billion (USD 28.1946 million), up 13.1341 percent.
- Net income went from KRW 217.079 billion to KRW 217.7 billion. Gain of KRW 621 million (USD 437,800), up 0.2861 percent.
- Difference between the two gains: KRW 39.373 billion (USD 27.7568 million).
- Share of the operating gain that reached net income: 0.621 divided by 39.994 equals 1.5527 percent.
Flipping it into a ratio makes the picture sharper. Net income as a share of operating profit fell from 71.2889 percent in Q2 2025 to 63.1930 percent in Q2 2026, a drop of 8.0959 percentage points. For context, the same ratio was 64.6491 percent in Q1 2026 and 63.6083 percent in Q1 2025. That tells me 63.1930 percent is not the odd number here. The odd number is the 71.2889 percent in the comparison quarter, which sits above what this company normally converts.
So I do not read this as money newly draining away in 2026. The arithmetic fits better with something sitting below the operating line in Q2 2025 that is simply absent now. Whether that something was non operating income, a tax item, or an equity method entry, I cannot assign it until the half-year filing is public. Annual interest expense, for what it is worth, moved the helpful way: KRW 311.831 billion in 2024 and KRW 278.767 billion in 2025 per the filings, so financing cost is a poor candidate. I am not going to name a line I have not read.
Two Thirds of Quarterly EBITDA Is Depreciation
The company printed Q2 EBITDA of KRW 1.0348 trillion (USD 729.50 million), up 5.9 percent. Its stated EBITDA margin of 33.6 percent closes to 33.6356 percent when divided by service revenue of KRW 3.0765 trillion, which tells me what the company divided by, so I take it as given.
Subtracting operating profit from EBITDA leaves depreciation and amortization. KRW 1,034.8 billion less KRW 344.5 billion is KRW 690.3 billion (USD 486.64 million), a derived figure. The year earlier equivalent from the filings is KRW 977.166 billion less KRW 304.506 billion, or KRW 672.66 billion, also derived, so the increase is 2.6224 percent. Put differently, 66.7052 percent of this quarter’s EBITDA is the annual value loss on equipment already built and paid for. What survives into reported profit is 33.2948 percent.
Why that share matters for the next section
Chief financial officer Yeo Myeong-hui said on the August 6, 2026 earnings call that the company would keep spending inside its EBITDA and secure free cash flow steadily, and that its 200 megawatt AI data center in Paju is proceeding with no external funding. If two thirds of that envelope is a depreciation charge, then the practical size of spending inside EBITDA is smaller than the KRW 1.0348 trillion headline suggests.
From Falling Capex to Paju, the Next Phase for LG Uplus Stock
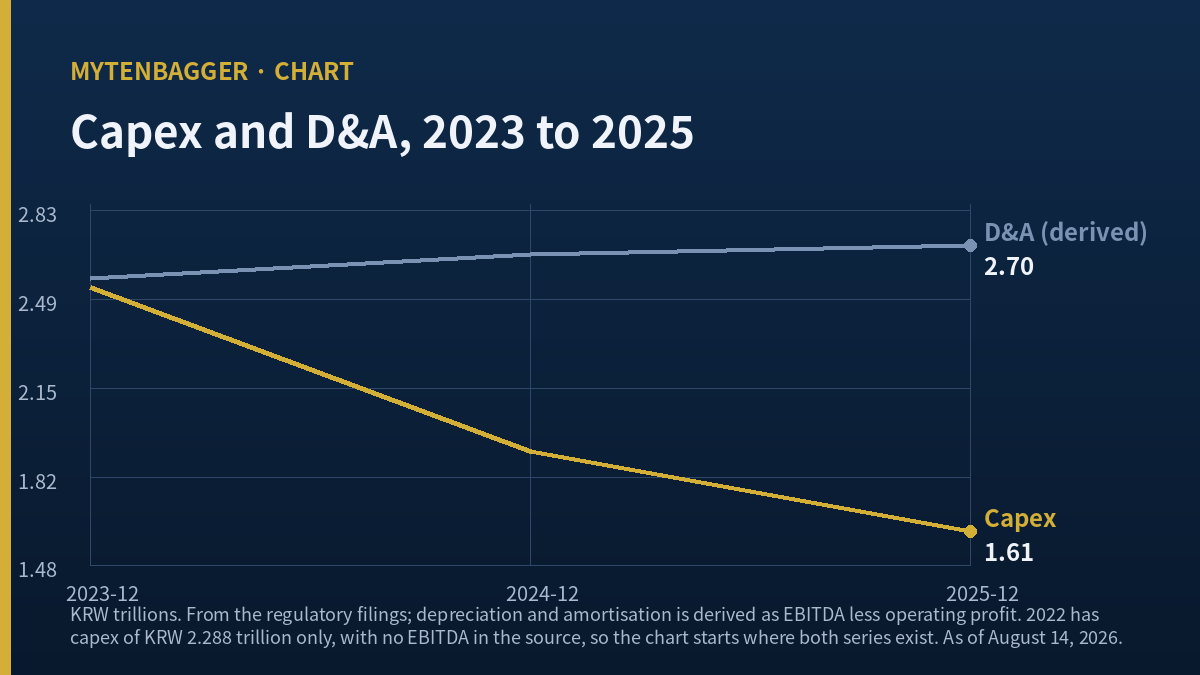
Widen the frame to full years and the direction becomes obvious. Consolidated capital expenditure from the regulatory filings ran KRW 2.288 trillion in 2022, KRW 2.5357 trillion in 2023, KRW 1.915 trillion in 2024, and KRW 1.6114 trillion (USD 1.1360 billion) in 2025. From KRW 2.5357 trillion in 2023 to KRW 1.6114 trillion in 2025 that is a 36.4505 percent decline.
Over the same span, depreciation and amortization derived as EBITDA less operating profit went from KRW 2.5712 trillion in 2023 to KRW 2.6638 trillion in 2024 and KRW 2.6970 trillion (USD 1.9013 billion) in 2025, a 4.8931 percent increase. Capital expenditure divided by that charge fell from 0.9862 in 2023 to 0.5975 in 2025.
| Fiscal year | Capital expenditure | D and A (derived) | Capex over D and A | Operating profit |
|---|---|---|---|---|
| 2022 | KRW 2.2884 trillion | Not derivable | Not derivable | KRW 1.0813 trillion |
| 2023 | KRW 2.5357 trillion | KRW 2.5712 trillion | 0.9862 | KRW 998.031 billion |
| 2024 | KRW 1.9150 trillion | KRW 2.6638 trillion | 0.7189 | KRW 863.130 billion |
| 2025 | KRW 1.6114 trillion | KRW 2.6970 trillion | 0.5975 | KRW 892.131 billion |
The 2022 charge is blank because that year’s EBITDA is absent from the source data. I will leave a blank before I import a number from a different year.
Here is how I read the table. The operating profit improvement of the last three years did not come from a larger top line. Revenue grew 7.5079 percent, from KRW 14.3726 trillion in 2023 to KRW 15.4517 trillion (USD 10.8930 billion) in 2025, while operating profit fell 10.6109 percent, from KRW 998.031 billion to KRW 892.131 billion. On an annual basis this company has still not recovered its 2023 profit. A record quarter and an annual recovery are two separate claims.
The axis that was shrinking is about to grow again
The direction turns here. The company said it expects 2026 capital expenditure to rise year over year, and that first half spending on a parent company basis reached KRW 477.8 billion (USD 336.83 million), up 21.5 percent. Size estimates vary by source. The chief financial officer described roughly KRW 2 trillion (USD 1.4099 billion) of investment underway in the 200 megawatt Paju facility, while Kim Hoi-jae of Daishin Securities cited an additional commitment of KRW 1.35 trillion across 2026 through 2028 in a July 30, 2026 note. The natural reading is that the first is the full project and the second is incremental spending over three years, but no public document closes that boundary, so I print both with their sources attached and divide neither by the other.
This is exactly why I keep the name on a watch list. When capital expenditure grows again, the depreciation charge follows it a few years later. What happens to the current margin structure at that point is the real question for this company, and the answer shows up on the third line of the income statement before it shows up on the second.
Four Korean Brokerages on LG Uplus Stock, Split by Date
If the published figures are not split by date, values carrying different amounts of information get blended together. Second quarter results came out on August 6.
| House | Analyst | Published valuation | Date | Q2 reflected |
|---|---|---|---|---|
| BNK Investment Securities | Kim Jang-won | KRW 19,000, raised from KRW 17,000 | 2026-08-10 | Yes |
| Daishin Securities | Kim Hoi-jae | KRW 20,000 | 2026-07-30 | No |
| Hana Securities | Not confirmed | KRW 20,000 | 2026-05-28 | No |
| IBK Securities | Not confirmed | KRW 20,000 | 2026-04-23 | No |
Split that way, one fact stands out. The only valuation published after the record quarter sits KRW 1,000 below the three published before anyone had seen it. Kim Jang-won raised his number from KRW 17,000 to KRW 19,000 (USD 13.3944) on the interim dividend increase and the buyback, and described parent basis second quarter operating profit of KRW 347.0 billion, up 11.7 percent, as a record. Note that his KRW 347.0 billion and 11.7 percent are parent company figures and differ from the consolidated KRW 344.5 billion and 13.1 percent used earlier in this article. The two bases do not mix.
Kim Hoi-jae held at KRW 20,000 (USD 14.0994) on a projected 2026 dividend per share of KRW 700, the KRW 90 billion buyback, and a total shareholder return ratio of 53 percent. The same note cited a six month average published valuation of KRW 19,971. Where that average moves now that results are out is the number I will watch next.
A global peer at almost the same multiple
US readers have a useful comparison close at hand. Verizon Communications closed at USD 48.22 on August 13, 2026, the same session as my Korean reference price, with a market capitalization of USD 200.34 billion, a trailing PE of 12.56, a forward PE of 9.51, earnings per share of USD 3.84, trailing revenue of USD 138.90 billion, and a dividend yield of 5.87 percent, per stockanalysis.com. Two reproductions check out: 48.22 times 4.15 billion shares gives USD 200.11 billion against the USD 200.34 billion displayed, and 48.22 divided by 12.56 gives USD 3.8392 against the displayed EPS of 3.84.
So the two carriers trade at nearly the same trailing multiple, 12.1730 against 12.56. What differs is the sales multiple: LG Uplus at 0.4038 times trailing revenue versus Verizon at 1.4423. A Korean carrier converting a smaller share of each revenue dollar into profit gets a much thinner sales multiple at a comparable earnings multiple, which is a reasonable place for the Korean name to sit given the revenue per line trend described above.
Buybacks, Cancellations, and Values I Could Not Verify
Share count changes reset market capitalization and every multiple built on it, so I checked separately. The company cancelled about 6.78 million shares worth roughly KRW 100 billion (USD 70.50 million) on August 5, 2025, and about 5.40 million shares with a book value of roughly KRW 80 billion (USD 56.40 million) on May 15, 2026 following an April 30 decision, described by the company as 1.26 percent of shares outstanding. Cumulative cancellation since the November 2024 corporate value program is roughly KRW 180 billion at book value.
The KRW 90 billion (USD 63.45 million) additional buyback decided on July 30, 2026 has not been cancelled yet. If it is, the market capitalization and capitalization based multiples computed above all move. Earnings per share and its multiple do not move on a cancellation, because treasury shares are already excluded from the weighted average count. The interim dividend is KRW 270 per share (USD 0.1903), up 8 percent from last year’s interim, payable August 28, 2026.
Values I could not verify, written down so I do not fool myself later:
- The specific account behind the KRW 39.373 billion gap. Not assignable before the half-year filing.
- A Q2 2026 revenue per user figure. The KRW 17,834 in this article is a Q4 2025 number, past a quarter boundary, so I did not write it in the present tense.
- The 250 day low. The vendor screen shows KRW 13,600 and the company data screen shows KRW 12,800 on a 52 week window. Different windows and different dates, so I used only the vendor 250 day figure in the table.
- The boundary between the roughly KRW 2 trillion Paju figure and the KRW 1.35 trillion sell side figure.
- The current state of the police investigation into alleged server disposal.
- A consolidated equivalent for the KRW 477.8 billion first half parent basis capital expenditure. I did not compute a growth rate across the two bases.
I also set aside several vendor cash flow and EBITDA fields whose quarterly values would not reconcile with the annual series on units, and pulled every annual figure back out of the regulatory filings instead. How multiples split across the other two Korean carriers is in my piece on the SK Telecom and KT valuation gap, and the power constraint behind Korean data center growth is in my piece on the 5GW grid bottleneck.
My Marker on LG Uplus Stock
KRW 14,700 does not look expensive on the face of it: 0.7078 times book, a 4.4898 percent yield. To change my read I would want two lines moving the same way.
The first is net income as a share of operating profit climbing back into the seventies and staying there for two consecutive quarters. A single quarter bounce is indistinguishable from the base effect I described above. The second is the spread between connection growth and mobile revenue growth narrowing from the 4.3 percentage points measured above. That would tell me price per line had started to move, which is a different signal from line count alone.
My hypothesis breaks the other way too, and I want that written down. If capital expenditure climbs while the depreciation charge stays flat and operating margin keeps improving anyway, then I have misread how this company makes its profit. My whole explanation here rests on cost restraint against a rising charge, and that version of events would kill it. At that point I stop watching and start the arithmetic over.
In price terms: the August 13 close of KRW 14,700 sits 21.8085 percent below the 250 day high of KRW 18,800 (USD 13.2534) and 8.0882 percent above the 250 day low of KRW 13,600 (USD 9.5876). Inside that band I do not act on price alone. A move back to KRW 18,800 would mean the market had already paid for the depreciation structure, which would put my arithmetic behind the tape. A break of KRW 13,600 would push the yield past 5 percent, and that is a number I would recompute even without the two conditions above. KRW 14,700 is a long way from either edge, which is precisely why there is nothing for me to do with it at the August 13 close.
Sources
- Q2 2026 results release, August 6, 2026, as reported by The Public and Newspim (Korean press, my translation)
- Earnings call remarks by the chief financial officer: FETV (Korean press, my translation)
- Three carrier Q2 comparison: Money Today, August 13, 2026
- Revenue per user comparison for Q4 2025: Sisa Journal e, February 20, 2026
- BNK Investment Securities valuation: Asia Economy, August 10, 2026
- Daishin Securities valuation: Newspim, July 30, 2026
- Treasury share cancellation: Electronic Times, April 30, 2026
- Verizon Communications reference data: stockanalysis.com, as displayed August 13, 2026
- Annual and quarterly financials: Korean Financial Supervisory Service electronic disclosure filings (FY2025 consolidated receipt 20260313000442, Q1 2026 receipt 20260515000666, Q2 2025 receipt 20250814001643)
- Price, share count, and per share metrics: Kiwoom data, screen refreshed August 10, 2026 at 20:16 Korea time. Reference close taken from the daily candle series for August 13, 2026. Currency conversion at KRW 1,418.5 per US dollar, Seoul close of August 12, 2026.
- LG Display Q2 Results: A Fifth Second-Quarter Operating Loss
- Cuckoo Homesys Dividend: One Payout, Three Different Yields