POSCO DX Stock Sits on 2022 Revenue: One Item Came Back
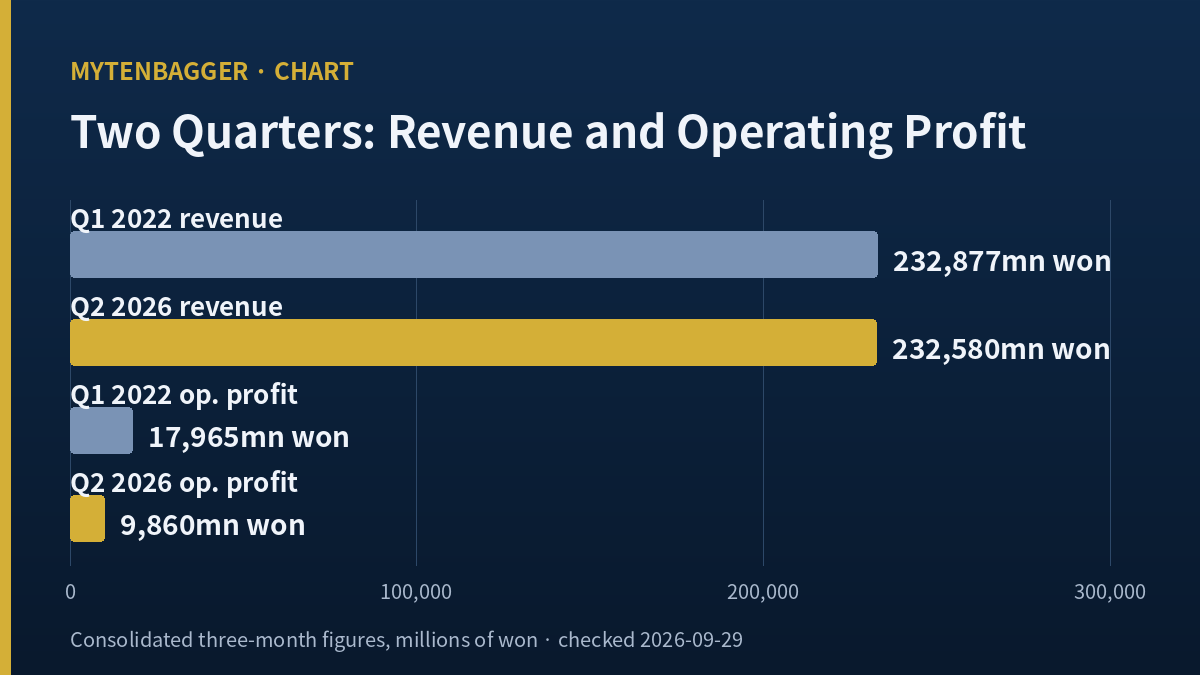
POSCO DX stock (KRX: 022100) closed at 20,200 won, or USD 14.80, on Monday, September 28, 2026. On March 31, 2022 the same shares closed at 6,200 won, or USD 4.54. That is a factor of 3.2581. In the three months ending each of those two dates the company sold 232,877 million won and 232,580 million won of work, or USD 170.59 million and USD 170.38 million. The gap between those two revenue figures is 0.1275 percent.
When a company’s quarterly revenue comes back to where it was four and a half years ago and its shares have more than tripled, I expect the explanation to sit in profit. I checked profit first. Three-month operating profit went from 17,965 million won, USD 13.16 million, to 9,860 million won, USD 7.22 million, a decline of 45.1155 percent. So the item that came back at the same size was revenue, and the other six I lined up beside it all landed somewhere else. This piece counts how far the word “back” reaches in this company, and then tests that count by swapping the comparison period.
Where I stand: I do not own this and I am watching. Market capitalization is 3,071,099,990,600 won, USD 2,249.73 million, which ranks 131st among 942 KOSPI names on the Chickstock screen. The seven-metric checklist scores 4 of 7, or 57 points, with return on equity at 9.5 percent, a price-earnings multiple of 58.97 and a price-book multiple of 5.38 all failing. I wait for the third-quarter report due November 14, 2026.
Contents
What POSCO DX Stock Buys and Who Pays for It
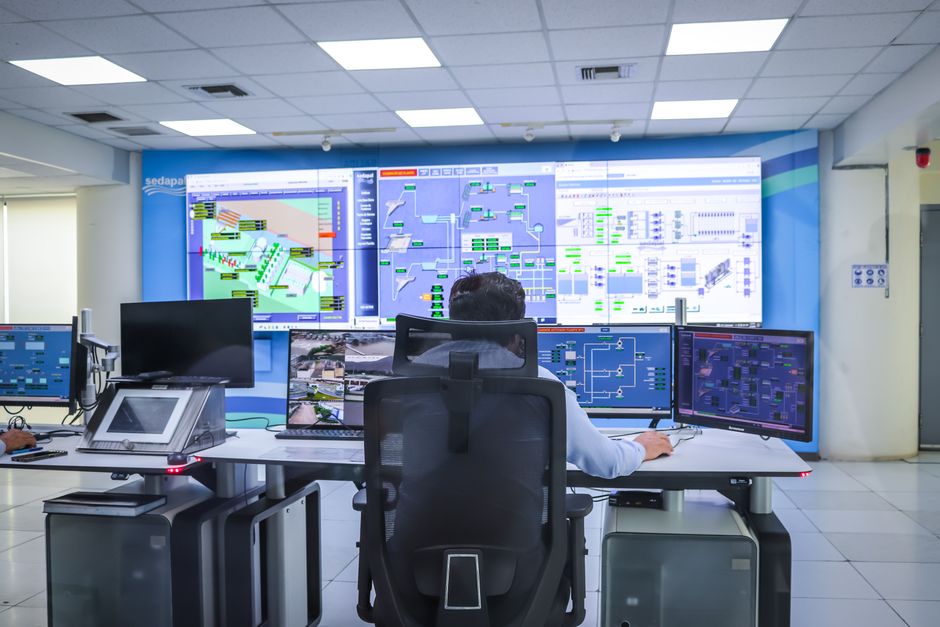
POSCO DX installs machinery and software inside factories. Its revenue comes from automation gear that takes people out of high-risk steelmaking steps, unmanned material handling inside cathode and anode plants, group-wide enterprise systems, and a desk automation product the company markets as an AI workforce platform. The shares trade on the KOSPI, the senior board of the Korea Exchange, where the larger and longer-listed Korean companies sit. The KOSDAQ is the junior board, and the distinction matters because this company moved from one to the other in January 2024 and the price history spans both. The sector string on the Kiwoom indicator screen reads IT services, and the Chickstock screen prints the same string.
When the company reported its second quarter on July 30, 2026 it also disclosed who its customers are. POSCO itself accounts for 64 percent of revenue, other group companies 27 percent, POSCO Future M 7 percent, and customers outside the group 3 percent. I am not building this piece on that concentration. Revenue mix inside a Korean conglomerate has been written about many times, and what I want to measure here is how far the size of that revenue has traveled back. The mix is still worth holding in mind, because it tells you what the order backlog later in this piece actually is. This company’s work orders come out of the group’s capital spending plan.
Here are four fiscal years first. Everything below is consolidated and taken from the company’s filings with Korea’s Financial Supervisory Service, in millions of won.
| Fiscal year | Revenue | Operating profit | Operating margin | Total equity | Total liabilities |
|---|---|---|---|---|---|
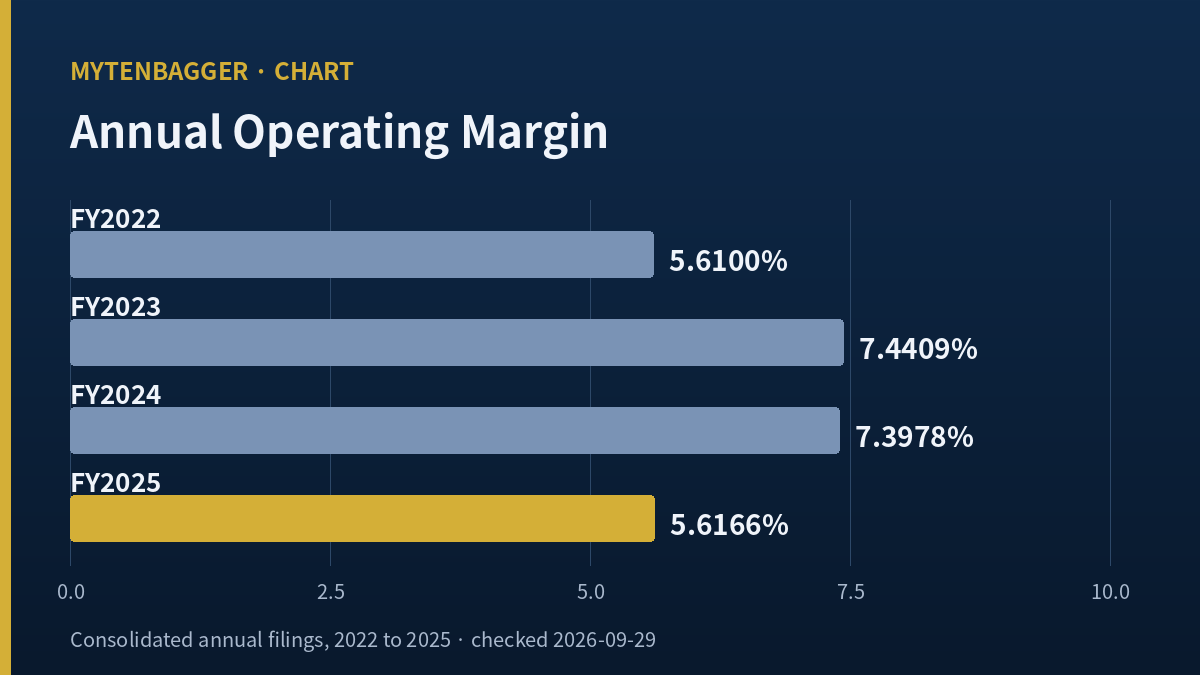
| 2022 | 1,152,680 | 64,668 | 5.6100% | 413,992 | 437,601 |
| 2023 | 1,485,875 | 110,563 | 7.4409% | 461,449 | 428,357 |
| 2024 | 1,473,290 | 108,991 | 7.3978% | 525,897 | 366,555 |
| 2025 | 1,075,175 | 60,388 | 5.6166% | 572,559 | 261,831 |
Revenue in 2025 was 27.0222 percent below 2024 and operating profit was 44.5936 percent below it. Full-year 2025 revenue of 1,075,175 million won is USD 787.62 million, against 1,473,290 million won, USD 1,079.25 million, the year before. The company held revenue above 1.47 trillion won for two consecutive years and then gave back roughly 400 billion won of it. Profit fell harder than revenue did.
How Korean Quarterly Filings Work, and Why That Matters Here
A reader used to United States filings should know one thing before reading any Korean quarterly number, because it changes what a comparison means. A US company files a 10-Q with discrete three-month income statement columns, so the March, June and September quarters each stand on their own in the document. Korean quarterly reports carry income statement figures accumulated from January 1 of that year. The first quarter is therefore the only period where the cumulative figure and the three-month figure are the same number. Every later three-month figure has to be produced by subtracting the previous cumulative period, and a fourth quarter has to be produced by subtracting the nine-month cumulative total from the full year.
That is why the two revenue figures this piece rests on need checking against something outside my own arithmetic. Half-year 2026 revenue of 474,090 million won, USD 347.29 million, less first-quarter revenue of 241,510 million won leaves 232,580 million won. The company announced second-quarter revenue of 232,581 million won, operating profit of 9,861 million won and net income of 11,816 million won on July 30. My figure is one million won away on revenue, which is where rounding in a filing table denominated in millions lands, and the profit lines agree to the last million. A newspaper report from May 4 carried first-quarter revenue of 241.5 billion won and operating profit of 3.658 billion won, which is the same first quarter. The 2022 first quarter needs no subtraction at all, because in a Korean filing the first quarter is already the discrete period.
POSCO DX Stock’s Smallest Quarter and Its Second Smallest Are 17 Quarters Apart
Ranked by three-month revenue, the eighteen quarters from early 2022 through June 2026 put April to June 2026 at the bottom with 232,580 million won and January to March 2022 immediately above it with 232,877 million won. Third is April to June 2022 at 238,096, fourth July to September 2022 at 239,483, fifth January to March 2026 at 241,510, and sixth July to September 2025 at 244,723. The largest quarter is October to December 2022 at 442,224, with January to March 2024 just under it at 440,116. Largest over smallest is a factor of 1.9014.
Why did I write 0.1275 percent smaller instead of the same?
The two figures are 297 million won apart. Rounded to the nearest hundred billion won they are identical, and the pull toward writing “the same” is real. I do not write it. In an earlier piece I met a company whose total liabilities were printed identically to the last million won in two consecutive fiscal years, and I could not establish which year was wrong, because the balance sheet identity closed on both. That left me with a procedure. When two figures look equal, I state the gap in both currency and percentage terms, I state where each figure came from, and I decide at that point whether “equal” or “close to equal” is the honest verb. These two differ by a non-zero amount, so the sentence reads 0.1275 percent smaller. The gap is also small enough that it changes no conclusion below.
Seven Items Across Two Quarters, and Only One Came Back
Here are the two quarters item by item. Flow items are three-month figures and stock items are balances on the last day of each period, in millions of won.
| Item | Jan to Mar 2022 | Apr to Jun 2026 | Change |
|---|---|---|---|
| Revenue | 232,877 | 232,580 | -0.1275% |
| Operating profit | 17,965 | 9,860 | -45.1155% |
| Operating margin | 7.7144% | 4.2394% | -3.4750 points |
| Net income | 15,195 | 11,816 | -22.2376% |
| Total assets | 635,868 | 822,856 | +29.4067% |
| Total equity | 361,572 | 567,079 | +56.8371% |
| Inventory | 2,780 | 11,576 | +316.4029% |
One of the seven moved by less than 1 percent. The other six moved between 22 and 316 percent, and they do not move together. The three profit items fell and the three balance sheet items rose.
Total liabilities are not in that table. They went from 274,296 million won to 255,776 million won, down 6.7518 percent, and I wanted seven body rows plus a section where debt and equity are read together. Counting liabilities as an eighth item would not change the answer, because a 6.75 percent decline is also not the same size.
POSCO DX Stock Retired Debt While Revenue Stood Still
Read across those 17 quarters on the balance sheet and the story is deleveraging. The debt-to-equity ratio fell from 75.86 percent to 45.10 percent, a move of 30.76 points. Total equity rose 56.8371 percent to 567,079 million won, USD 415.41 million, of which 564,064 million won, USD 413.20 million, belongs to the controlling shareholders. Total assets rose 29.4067 percent. Three-month interest expense fell from 931 million won to 301 million won, a decline of 67.6692 percent. This company now carries a bad quarter far more cheaply than it did in 2022, and none of that shows up in revenue.
The group company it fits out, POSCO Future M, has spent a long stretch below its own 2022 marks. The buyer of the equipment and the seller of it are stalled in the same window, which is the clearest way to see that this company’s revenue rides on group capital spending.
Inventory rising from 2,780 million won to 11,576 million won reads dramatically as a percentage and gently in absolute terms. At June 30, 2026 inventory equals 4.98 percent of that quarter’s revenue, and the days-of-inventory figure the data service computes is 4.5 days against 1.1 days in the 2022 quarter. Three extra days. I count the item among the six, and I do not build anything else on it.
Where did the operating margin go?
Three-month operating margin was 7.7144 percent in the 2022 quarter and 4.2394 percent in the 2026 one. Across the eighteen quarters there is exactly one operating loss, the three months from October to December 2025, with revenue of 260,815 million won and an operating loss of 1,217 million won. That figure is produced by taking the nine-month cumulative total out of the full year, so the company never published it in that form, and the data service labels its source as computed.
For the first half of 2026 the operating margin is 2.8514 percent, half of the 5.6166 percent the company earned across 2025. First-half revenue of 474,090 million won is 16.8 percent below the same half of 2025 and first-half operating profit of 13,518 million won, USD 9.90 million, which the company’s release stated as 13,519 million won, is 66.2 percent below it. Revenue down 16.8 percent against profit down 66.2 percent means either that the work which disappeared carried above-average margin, or that a large share of cost stays in place when revenue leaves. The company described second-quarter operating profit, 2.6956 times the first quarter’s, as profitability partly recovering.
The pattern where a thin first half leaves the whole annual estimate to the second half also ran through LG CNS, and at Samsung SDS the item I treated as the gate was capital allocation more than margin. Three companies carry the same sector string and wobble in three different places. POSCO DX builds and hands over plant, so revenue and profit leave together when a project is commissioned.
What a 960 Billion Won Backlog Asks of the Second Half
The company put its order backlog at 960 billion won, USD 703.25 million, at the end of June. New orders in the second quarter were 230.4 billion won, 32.8 percent above the same quarter of 2025, and new orders on a parent-only basis rose 38 percent. The work it named includes a physical-AI crane safety system for steelmaking, a fifth-stage switchgear package for a cathode plant, a group data and AI platform, and a next-generation enterprise portal. The company also set a goal of raising orders and revenue about 30 percent within three years.
What does the one published estimate require?
One Korean brokerage covered this name with a named analyst in 2026 within the range I searched. Park Kwang-rae of Shinhan Securities published a buy opinion on August 27, 2026 with a 27,000 won valuation, USD 19.78, and estimates of 999.3 billion won of 2026 revenue with 40.4 billion won of operating profit, then 1,193.0 billion won and 73.5 billion won for 2027. He put the June-end backlog at 956.7 billion won, roughly ten to eleven months of revenue, and cited first-half new orders of 497.5 billion won with 324.2 billion won of that in automation. He also cited the group’s 16.7 trillion won future-growth investment plan.
Subtract the reported first half from those estimates and the second half has to deliver 525.210 billion won of revenue, USD 384.74 million, which is 1.1078 times the first half, and 26.882 billion won of operating profit, USD 19.69 million, which is 1.9886 times the first half. The implied second-half operating margin is 5.1183 percent against 2.8514 percent in the first half, a factor of 1.7951. Revenue needs to be 11 percent better and profit needs to be 99 percent better. That asymmetry is what decides the rest of this year. It is worth adding that the estimate itself sits below 2025: revenue 7.0570 percent lower and operating profit 33.0993 percent lower.
How does a peer read against this?
I wanted one number from outside Korea, chosen so that it tests a single claim. Daifuku Co., Ltd. (TSE: 6383) sells the material handling and logistics automation equipment that overlaps with the unmanned handling side of this company’s work, and its quote page prints its own trailing twelve-month revenue as 689.75 billion yen with a change of positive 9.0 percent, as of the page’s September 4, 2026 update. I take that one figure and nothing else from it. No multiple, no margin, no size comparison. Then I run the same calculation on POSCO DX myself: the last four three-month revenue figures are 244,723, 260,815, 241,510 and 232,580 million won, a total of 979,628 million won, USD 717.62 million, against 1,249,795 million won for the four quarters before them, which is a decline of 21.6169 percent. A comparable equipment maker grew its trailing revenue 9.0 percent while this one shrank 21.6169 percent. That is the whole use of the peer here, and it argues that what happened is specific to who orders from this company.
Who raised each objection, and what would settle it?
I grouped the case against my reading by who makes it, because the source decides what I can go and check.
The company, two objections. First, a 960 billion won backlog worth ten to eleven months of revenue, with second-quarter orders up 32.8 percent, points to revenue expanding in the second half. Second, the three-year goal of 30 percent order and revenue growth implies the 2022-size quarter is a trough and not a level. If either holds, the sentence I counted becomes a photograph of a passage. What I can check is not the goal. It is the speed at which backlog becomes revenue, and that arrives as one line of a quarterly report.
The sell-side, one objection. Shinhan expects operating leverage in 2027: 1,193.0 billion won of revenue on 73.5 billion won of operating profit is a 6.1610 percent margin, between the 7.4409 percent of 2023 and the 5.6166 percent of 2025. If that holds, the margin decline is a trough between two work mixes. The weakness in this objection is its width. It is one named estimate. I relaxed the publication window and widened from business dailies to wire services and trade press and still found one. There is a coverage gap on this name and I am writing with it.
The figures themselves, two objections. Second-quarter operating profit of 9,860 million won is 2.6956 times the first quarter’s 3,658 million won, so the direction already turned before I started counting. And a 45.10 percent debt-to-equity ratio with 301 million won of quarterly interest expense means a weak stretch costs this company far less than it would have in 2022. These two objections have me as their source, which is why I hold them at the greatest distance.
Three Screens Print Three Book Values for POSCO DX Stock
Before any multiple, the closing price. Shares outstanding are 152,034,653. At 20,200 won that is 3,071,099,990,600 won, and the indicator screen’s own market capitalization of 3,071.1 billion won closes only on that price. The confirmed daily series carries 20,150 won for September 28, and the Chickstock screen carries 20,200 won with a gain of 210 won on the day, which implies a prior close of 19,990 won while the series shows 20,050 won for the previous session on September 23. Of the three candidate closes, one reconciles with a market capitalization printed by an independent source, so I take 20,200 won.
Which quarter does each book value belong to?
Book value per share splits three ways. The indicator screen says 3,752 won, the Chickstock screen says 3,746 won, and dividing controlling-shareholder equity of 564,064 million won at June 30, 2026 by the share count gives me 3,710.10 won. Solving each one backward identifies its period. 3,752 won is controlling equity of 570,463 million won at September 30, 2025. 3,746 won is 569,587 million won at December 31, 2025. One screen is nine months behind and the other is six.
Controlling equity at this company peaked at the end of September 2025 and has edged down since. So a stale figure produces a larger book value and a smaller price-book multiple. The screens print 5.38 and 5.34, and rebuilding the multiple on June 30 data gives 5.4446. In the two companies where I last caught this, equity was rising and the stale figure pushed the multiple up. Here the direction is inverted and the stale figure leans the flattering way.
The price-earnings multiple splits further. The screen prints 58.97 and labels the basis as the trailing four quarters. Solving it backward gives earnings per share of 342.55 won, USD 0.2509, and that equals full-year 2025 controlling net income of 52,081 million won, USD 38.15 million, over the share count. The actual last four three-month controlling figures are 17,440 million won, a loss of 1,116 million won, 3,947 million won and 11,731 million won, totaling 32,002 million won, USD 23.44 million, or 210.4915 won per share. At 20,200 won that is a multiple of 95.9659. The label says four quarters and the figure is one fiscal year.
The Chickstock screen does not close on itself either. Earnings per share of 326 won against a 20,200 won close makes 61.9632, while the screen prints 61.27. Book value of 3,746 won makes 5.3924, while the screen prints 5.34. The 326 won earnings figure implies net income of 49,563 million won, and I could not match that to any period this company has reported. So I use none of that screen’s multiples, its earnings per share or its return on equity, and I say so here instead of quietly dropping them.
Where I Stand on POSCO DX Stock, and Three Checks for November 14, 2026
I do not own this and I am watching it. The statutory deadline for the third-quarter report is November 14, 2026, and three items decide what I do after it.
First, three-month revenue for July to September. Take the nine-month cumulative figure and subtract the 474,090 million won first half. Above 232,580 million won and the floor was the June quarter. Below it and the bottom of the eighteen-quarter ranking moves again.
Second, three-month operating profit for the same period. Filling the published estimate takes 26,882 million won across both second-half quarters, so I look for something near 13,441 million won in this one. The entire first half was 13,518 million won, which means a single quarter has to match half a year.
Third, controlling-shareholder equity. It has gone from 570,463 million won at the end of September 2025 to 564,064 million won at the end of June 2026. If that continues, every screen running on a stale figure keeps printing a price-book multiple below the current one.
Which figures did I gather and leave out?
The 250-session high of 45,600 won and low of 16,510 won are screen figures and I did not recount 250 sessions myself, so I kept drawdown out of the argument. I also dropped the one-month, three-month, six-month and twelve-month return figures and the 20, 60 and 120-session moving averages. The price series contains an intraday row for September 29 whose exchange scope field is empty, and my rule is that when the exchange scope or adjustment basis of a series is not uniform I remove the whole family of change figures.
Dividend per share of 125 won, a yield of 0.6188 percent and a payout ratio of 36.49 percent were calculated and not used. The indicator screen reports seven consecutive years of dividend increases while the one-year growth field on the same screen reads 0.0 percent and the filing history shows 125 won in both 2024 and 2025. That is an internal contradiction on one screen, so it sits here instead of in the argument. Operating cash flow and capital expenditure were also left out. The March 31, 2022 close of 6,200 won comes from a row with an empty price-basis field, and this company has no split or reverse split on record, so I used it as printed. The exchange rate throughout is 1,365.1 KRW per USD, the Seoul market daytime close on Monday, September 28, 2026, reported up 7.6 won on the session.
What happens if I swap the comparison period?
The answer this piece produced was one item back. That answer comes out of my choosing January to March 2022 as the comparison. Swapping that choice shows which sentences survive it.
Put April to June 2022 in its place, at 238,096 million won, and the revenue gap widens to 2.3163 percent. The sentence about revenue coming back cannot be written at all, and the piece becomes an ordinary account of falling revenue. The count drops from one to zero.
Move the unit to full years and it swings the other way. The 2022 operating margin was 5.6100 percent and 2025 was 5.6166 percent, a difference of 0.0066 points. Annual revenue fell 6.7239 percent, from 1,152,680 million won to 1,075,175 million won, so revenue did not come back and margin did. The count is one again, and the item inside it changes from revenue to margin.
So the sentence that survives every swap is that nothing at this company comes back more than one item at a time, and the sentence that dies is that the thing which came back is revenue. Whoever picks the comparison period gets to pick what looks recovered. When the July to September figures arrive on November 14 I will build this table against a third comparison, and the first thing I will check is whether the count still refuses to go above one.
Sources
Financial figures are consolidated filings with Korea’s Financial Supervisory Service accessed through Kiwoom, latest period the second quarter of 2026, filing number 20260814000366. Screen figures are Kiwoom data on the September 28, 2026 close. Results reporting is from ZDNet Korea, July 30, 2026 and Newdaily Biz of the same date, both Korean-language reports that I am paraphrasing. The brokerage estimate is Korean sell-side work reported by Etoday, August 27, 2026, the first-quarter cross-check is Korea Economic Daily, May 4, 2026, the price and multiple cross-check is the Chickstock quote page, the exchange rate is Money Today, September 28, 2026, and the peer figure is the Daifuku quote page.